• Cat-intel
  • MedIntelliX
  • Resources
  • About Us
  • Hero Background
    English
    Chinese
    French
    Japanese
    Korean
    German
    Spanish

    Vapor Deposition Market Trends

    ID: MRFR/CnM/2152-CR
    140 Pages
    Anshula Mandaokar
    May 2018

    Vapor Deposition Market, By Process (CVD and PVD), By Application (Into Microelectronics, Cutting Tool, Medical Devices & Equipment and Decorative Coatings) and By End-Use (Electrical & Electronics, Automotive, Aerospace) – Forecast till 2035

    Share:
    Download PDF ×

    We do not share your information with anyone. However, we may send you emails based on your report interest from time to time. You may contact us at any time to opt-out.

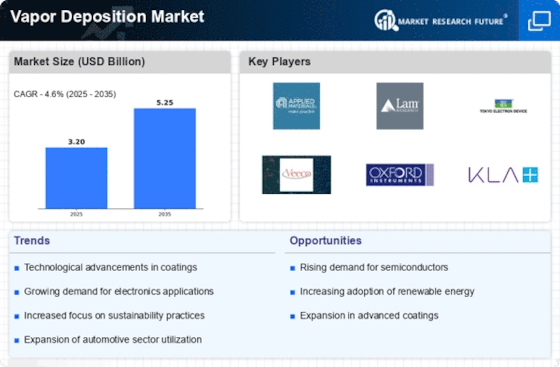
    Vapor Deposition Market Infographic
    $ 4,950.0
    $ 5,950.0
    $ 7,250.0

    Market Trends

    Key Emerging Trends in the Vapor Deposition Market

    The vapor deposition market has been experiencing significant trends that are shaping its landscape and driving its growth. One prominent trend is the increasing demand for thin-film deposition techniques in various industries such as electronics, automotive, aerospace, and medical devices. Thin-film deposition methods, including physical vapor deposition (PVD) and chemical vapor deposition (CVD), are being widely adopted for their ability to deposit uniform, high-quality films on substrates with precise control over thickness and composition. In recent years, there has been a growing focus on improving the efficiency and performance of vapor deposition processes. Manufacturers are investing in research and development to enhance deposition techniques, develop new materials, and optimize process parameters. This trend is driven by the need to meet the evolving requirements of advanced applications, such as semiconductor manufacturing, where thin-film deposition plays a crucial role in device fabrication and performance. Another notable trend in the vapor deposition market is the increasing adoption of vacuum deposition techniques. Vacuum deposition methods, which involve depositing materials in a low-pressure environment to minimize contamination and improve film quality, are gaining popularity across various industries. This trend is driven by the growing demand for high-performance coatings with superior mechanical, optical, and barrier properties. Furthermore, there is a rising interest in the use of atomic layer deposition (ALD) and molecular layer deposition (MLD) techniques for advanced thin-film deposition applications. ALD and MLD offer unique advantages, such as atomic-level control over film growth, excellent conformality, and the ability to deposit ultra-thin films with precise thickness control. These techniques are finding applications in areas such as semiconductor devices, energy storage, and biomedical implants, driving their adoption in the vapor deposition market. Moreover, sustainability and environmental considerations are increasingly influencing market trends in vapor deposition. Manufacturers are exploring eco-friendly deposition processes and materials that minimize waste generation, energy consumption, and harmful emissions. This includes the development of green deposition technologies, such as water-based and solvent-free deposition methods, as well as the use of recyclable and renewable materials for thin-film deposition. The vapor deposition market is also witnessing significant growth in demand from emerging economies, particularly in Asia-Pacific. Countries like China, India, and South Korea are investing heavily in infrastructure development, industrialization, and technological advancement, driving the demand for vapor deposition equipment and services. This trend is supported by the presence of a robust manufacturing base, increasing consumer electronics production, and rising investments in research and development activities. Furthermore, the advent of advanced materials and novel applications is opening up new opportunities in the vapor deposition market. For instance, the emergence of 2D materials, such as graphene and transition metal dichalcogenides, has sparked interest in developing novel deposition techniques and processes for their synthesis and integration into electronic and optoelectronic devices. Similarly, the growing demand for flexible and transparent conductive coatings for applications like flexible displays, solar cells, and wearable electronics is driving innovation in vapor deposition technologies.

    Market Summary

    As per Market Research Future Analysis, the Global Vapor Deposition Market was valued at USD 3.20 billion in 2024 and is projected to grow to USD 5.25 billion by 2035, reflecting a CAGR of 4.60% from 2025 to 2035. The market is driven by the rising demand for electronic devices, medical equipment, and lightweight materials in the automotive sector. The Asia Pacific region is expected to showcase impressive growth due to its developed electronics manufacturing sector, while North America and Europe also present significant opportunities. However, high installation costs and stringent regulations pose challenges to market expansion.

    Key Market Trends & Highlights

    Key trends influencing the vapor deposition market include technological advancements and increasing applications across various industries.

    • Vapor Deposition Market Size in 2024: USD 3.20 billion.
    • Projected Market Size by 2035: USD 5.25 billion.
    • CAGR during 2024-2032: 7.45%.
    • Asia Pacific expected to grow at 7.39% during the review period.

    Market Size & Forecast

    2024 Market Size USD 3.20 billion
    2035 Market Size USD 5.25 billion
    CAGR (2024-2035) 4.60%

    Major Players

    Key companies include Oerlikon Balzers Coating AG, ULVAC Technologies Inc., Applied Materials Inc., IHI Ionbond AG, ASM International N.V., JUSUNG ENGINEERING Co., Ltd., LAM RESEARCH CORPORATION, Kurt J. Lesker, Plasma-Therm LLC, and Aurora Scientific Corp.

    Market Trends

    The Global Vapor Deposition Market is poised for robust growth, driven by increasing demand in sectors such as electronics and renewable energy, which underscores the technology's critical role in advancing material science and manufacturing processes.

    U.S. Department of Energy

    Vapor Deposition Market Market Drivers

    Market Growth Projections

    The Global Vapor Deposition Market Industry is poised for substantial growth, with projections indicating a market size of 3.2 USD Billion in 2024 and an anticipated increase to 7.06 USD Billion by 2035. This growth trajectory reflects a compound annual growth rate (CAGR) of 7.46% from 2025 to 2035. The expansion is driven by various factors, including technological advancements, rising demand in electronics, and the growing aerospace sector. As industries continue to innovate and seek efficient coating solutions, the Global Vapor Deposition Market is likely to experience dynamic changes, positioning itself as a critical component in multiple sectors.

    Technological Advancements

    The Global Vapor Deposition Market Industry experiences a surge in demand due to continuous technological advancements. Innovations in deposition techniques, such as atomic layer deposition and chemical vapor deposition, enhance the precision and efficiency of coating processes. These advancements allow for the production of thinner films with improved properties, catering to industries like electronics and optics. As a result, the market is projected to reach 3.2 USD Billion in 2024, with expectations of further growth as technologies evolve. The integration of automation and smart manufacturing processes also contributes to increased productivity, thereby driving market expansion.

    Rising Demand in Electronics

    The Global Vapor Deposition Market Industry is significantly influenced by the rising demand for electronic components. As consumer electronics proliferate, the need for high-performance materials that can be achieved through vapor deposition techniques becomes paramount. For instance, the semiconductor industry relies heavily on these processes to create intricate microstructures essential for modern devices. This trend is expected to propel the market to 7.06 USD Billion by 2035, reflecting a robust growth trajectory. The increasing complexity of electronic devices necessitates advanced coating solutions, thereby underscoring the importance of vapor deposition in meeting industry requirements.

    Growing Aerospace and Defense Sector

    The Global Vapor Deposition Market Industry benefits from the growing aerospace and defense sector, which demands high-performance materials for various applications. Coatings produced through vapor deposition techniques enhance the durability and performance of components used in aircraft and military equipment. These coatings provide resistance to extreme temperatures and corrosion, which are critical in aerospace applications. As governments invest in defense modernization, the market is likely to see increased adoption of vapor deposition technologies. This trend aligns with the projected CAGR of 7.46% from 2025 to 2035, indicating a sustained growth outlook driven by aerospace advancements.

    Emerging Applications in Renewable Energy

    The Global Vapor Deposition Market Industry is witnessing emerging applications in the renewable energy sector, particularly in solar energy technologies. Thin-film solar cells, which utilize vapor deposition techniques, are gaining traction due to their lightweight and flexible properties. This innovation is crucial for expanding solar energy adoption, as it allows for integration into various surfaces. The increasing focus on renewable energy sources is likely to drive further investment in vapor deposition technologies, thereby enhancing market growth. As the industry evolves, these applications may play a pivotal role in shaping the future landscape of the Global Vapor Deposition Market.

    Environmental Regulations and Sustainability

    The Global Vapor Deposition Market Industry is also shaped by stringent environmental regulations and a growing emphasis on sustainability. Manufacturers are increasingly adopting vapor deposition techniques that minimize waste and reduce environmental impact compared to traditional coating methods. This shift is driven by the need for eco-friendly solutions in various sectors, including automotive and construction. As industries strive to comply with regulations and improve their sustainability profiles, the demand for vapor deposition processes is expected to rise. This trend may contribute to the overall market growth, aligning with the anticipated increase in market size over the next decade.

    Market Segment Insights

    Regional Insights

    Key Companies in the Vapor Deposition Market market include

    Industry Developments

    • Q2 2024: Applied Materials to Invest $400 Million in New R&D Center for Advanced Deposition Technologies Applied Materials announced the opening of a new research and development facility in Silicon Valley focused on vapor deposition and other advanced semiconductor manufacturing processes, aiming to accelerate innovation in chip fabrication.
    • Q2 2024: ASM International Secures Major Contract for Atomic Layer Deposition Equipment from Leading Memory Chipmaker ASM International revealed it won a multi-year supply contract to provide atomic layer deposition (ALD) systems to a top global memory manufacturer, strengthening its position in the vapor deposition equipment market.
    • Q3 2024: Tokyo Electron Launches Next-Generation Chemical Vapor Deposition Tool for 3D NAND Production Tokyo Electron introduced a new CVD system designed for high-volume manufacturing of advanced 3D NAND flash memory, targeting increased throughput and improved film quality for semiconductor fabs.
    • Q3 2024: Veeco Instruments Announces Strategic Partnership with European Solar Manufacturer for Thin-Film Deposition Veeco Instruments entered a partnership with a major European solar panel producer to supply physical vapor deposition equipment for next-generation thin-film solar cell manufacturing.
    • Q4 2024: ULVAC Inc. Opens New Manufacturing Facility in South Korea for Vacuum Deposition Systems ULVAC Inc. inaugurated a new plant in South Korea dedicated to producing vacuum deposition equipment, aiming to meet rising demand from Asian semiconductor and display manufacturers.
    • Q4 2024: Lam Research Appoints New Chief Technology Officer to Lead Deposition Technology Innovations Lam Research named Dr. Priya Raman as CTO, tasking her with driving advancements in chemical and physical vapor deposition technologies for next-generation semiconductor devices.
    • Q1 2025: Applied Materials Unveils Innovative Physical Vapor Deposition Platform for Advanced Packaging Applied Materials launched a new PVD platform tailored for advanced semiconductor packaging, enabling finer interconnects and improved device reliability.
    • Q1 2025: Entegris Acquires Deposition Materials Business from Specialty Chemicals Firm Entegris completed the acquisition of a leading deposition materials division from a specialty chemicals company, expanding its portfolio for semiconductor manufacturing.
    • Q2 2025: ASM International Opens New Customer Support Center in Taiwan for Deposition Equipment ASM International established a new support and training center in Hsinchu, Taiwan, to provide technical assistance and training for its vapor deposition equipment customers in Asia.
    • Q2 2025: Oxford Instruments Wins Contract to Supply Atomic Layer Deposition Tools to European Research Consortium Oxford Instruments secured a contract to deliver ALD systems to a European research consortium focused on developing next-generation nanoelectronics.
    • Q3 2025: Veeco Instruments Launches New Physical Vapor Deposition System for Power Electronics Veeco Instruments released a new PVD system optimized for manufacturing power electronic devices, targeting applications in electric vehicles and renewable energy.
    • Q3 2025: Lam Research Announces $250 Million Expansion of Oregon Facility to Boost Deposition Tool Production Lam Research announced a $250 million investment to expand its Oregon manufacturing site, increasing capacity for chemical and physical vapor deposition equipment.

    Segmentation Table

    By Process

      • chemical vapor deposition (CVD)
      • physical vapor deposition (PVD)

    By Application

      • microelectronics
      • cutting tool
      • medical devices & equipment
      • decorative coatings

    By End-Use

      • electrical & electronics
      • automotive
      • aerospace
      • metal industry
      • medical

    Future Outlook

    Vapor Deposition Market Future Outlook

    The Global Vapor Deposition Market is projected to grow at 4.60% CAGR from 2025 to 2035, driven by advancements in technology, increasing demand in electronics, and sustainable manufacturing practices.

    New opportunities lie in:

    • Invest in R&D for advanced materials to enhance deposition efficiency.
    • Expand into emerging markets with tailored vapor deposition solutions.
    • Leverage automation and AI to optimize deposition processes and reduce costs.

    By 2035, the Vapor Deposition Market is expected to achieve substantial growth, reflecting evolving industry needs and technological advancements.

    Market Segmentation

    Report Scope

    Attribute/Metric Details
    Market Size 2024 USD 3.20 billion
    Market Size 2035 5.25
    CAGR 2024-2032 4.60% (2025 - 2035)
      Base Year 2024
      Forecast Period 2025 - 2035
      Historical Data   2019 & 2020
      Forecast Units   Value (USD Million)
      Report Coverage   Revenue Forecast, Competitive Landscape, Growth Factors, and Trends
      Segments Covered   Process, Application and End-Use
      Geographies Covered   North America, Europe, Asia-Pacific, and Rest of the World (RoW)
      Key Vendors   Oerlikon Balzers Coating AG, ULVAC Technologies Inc., Applied Materials Inc., IHI Ionbond AG, ASM International N.V, JUSUNG ENGINEERING Co., Ltd., LAM RESEARCH CORPORATION, Kurt J. Lesker, Plasma-Therm LLC., Aurora Scientific Corp.
      Key Market Opportunities   Asia Pacific to Offer Lucrative Opportunities
      Key Market Drivers   Rapidly Surging Demand for Electronic Devices to Benefit the Market
    Market Size 2025 3.35

    Market Highlights

    Author

    Anshula Mandaokar
    Team Lead - Research

    She holds an experience of about 6+ years in market research and business consulting, working under the spectrum of information communication technology, telecommunications and semiconductor domains. aarti conceptualizes and implements a scalable business strategy and provides strategic leadership to the clients. her expertise lies in market estimation, competitive intelligence, pipeline analysis, customer assessment, etc.

    Leave a Comment

    Latest Comments

    John Doe
    john@example.com

    This is a great article! Really helped me understand the topic better.

    Posted on July 23, 2025, 10:15 AM
    Jane Smith
    jane@domain.com

    Thanks for sharing this. I’ve bookmarked it for later reference.

    Posted on July 22, 2025, 7:45 PM

    FAQs

    What will be the possible market valuation of the vapor deposition market?

    The global vapor deposition market is predicted to touch USD 2.94 billion by 2023.

    At what CAR is the global vapor deposition market predicted to grow over the forecast period?

    The vapor deposition market is predicted to grow at a 7.45% CAGR between 2024-2032.

    Which region is predicted to have the largest share in the vapor deposition market?

    The APAC region is likely to have the largest share in the vapor deposition market.

    Who are the eminent players profiled in the vapor deposition market?

    Eminent players profiled in the vapor deposition market include Aurora Scientific Corp., Plasma-Therm LLC.,. Kurt J. Lesker, LAM RESEARCH CORPORATION, JUSUNG ENGINEERING Co., Ltd., ASM International N.V, IHI Ionbond AG, Applied Materials Inc., ULVAC Technologies, Inc., and Oerlikon Balzers Coating AG.

    What are the various applications of vapor deposition market?

    It is widely used in medical, metal industry, aerospace, automotive, and electronics and electrical.

    1. List of Tables and Figures
      1. TABLE 1 MARKET SYNOPSIS 15
      2. TABLE
      3. 2 LIST OF ASSUMPTIONS 18
      4. TABLE 3 GLOBAL VAPOR DEPOSITION MARKET, BY PROCESS,
      5. 2020-2027 (USD MILLION) 42
      6. TABLE 4 GLOBAL VAPOR DEPOSITION MARKET FOR
      7. CHEMICAL VAPOR DEPOSITION, 2020-2027 (USD MILLION) 43
      8. TABLE 5 GLOBAL VAPOR
      9. DEPOSITION MARKET FOR LOW PRESSURE CVD, 2020-2027 (USD MILLION) 43
      10. TABLE
      11. 6 GLOBAL VAPOR DEPOSITION MARKET FOR ATMOSPHERIC PRESSURE CVD, 2020-2027 (USD MILLION)
      12. 44
      13. TABLE 7 GLOBAL VAPOR DEPOSITION MARKET FOR PLASMA ENHANCED CVD, 2020-2027
      14. (USD MILLION) 44
      15. TABLE 8 GLOBAL VAPOR DEPOSITION MARKET FOR METAL ORGANIC
      16. CVD, 2020-2027 (USD MILLION) 45
      17. TABLE 9 GLOBAL VAPOR DEPOSITION MARKET
      18. FOR OTHERS CVD, 2020-2027 (USD MILLION) 45
      19. TABLE 10 GLOBAL VAPOR DEPOSITIONMARKET
      20. FOR PHYSICAL VAPOR DEPOSITION, 2020-2027 (USD MILLION) 46
      21. TABLE 11 GLOBAL
      22. VAPOR DEPOSITION MARKET FOR CATHODIC ARC DEPOSITION, 2020-2027 (USD MILLION) 46
      23. TABLE
      24. 12 GLOBAL VAPOR DEPOSITION MARKET FOR ELECTRON BEAM PVD, 2020-2027 (USD MILLION)
      25. 47
      26. TABLE 13 GLOBAL VAPOR DEPOSITION MARKET FOR SPUTTER DEPOSITION, 2020-2027
      27. (USD MILLION) 47
      28. TABLE 14 GLOBAL VAPOR DEPOSITION MARKET FOR OTHERS PVD,
      29. 2020-2027 (USD MILLION) 48
      30. TABLE 15 GLOBAL VAPOR DEPOSITION MARKET, BY
      31. APPLICATION, 2020-2027 (USD MILLION) 50
      32. TABLE 16 GLOBAL VAPOR DEPOSITIONMARKET
      33. FOR MICROELECTRONICS, 2020-2027 (USD MILLION) 51
      34. TABLE 17 GLOBAL VAPOR
      35. DEPOSITION MARKET FOR CUTTING TOOL, 2020-2027 (USD MILLION) 51
      36. TABLE 18
      37. GLOBAL VAPOR DEPOSITION MARKET FOR MEDICAL DEVICES & EQUIPMENT, 2020-2027 (USD
      38. MILLION) 52
      39. TABLE 19 GLOBAL VAPOR DEPOSITION MARKET FOR DECORATIVE COATINGS,
      40. 2020-2027 (USD MILLION) 52
      41. TABLE 20 GLOBAL VAPOR DEPOSITION MARKET FOR
      42. OTHERS, 2020-2027 (USD MILLION) 53
      43. TABLE 21 GLOBAL VAPOR DEPOSITION MARKET,
      44. BY END-USE INDUSTRY, 2020-2027 (USD MILLION) 55
      45. TABLE 22 GLOBAL VAPOR
      46. DEPOSITION MARKET FOR ELECTRICAL & ELECTRONICS, 2020-2027 (USD MILLION) 56
      47. TABLE
      48. 23 GLOBAL VAPOR DEPOSITION MARKET FOR AUTOMOTIVE, 2020-2027 (USD MILLION) 56
      49. TABLE
      50. 24 GLOBAL VAPOR DEPOSITION MARKET FOR AEROSPACE, 2020-2027 (USD MILLION) 57
      51. TABLE
      52. 25 GLOBAL VAPOR DEPOSITION MARKET FOR METAL INDUSTRY, 2020-2027 (USD MILLION) 57
      53. TABLE
      54. 26 GLOBAL VAPOR DEPOSITION MARKET FOR MEDICAL, 2020-2027 (USD MILLION) 58
      55. TABLE
      56. 27 GLOBAL VAPOR DEPOSITION MARKET FOR OTHERS, 2020-2027 (USD MILLION) 58
      57. TABLE
      58. 28 GLOBAL VAPOR DEPOSITION MARKET, BY REGION, 2020-2027 (USD MILLION) 60
      59. TABLE
      60. 29 GLOBAL VAPOR DEPOSITION MARKET, BY PROCESS , 2020-2027 (USD MILLION) 61
      61. TABLE
      62. 30 GLOBAL VAPOR DEPOSITION MARKET, BY APPLICATION , 2020-2027 (USD MILLION) 61
      63. TABLE
      64. 31 GLOBAL VAPOR DEPOSITION MARKET, BY END-USE INDUSTRY , 2020-2027 (USD MILLION)
      65. 62
      66. TABLE 32 NORTH AMERICA VAPOR DEPOSITION MARKET, BY COUNTRY, 2020-2027
      67. (USD MILLION) 64
      68. TABLE 33 NORTH AMERICA VAPOR DEPOSITION MARKET, BY PROCESS
      69. , 2020-2027 (USD MILLION) 64
      70. TABLE 34 NORTH AMERICA VAPOR DEPOSITION MARKET,
      71. BY APPLICATION , 2020-2027 (USD MILLION) 65
      72. TABLE 35 NORTH AMERICA VAPOR
      73. DEPOSITION MARKET, BY END-USE INDUSTRY , 2020-2027 (USD MILLION) 65
      74. TABLE
      75. 36 U.S VAPOR DEPOSITION MARKET, BY PROCESS , 2020-2027 (USD MILLION) 66
      76. TABLE
      77. 37 U.S VAPOR DEPOSITION MARKET, BY APPLICATION , 2020-2027 (USD MILLION) 67
      78. TABLE
      79. 38 U.S VAPOR DEPOSITION MARKET, BY END-USE INDUSTRY , 2020-2027 (USD MILLION) 67
      80. TABLE
      81. 39 CANADA VAPOR DEPOSITION MARKET, BY PROCESS , 2020-2027 (USD MILLION) 68
      82. TABLE
      83. 40 CANADA VAPOR DEPOSITION MARKET, BY APPLICATION , 2020-2027 (USD MILLION) 69
      84. TABLE
      85. 41 CANADA VAPOR DEPOSITION MARKET, BY END-USE INDUSTRY , 2020-2027 (USD MILLION)
      86. 69
      87. TABLE 42 EUROPE VAPOR DEPOSITION MARKET, BY COUNTRY, 2020-2027 (USD
      88. MILLION) 71
      89. TABLE 43 EUROPE VAPOR DEPOSITION MARKET, BY PROCESS , 2020-2027
      90. (USD MILLION) 71
      91. TABLE 44 EUROPE VAPOR DEPOSITION MARKET, BY APPLICATION
      92. , 2020-2027 (USD MILLION) 72
      93. TABLE 45 EUROPE VAPOR DEPOSITION MARKET,
      94. BY END-USE INDUSTRY , 2020-2027 (USD MILLION) 72
      95. TABLE 46 GERMANY VAPOR
      96. DEPOSITION MARKET, BY PROCESS , 2020-2027 (USD MILLION) 73
      97. TABLE 47 GERMANY
      98. VAPOR DEPOSITION MARKET, BY APPLICATION , 2020-2027 (USD MILLION) 73
      99. TABLE
      100. 48 GERMANY VAPOR DEPOSITION MARKET, BY END-USE INDUSTRY , 2020-2027 (USD MILLION)
      101. 74
      102. TABLE 49 FRANCE VAPOR DEPOSITION MARKET, BY PROCESS , 2020-2027 (USD
      103. MILLION) 75
      104. TABLE 50 FRANCE VAPOR DEPOSITION MARKET, BY APPLICATION ,
      105. 2020-2027 (USD MILLION) 76
      106. TABLE 51 FRANCE VAPOR DEPOSITION MARKET, BY
      107. END-USE INDUSTRY , 2020-2027 (USD MILLION) 76
      108. TABLE 52 UK VAPOR DEPOSITION
      109. MARKET, BY PROCESS , 2020-2027 (USD MILLION) 77
      110. TABLE 53 UK VAPOR DEPOSITION
      111. MARKET, BY APPLICATION , 2020-2027 (USD MILLION) 78
      112. TABLE 54 UK VAPOR
      113. DEPOSITION MARKET, BY END-USE INDUSTRY , 2020-2027 (USD MILLION) 79
      114. TABLE
      115. 55 SPAIN VAPOR DEPOSITION MARKET, BY PROCESS , 2020-2027 (USD MILLION) 79
      116. TABLE
      117. 56 SPAIN VAPOR DEPOSITION MARKET, BY APPLICATION , 2020-2027 (USD MILLION) 80
      118. TABLE
      119. 57 SPAIN VAPOR DEPOSITION MARKET, BY END-USE INDUSTRY , 2020-2027 (USD MILLION)
      120. 80
      121. TABLE 58 REST OF EUROPE VAPOR DEPOSITION MARKET, BY PROCESS , 2020-2027
      122. (USD MILLION) 81
      123. TABLE 59 REST OF EUROPE VAPOR DEPOSITION MARKET, BY APPLICATION
      124. , 2020-2027 (USD MILLION) 82
      125. TABLE 60 REST OF EUROPE VAPOR DEPOSITION
      126. MARKET, BY END-USE INDUSTRY , 2020-2027 (USD MILLION) 82
      127. TABLE 61 ASIA-PACIFIC
      128. VAPOR DEPOSITION MARKET, BY COUNTRY, 2020-2027 (USD MILLION) 84
      129. TABLE
      130. 62 ASIA-PACIFIC VAPOR DEPOSITION MARKET, BY PROCESS , 2020-2027 (USD MILLION) 84
      131. TABLE
      132. 63 ASIA-PACIFIC VAPOR DEPOSITION MARKET, BY APPLICATION , 2020-2027 (USD MILLION)
      133. 85
      134. TABLE 64 ASIA-PACIFIC VAPOR DEPOSITION MARKET, BY END-USE INDUSTRY
      135. , 2020-2027 (USD MILLION) 85
      136. TABLE 65 CHINA VAPOR DEPOSITION MARKET, BY
      137. PROCESS , 2020-2027 (USD MILLION) 86
      138. TABLE 66 CHINA VAPOR DEPOSITION MARKET,
      139. BY APPLICATION , 2020-2027 (USD MILLION) 87
      140. TABLE 67 CHINA VAPOR DEPOSITION
      141. MARKET, BY END-USE INDUSTRY , 2020-2027 (USD MILLION) 87
      142. TABLE 68 JAPAN
      143. VAPOR DEPOSITION MARKET, BY PROCESS , 2020-2027 (USD MILLION) 88
      144. TABLE
      145. 69 JAPAN VAPOR DEPOSITION MARKET, BY APPLICATION , 2020-2027 (USD MILLION) 89
      146. TABLE
      147. 70 JAPAN VAPOR DEPOSITION MARKET, BY END-USE INDUSTRY , 2020-2027 (USD MILLION)
      148. 89
      149. TABLE 71 SOUTH KOREA VAPOR DEPOSITION MARKET, BY PROCESS , 2020-2027
      150. (USD MILLION) 90
      151. TABLE 72 SOUTH KOREA VAPOR DEPOSITION MARKET, BY APPLICATION
      152. , 2020-2027 (USD MILLION) 91
      153. TABLE 73 SOUTH KOREA VAPOR DEPOSITION MARKET,
      154. BY END-USE INDUSTRY , 2020-2027 (USD MILLION) 91
      155. TABLE 74 TAIWAN VAPOR
      156. DEPOSITION MARKET, BY PROCESS , 2020-2027 (USD MILLION) 92
      157. TABLE 75 TAIWAN
      158. VAPOR DEPOSITION MARKET, BY APPLICATION , 2020-2027 (USD MILLION) 93
      159. TABLE
      160. 76 TAIWAN VAPOR DEPOSITION MARKET, BY END-USE INDUSTRY , 2020-2027 (USD MILLION)
      161. 93
      162. TABLE 77 INDIA VAPOR DEPOSITION MARKET, BY PROCESS , 2020-2027 (USD
      163. MILLION) 94
      164. TABLE 78 INDIA VAPOR DEPOSITION MARKET, BY APPLICATION , 2020-2027
      165. (USD MILLION) 95
      166. TABLE 79 INDIA VAPOR DEPOSITION MARKET, BY END-USE INDUSTRY
      167. , 2020-2027 (USD MILLION) 95
      168. TABLE 80 REST OF ASIA-PACIFIC VAPOR DEPOSITION
      169. MARKET, BY PROCESS , 2020-2027 (USD MILLION) 96
      170. TABLE 81 REST OF ASIA-PACIFIC
      171. VAPOR DEPOSITION MARKET, BY APPLICATION , 2020-2027 (USD MILLION) 97
      172. TABLE
      173. 82 REST OF ASIA-PACIFIC VAPOR DEPOSITION MARKET, BY END-USE INDUSTRY , 2020-2027
      174. (USD MILLION) 97
      175. TABLE 83 MIDDLE EAST & AFRICA VAPOR DEPOSITION MARKET,
      176. BY PROCESS , 2020-2027 (USD MILLION) 99
      177. TABLE 84 MIDDLE EAST & AFRICA
      178. VAPOR DEPOSITION MARKET, BY PROCESS , 2020-2027 (USD MILLION) 99
      179. TABLE
      180. 85 MIDDLE EAST & AFRICA VAPOR DEPOSITION MARKET, BY APPLICATION , 2020-2027
      181. (USD MILLION) 100
      182. TABLE 86 MIDDLE EAST & AFRICA VAPOR DEPOSITION MARKET,
      183. BY END-USE INDUSTRY , 2020-2027 (USD MILLION) 100
      184. TABLE 87 GCC VAPOR DEPOSITION
      185. MARKET, BY PROCESS , 2020-2027 (USD MILLION) 101
      186. TABLE 88 GCC VAPOR DEPOSITION
      187. MARKET, BY APPLICATION , 2020-2027 (USD MILLION) 102
      188. TABLE 89 GCC VAPOR
      189. DEPOSITION MARKET, BY END-USE INDUSTRY , 2020-2027 (USD MILLION) 102
      190. TABLE
      191. 90 SOUTH AFRICA VAPOR DEPOSITION MARKET, BY PROCESS , 2020-2027 (USD MILLION) 103
      192. TABLE
      193. 91 SOUTH AFRICA VAPOR DEPOSITION MARKET, BY APPLICATION , 2020-2027 (USD MILLION)
      194. 104
      195. TABLE 92 SOUTH AFRICA VAPOR DEPOSITION MARKET, BY END-USE INDUSTRY
      196. , 2020-2027 (USD MILLION) 104
      197. TABLE 93 REST OF MIDDLE EAST & AFRICA
      198. VAPOR DEPOSITION MARKET, BY PROCESS , 2020-2027 (USD MILLION) 105
      199. TABLE
      200. 94 REST OF MIDDLE EAST & AFRICA VAPOR DEPOSITION MARKET, BY APPLICATION , 2020-2027
      201. (USD MILLION) 106
      202. TABLE 95 REST OF MIDDLE EAST & AFRICA VAPOR DEPOSITION
      203. MARKET, BY END-USE INDUSTRY , 2020-2027 (USD MILLION) 106
      204. TABLE 96 LATIN
      205. AMERICA VAPOR DEPOSITION MARKET, BY COUNTRY , 2020-2027 (USD MILLION) 108
      206. TABLE
      207. 97 LATIN AMERICA VAPOR DEPOSITION MARKET, BY PROCESS , 2020-2027 (USD MILLION) 108
      208. TABLE
      209. 98 LATIN AMERICA VAPOR DEPOSITION MARKET, BY APPLICATION , 2020-2027 (USD MILLION)
      210. 109
      211. TABLE 99 LATIN AMERICA VAPOR DEPOSITION MARKET, BY END-USE INDUSTRY
      212. , 2020-2027 (USD MILLION) 109
      213. TABLE 100 MEXICO VAPOR DEPOSITION MARKET,
      214. BY PROCESS , 2020-2027 (USD MILLION) 110
      215. TABLE 101 MEXICO VAPOR DEPOSITION
      216. MARKET, BY APPLICATION , 2020-2027 (USD MILLION) 111
      217. TABLE 102 MEXICO
      218. VAPOR DEPOSITION MARKET, BY END-USE INDUSTRY , 2020-2027 (USD MILLION) 111
      219. TABLE
      220. 103 BRAZIL VAPOR DEPOSITION MARKET, BY PROCESS , 2020-2027 (USD MILLION) 112
      221. TABLE
      222. 104 BRAZIL VAPOR DEPOSITION MARKET, BY APPLICATION , 2020-2027 (USD MILLION) 113
      223. TABLE
      224. 105 BRAZIL VAPOR DEPOSITION MARKET, BY END-USE INDUSTRY , 2020-2027 (USD MILLION)
      225. 113
      226. TABLE 106 REST OF LATIN AMERICA VAPOR DEPOSITION MARKET, BY PROCESS
      227. , 2020-2027 (USD MILLION) 114
      228. TABLE 107 REST OF LATIN AMERICA VAPOR DEPOSITION
      229. MARKET, BY APPLICATION , 2020-2027 (USD MILLION) 115
      230. TABLE 108 REST OF
      231. LATIN AMERICA VAPOR DEPOSITION MARKET, BY END-USE INDUSTRY , 2020-2027 (USD MILLION)
      232. 115
      233. TABLE 109 KEY DEVELOPMENT ABNALYSIS 118
      234.  
      235. 15
    2. List of Tables and Figures
      1. FIGURE 1 GLOBAL VAPOR DEPOSITION MARKET: MARKET STRUCTURE
      2. 18
      3. FIGURE 2 KEY TAKEAWAYS OF THE VAPOR DEPOSITION MARKET 19
      4. FIGURE
      5. 3 NORTH AMERICA MARKET SIZE & MARKET SHARE BY COUNTRY (2020) 21
      6. FIGURE
      7. 4 EUROPE MARKET SIZE & MARKET SHARE BY COUNTRY (2020) 22
      8. FIGURE 5
      9. ASIA-PACIFIC & MARKET SHARE BY COUNTRY (2020) 23
      10. FIGURE 6 LATIN AMERICA
      11. MARKET SIZE & MARKET SHARE BY COUNTRY (2020) 24
      12. FIGURE 7 MIDDLE EAST
      13. & AFRICA MARKET SIZE & MARKET SHARE BY COUNTRY (2020) 25
      14. FIGURE
      15. 8 VAPOR DEPOSITION MARKET, BY REGION, 2020 26
      16. FIGURE 9 RESEARCH PROCESS
      17. OF MRFR 28
      18. FIGURE 10 TOP DOWN & BOTTOM UP APPROACH 31
      19. FIGURE
      20. 11 MARKEY DYNAMICS OVERVIEW 33
      21. FIGURE 12 SUPPLY CHAIN ANALYSIS 38
      22. FIGURE
      23. 13 GLOBAL VAPOR DEPOSITIONMARKET, BY PROCESS, 2020-2027 41
      24. FIGURE 14 GLOBAL
      25. VAPOR DEPOSITION MARKET, BY APPLICATION, 2020-2027 50
      26. FIGURE 15 GLOBAL
      27. VAPOR DEPOSITION MARKET, BY END-USE INDUSTRY, 2020-2027 55
      28. FIGURE 16 GLOBAL
      29. VAPOR DEPOSITION MARKET, BY REGION, 2020-2027 60

    Vapor Deposition Market Segmentation

    Market Segmentation Overview

    • Detailed segmentation data will be available in the full report
    • Comprehensive analysis by multiple parameters
    • Regional and country-level breakdowns
    • Market size forecasts by segment
    Infographic

    Free Sample Request

    Kindly complete the form below to receive a free sample of this Report

    Get Free Sample

    Customer Strories

    “I am very pleased with how market segments have been defined in a relevant way for my purposes (such as "Portable Freezers & refrigerators" and "last-mile"). In general the report is well structured. Thanks very much for your efforts.”

    Victoria Milne

    Founder
    Case Study
    Chemicals and Materials