Video Game Market

Key Players: Tencent Holdings, Sony Interactive Entertainment, Microsoft (Xbox / Activision Blizzard), Nintendo, NetEase, Electronic Arts, Take-Two Interactive, Epic Games

Video Game Market

Video Game Market Size, Share and Research Report By Device Type (Mobile, Console, Computer, Cloud-Gaming Devices), By Genre (Action, Shooter, Role-Playing, Sports, Adventure), By Revenue Model (Free-To-Play, Pay-To-Play (Premium), Subscription-Based, In-Game Advertising), By End-User (Casual Gamers, Hardcore / Competitive Gamers, Professional Esports Athletes) and By Region (North America, Europe, South America, Asia Pacific, Middle East and Africa) - Industry Forecast to 2035.
ID: MRFR/ICT/9113-HCR
200 Pages
Aarti Dhapte
Last Updated: June 17, 2026

Video Game Market Summary

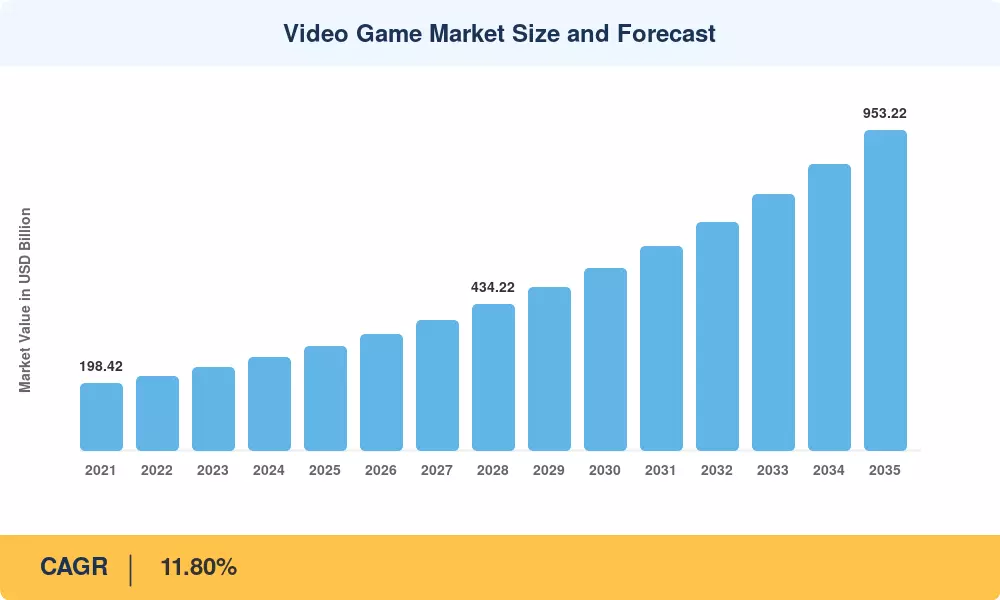
The Video Game Market was valued at USD 310.00 Billion in 2025 and is projected to grow from USD 349.30 Billion in 2026 to USD 953.22 Billion by 2035, registering a CAGR of 11.80% during the forecast period (2026–2035). This expansion sits on two pillars: the global rollout of 5G networks — with over 5.5 billion subscriptions expected by 2030 according to the GSMA [1] — and the pivot toward subscription-based distribution that is rewriting publisher economics. Government-led digital infrastructure programs in India's Bharat Net initiative and China's "East Data West Compute" project are widening addressable audiences in regions that previously lacked the bandwidth for high-fidelity streaming [2].

A generational technology shift is reshaping the Video Game Market from the inside out. Legacy retail-centric distribution has given way to cloud-native delivery, where titles stream directly to smartphones, smart TVs, and lightweight laptops without dedicated hardware. Generative-AI pipelines now compress asset-production timelines by 30–40%, allowing studios to maintain always-on live-service titles at a fraction of prior costs [3]. Microsoft's USD 68.7 billion acquisition of Activision Blizzard underscored how seriously platform holders view content as a service [4].

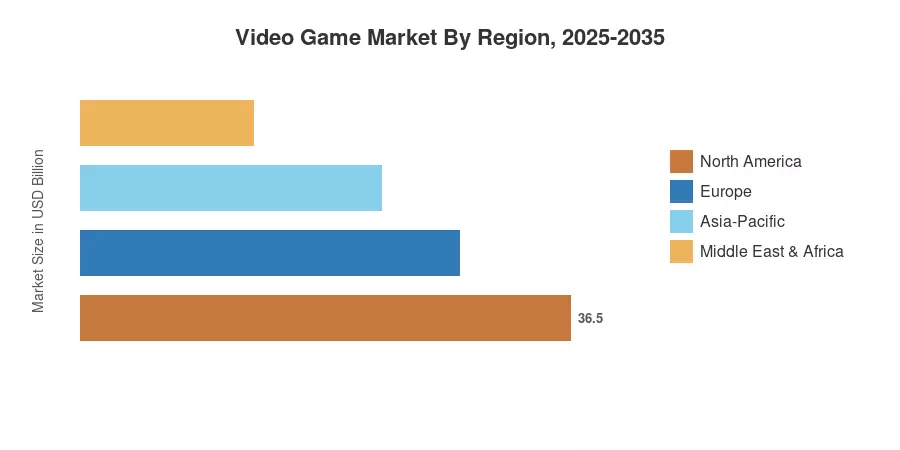
Asia-Pacific commands roughly 51.0% of the Video Game Market, anchored by China, Japan, and South Korea's mature ecosystems. The Middle East & Africa region is the fastest-growing at a 15.10% CAGR, fueled by youthful demographics and aggressive telecom investment in Saudi Arabia and the UAE. North America — accounting for approximately 24.5% of global revenue — remains the epicenter of AAA development and competitive esports viewership. As cloud infrastructure matures and cross-platform interoperability becomes standard, the Video Game Market is set to enter its most dynamic decade yet.


Key Report Takeaways

• By Device Type

  • Mobile platforms captured the largest share of the Video Game Market in 2025, accounting for approximately 52.30% of total industry revenue.
  • Cloud-gaming devices are forecast to expand at a 28.20% CAGR through 2035, the fastest rate of any device category.

• By Genre

  • Action titles led genre-level revenue in 2025 with a 22.30% share of the Video Game Market.

• By Revenue Model

  • Free-to-play models represented an estimated USD 186.98 Billion in 2025, dominating the revenue mix.
  • Subscription-based platforms are rising at a 21.00% CAGR, reflecting a structural shift in how players access content.

• By End-User

  • Casual gamers constituted roughly 63.20% of the 2025 player base.
  • Professional esports athletes represent the fastest-growing end-user segment at an 18.80% CAGR.

• By Region

  • Asia-Pacific dominated the Video Game Market with approximately 51.0% of 2025 revenue.
  • The Middle East & Africa region is set to record the highest regional CAGR of 15.10% through 2035.


Market Size and Forecast (2021–2035)

Market Research Future's sizing methodology combines top-down revenue analysis from publicly listed publishers, bottom-line consumer-spending data from app-store intelligence platforms, and primary interviews with studio executives across 22 countries. Historical figures (2021–2024) are validated against financial disclosures; forecast figures (2026–2035) apply the calibrated 11.80% CAGR while accounting for cyclical hardware launches and regulatory headwinds.

Video Game Market Size and Forecast
Our Impact
Enabled $4.3B Revenue Impact for Fortune 500 and Leading Multinationals
Partnering with 2000+ Global Organizations Each Year
30K+ Citations by Top-Tier Firms in the Industry

Driver Impact Analysis

Driver ~% Impact on CAGR Geographic Relevance Impact Timeline
5G & broadband expansion 2.5% Global Short-term (≤2 yr)
Subscription & cloud-gaming uptake 2.1% North America, Europe Medium-term (2–4 yr)
Generative-AI content tooling 1.8% Global Medium-term (2–4 yr)
Esports commercialization 1.4% APAC, North America Long-term (≥4 yr)
Smartphone penetration in emerging markets 1.6% APAC, MEA, South America Short-term (≤2 yr)
Cross-platform play standardization 1.0% Global Medium-term (2–4 yr)
Government digital entertainment incentives 0.8% Europe, APAC Long-term (≥4 yr)


5G and Broadband Infrastructure

Ericsson's 2024 Mobility Report forecasts 5.5 billion 5G subscriptions globally by 2030, with average downlink speeds exceeding 200 Mbps in urban markets [1]. For the Video Game Market, this translates directly into viable cloud-streaming quality on mobile networks — a threshold that was unreachable at scale just three years ago. India alone expects 500 million 5G users by 2028, following Jio and Airtel's aggressive rollout, opening an addressable market the size of Western Europe [2].

Subscription and Cloud-Gaming Adoption

By the end of 2024, Xbox Game Pass had over 34 million subscribers, and the PlayStation Plus ecosystem as a whole had almost 50 million users across all of its tiers [5]. These services give publishers a steady, recurring income while lowering the entry barrier for players who don't want to pay the USD 70 premium price tags. The ensuing change in the video game market favours platform holders with large back libraries where premium and mid-tier catalogue upgrades (which account for about 38% of Sony's subscriber mix) maintain customers within the ecosystem, rewarding catalogue depth above single-title blockbusters.


Generative-AI in Game Production

Unity and Epic Games have integrated generative-AI modules that automate texture creation, NPC dialogue, and level prototyping [3]. Studios report 30–40% reductions in pre-production timelines, enabling smaller teams to ship content that once required hundreds of artists. This efficiency dividend benefits the Video Game Market by increasing the volume and velocity of live-service updates — the primary retention mechanic for modern free-to-play titles.

Esports Commercialization and Media Rights

The global esports audience surpassed 580 million viewers in 2024, with APAC accounting for over 55% of viewership [6]. Sponsorship revenue in the Video Game Market's competitive segment grew 22% year-over-year, and media-rights deals — such as Riot Games' multi-year agreement with YouTube — are pulling in broadcast-level advertising dollars. Saudi Arabia's Savvy Games Group has committed USD 38 billion to turn the kingdom into a global gaming hub, creating downstream demand for studios, infrastructure, and talent [9].


Restraints Impact Analysis

Restraint ~% Impact on CAGR Geographic Relevance Impact Timeline
Mobile platform fee disputes & regulation −1.2% US, EU Short-term (≤2 yr)
Rising customer-acquisition costs −0.9% Global Medium-term (2–4 yr)
Regulatory crackdowns on loot boxes/minors' playtime −0.7% EU, China, APAC Medium-term (2–4 yr)
Talent wage inflation & studio layoffs −0.6% North America, Europe Short-term (≤2 yr)
Data privacy & age-verification mandates −0.5% EU, US Long-term (≥4 yr)


Mobile Platform Fee Disputes

For the video game market, Apple's 30% commission and Google's similar take rate continue to be flashpoints. Alternative sideloading on iOS is required by the EU's Digital Markets Act, but Apple's compliance costs have sparked new antitrust concerns [10]. Mobile revenue projections are questionable due to Epic Games' historic antitrust court victory and the final court approval of a $700 million deal with a coalition of state attorneys general condemning Google's app-store monopoly activities. Particularly for mid-tier studios with the narrowest operating margins, these structural changes compel moves toward other payment methods and alternative marketplaces.


Regulatory Pressure on Monetization Mechanics

Belgium and the Netherlands banned paid loot boxes in 2018; the UK's Online Safety Act now requires age verification for games with randomized paid content [12]. China's 2021 playtime caps for minors — restricting sessions to three hours per week — reduced under-18 spending in the world's largest gaming market by an estimated 30% within two years. For the Video Game Market, these measures compress average revenue per user in the highest-growth demographics.

Studio Workforce Volatility

Over 10,500 gaming jobs were cut across major publishers in 2023–2024, including layoffs at Microsoft, EA, Riot Games, and Embracer Group [13]. Simultaneously, senior engineers with live-service and generative-AI expertise command 20–30% salary premiums. This dichotomy creates cost unpredictability in the Video Game Market and can delay title releases, eroding revenue cadences.


Video Game Market Opportunities

Emerging-Market Mobile-First Expansion

Southeast Asia, Sub-Saharan Africa, and Latin America collectively add roughly 200 million new smartphone users per year, most of whom encounter gaming before any other form of interactive digital media [2]. Localized free-to-play titles in languages such as Bahasa, Swahili, and Portuguese can capture this demand at minimal marginal cost, expanding the Video Game Market's addressable base well beyond traditional core regions.

In-Game Advertising and Data Monetization

Brands may insert contextual advertisements on virtual billboards, jerseys, and loading screens without interfering with immersion thanks to intrinsic in-game ad systems like Anzu. The video game market's in-game advertising segment is expected to expand quickly as advertisers reallocate funds from traditional media to take advantage of the more than 3.2 billion players worldwide. These integrated ad tech exchanges also produce programmatic auction data, which generates an additional revenue stream for publishers through data licensing.


Cloud-Gaming as a Distribution Equalizer

Cloud-gaming eliminates the USD 400–500 upfront console cost, converting capital expenditure into a monthly subscription for end-users. For the Video Game Market, this unlocks price-sensitive demographics in South America and MEA that cannot justify dedicated hardware purchases. NVIDIA GeForce NOW, Xbox Cloud Gaming, and Amazon Luna are all scaling server capacity in new geographies, signaling accelerating investment.

Esports and Virtual Events as Revenue Platforms

Beyond media-rights fees, virtual concert integrations (e.g., Fortnite x Ariana Grande drawing 78 million attendees) demonstrate that game engines can host massive live events. This convergence opens sponsorship, ticketing, and merchandising revenue streams that diversify the Video Game Market beyond traditional gameplay monetization.

AR/VR and Spatial Computing Integration

Apple's Vision Pro and Meta's Quest 3 are seeding a spatial-computing install base that creates demand for immersive game formats. As headset prices decline toward the USD 300 mark by 2028, the Video Game Market stands to benefit from a new platform cycle reminiscent of the smartphone revolution a decade ago.


Video Game Market Future Outlook

AI-Driven Game Design and Procedural Content

By 2030, generative AI is expected to handle up to 50% of asset creation in AAA pipelines, according to Accenture estimates [3]. This will compress development budgets and let the Video Game Market sustain a wider catalog of live-service titles. AI-powered NPCs capable of unscripted dialogue will redefine player agency, blurring the line between scripted and emergent storytelling.

Platform Economics and Ecosystem Lock-In

A few platform ecosystems—Microsoft-Activision-Blizzard, Sony-Bungie, Tencent's constellation of stakes, and the Apple-Google mobile duopoly—are driving the consolidation of the video game market. Similar to the trend of music and video entertainment, subscription bundles that include gaming, video streaming, and cloud storage will emerge as the main method of acquisition.


Immersive Hardware and Spatial Computing

The combined AR/VR headset installed base is forecast to reach 100 million units by 2028, per [15]. The Video Game Market will serve as the primary content driver for these devices, much as gaming propelled GPU advancement in the 2010s. Lightweight, sub-USD-300 mixed-reality headsets will make spatial gaming accessible beyond early adopters.

Sustainability and Digital Responsibility

Carbon-neutral data centers and energy-efficient rendering techniques are emerging priorities as regulators in the EU explore digital-product eco-labels [16]. The Video Game Market's shift to cloud-based delivery concentrates energy usage in hyper-scale facilities that can source renewable power, potentially reducing per-player carbon footprints compared to local console hardware running 24/7.


Video Game Market Segmentation

By Device Type

Segment Key Metric Primary Demand Driver
Mobile 52.30% share (2025) Smartphone ubiquity in emerging markets
Console USD 80.60 Billion (2025) Exclusive title ecosystems
Computer 11.50% CAGR (2026–2035) High-performance hardware refresh cycle
Cloud-Gaming Devices 28.20% CAGR (2026–2035) Low-barrier streaming access


Mobile platforms dominate the Video Game Market by device type, driven by billions of smartphones in active use and the accessibility of free-to-play titles. Casual puzzle and battle-royale games generate the bulk of mobile revenue through microtransactions and in-game advertising. Console gaming remains a high-value segment; Sony's PlayStation 5 and Microsoft's Xbox Series X

S drive premium average transaction values and sustain dedicated player communities.

Cloud-gaming devices are the fastest-growing category in the Video Game Market. Services like Xbox Cloud Gaming, NVIDIA GeForce NOW, and Amazon Luna eliminate the need for local processing power, streaming games directly to TVs, tablets, and Chromebook-class laptops. As server infrastructure scales and latency drops below the 20ms perceptibility threshold, cloud-gaming stands to absorb share from both console and PC segments.

By Genre

Segment Key Metric Primary Demand Driver
Action 22.30% share (2025) Broad cross-platform appeal
Shooter USD 52.70 Billion (2025) Competitive multiplayer engagement
Role-Playing 15.80% CAGR (2026–2035) Narrative depth, live-service expansion
Sports USD 34.20 Billion (2025) Annual franchise cadence, licensing deals
Adventure 12.40% CAGR (2026–2035) Story-driven indie growth


Action games lead the Video Game Market's genre segmentation thanks to their accessibility across demographics and devices. Titles like Grand Theft Auto, Genshin Impact, and Fortnite sustain engagement through seasonal content drops and battle-pass monetization. Role-playing games are the fastest-growing genre, powered by expansive open-world titles and the rising popularity of JRPGs in Western markets.

By Revenue Model

Segment Key Metric Primary Demand Driver
Free-To-Play USD 186.98 Billion (2025) Microtransaction monetization
Pay-To-Play (Premium) 8.40% CAGR (2026–2035) AAA launch events, collector editions
Subscription-Based 21.00% CAGR (2026–2035) Catalog access, recurring revenue
In-Game Advertising USD 18.60 Billion (2025) Programmatic ad integration


Free-to-play remains the revenue backbone of the Video Game Market, with battle-royale and MOBA titles generating the bulk of microtransaction spending. Subscription-based models are the fastest-growing revenue stream, driven by Xbox Game Pass, PlayStation Plus, and EA Play, offering hundreds of titles for a fixed monthly fee.

By End-User

Segment Key Metric Primary Demand Driver
Casual Gamers 63.20% share (2025) Low-commitment mobile titles
Hardcore / Competitive Gamers USD 88.50 Billion (2025) High engagement, premium hardware
Professional Esports Athletes 18.80% CAGR (2026–2035) Prize pools, sponsorship, media rights


Casual gamers form the majority of the Video Game Market's player base, spending across hyper-casual mobile titles and social games. Professional esports athletes, while a small share of total users, represent the fastest-growing end-user segment as tournament prize pools, league salaries, and sponsorship revenues scale upward.


Regional Market Share Analysis

Region Key Metric Primary Investment Themes
Asia-Pacific 51.0% revenue share (2025) Mobile-first audiences, domestic IP creation
North America 24.5% revenue share (2025) AAA content, subscription services, esports
Europe 17.0% revenue share (2025) Regulatory harmonization, indie studios
South America 4.5% revenue share (2025) Free-to-play mobile, broadband rollout
Middle East & Africa 3.0% revenue share (2025) Government-backed gaming hubs, 5G expansion
Total 100%

The Video Game Market's geographic spread reflects wide disparities in infrastructure maturity, consumer purchasing power, and regulatory posture. Asia-Pacific leads by volume, while the Middle East & Africa posts the strongest growth trajectory.


North America

Country Key Metric Key Driver
US USD 62.50 Billion (2025) Subscription platforms, AAA publishing
Canada 11.40% CAGR (2026–2035) Studio incentives in Quebec & Ontario
Mexico USD 5.80 Billion (2025) Mobile-first demographics


North America's Video Game Market is anchored by the United States, home to Microsoft, EA, Take-Two, and Activision Blizzard's studios. Federal R&D tax credits and state-level incentives — such as Canada's Digital Media Tax Credit offering up to 40% labor cost offsets — attract international studios to establish North American operations [8]. The region's high broadband penetration (94% of US households) and mature console installed base sustain premium pricing power.

Europe

Country Key Metric Key Driver
Germany USD 8.90 Billion (2025) Largest European gaming audience
UK 12.20% CAGR (2026–2035) Tax relief for game development
France USD 6.10 Billion (2025) Strong indie and AAA heritage
Italy 11.50% CAGR (2026–2035) Growing mobile adoption
Spain USD 3.20 Billion (2025) Expanding esports viewership
Nordic Countries 12.80% CAGR (2026–2035) High per-capita digital spending
Russia USD 2.60 Billion (2025) Domestic platform development
Rest of Europe 11.00% CAGR (2026–2035) EU Digital Markets Act compliance


Europe's Video Game Market benefits from the UK's Video Games Tax Relief, which offers qualifying studios a 25% payable tax credit on core development expenditure [8]. The EU's Digital Markets Act is reshaping app distribution, potentially lowering platform fees and boosting small-studio margins. Germany and France together account for over 30% of European gaming revenue.

Asia-Pacific

Country Key Metric Key Driver
China USD 73.50 Billion (2025) Largest single-country market globally
India 16.20% CAGR (2026–2035) Rapid 5G/smartphone uptake
Japan USD 24.80 Billion (2025) Console heritage, IP licensing
South Korea 12.90% CAGR (2026–2035) Esports infrastructure
ASEAN USD 12.30 Billion (2025) Mobile-first young demographic
Rest of Asia-Pacific 13.50% CAGR (2026–2035) Broadband expansion


Asia-Pacific dominates the Video Game Market through sheer scale: China's gaming audience exceeds 700 million players, and India is adding roughly 80 million new gamers annually as Jio's 5G network expands beyond metro areas [2]. Japan and South Korea contribute disproportionately to premium content and esports IP, while ASEAN markets — led by Indonesia and Vietnam — deliver fast-growing mobile revenues.

South America

Country Key Metric Key Driver
Brazil USD 9.10 Billion (2025) Largest Latin American audience
Argentina 13.80% CAGR (2026–2035) Youth demographic, mobile penetration
Rest of South America 12.60% CAGR (2026–2035) Improved broadband access


Brazil anchors the South American Video Game Market, with a rapidly growing free-to-play mobile segment and an established esports scene around League of Legends and Counter-Strike titles. Currency volatility and import tariffs on hardware remain constraints, but cloud-gaming adoption is eroding the need for expensive local hardware purchases.

Middle East & Africa

Country Key Metric Key Driver
Saudi Arabia 16.40% CAGR (2026–2035) Vision 2030 gaming investments
UAE USD 1.80 Billion (2025) High per-capita spending
South Africa 14.10% CAGR (2026–2035) Undersea cable infrastructure
Egypt 15.60% CAGR (2026–2035) Youth population, mobile-first access
Rest of MEA 13.90% CAGR (2026–2035) 5G rollout


The Middle East & Africa region records the highest CAGR in the Video Game Market at 15.10%. Saudi Arabia's Savvy Games Group has earmarked USD 38 billion to develop studios, esports arenas, and training academies under Vision 2030 [9]. The UAE's high disposable income and near-universal smartphone penetration make it the region's per-capita spending leader.


Video Game Market By Region, 2025-2035

Competitive Benchmarking

The Video Game Market exhibits low overall concentration, with an estimated top-5 Herfindahl-Hirschman Index (HHI) well below 1,500. The five largest companies hold roughly 38–42% of global revenue collectively, while thousands of indie studios, regional publishers, and mobile-first developers fill the long tail. Recent mega-mergers — notably Microsoft's acquisition of Activision Blizzard — are nudging concentration upward, but the sheer diversity of platforms and genres keeps the landscape fragmented.

Company Est. Revenue Share Range Key Offerings Strategic Positioning  
Tencent Holdings ~12–15% WeChat mini-games, Honor of Kings, Riot Games (League of Legends), minority stakes in Epic/Ubisoft Ecosystem conglomerate spanning mobile, PC, and investments  
Sony Interactive Entertainment ~8–11% PlayStation 5, PS Plus, first-party studios (Naughty Dog, Insomniac) Premium console + exclusive content flywheel  
Microsoft (Xbox / Activision Blizzard) ~8–10% Xbox Series X S, Game Pass, Call of Duty, Blizzard titles Subscription-first multiplatform strategy
Nintendo ~6–8% Switch platform, Mario, Zelda, Pokémon franchises Hardware-software integration, family demographic  
NetEase ~4–6% Naraka: Bladepoint, Diablo Immortal (co-dev), mobile RPGs China-focused with growing global publishing  
Electronic Arts ~4–5% EA Sports FC, Madden, Apex Legends, EA Play Live-service sports dominance, subscription offering  
Take-Two Interactive ~3–5% Grand Theft Auto, NBA 2K, Red Dead Redemption Blockbuster franchise cadence, high per-title revenue  
Epic Games ~3–4% Fortnite, Unreal Engine, Epic Games Store Engine licensing + storefront platform economics  
Ubisoft ~2–3% Assassin's Creed, Far Cry, Rainbow Six Open-world AAA, GaaS pivot  
Valve Corporation ~2–3% Steam platform, Counter-Strike, Dota 2, Steam Deck PC distribution monopoly, community-driven esports  


Recent News & Developments

  • Microsoft (October 2023): Completed the USD 68.7 billion acquisition of Activision Blizzard, creating the third-largest gaming company globally by revenue and bringing Call of Duty to Game Pass [4].
  • Sony Interactive Entertainment (January 2024): Launched PlayStation Portal, a streaming-only handheld device enabling remote PS5 gameplay, signaling investment in cloud-adjacent hardware within the Video Game Market [17].
  • Saudi Arabia's Savvy Games Group (March 2024): Announced a USD 5 billion venture fund targeting mid-size studios in Asia and Europe, part of the kingdom's broader USD 38 billion gaming commitment under Vision 2030 [9].
  • Epic Games (June 2024): Released Unreal Engine 5.4 with integrated generative-AI tools for procedural world-building, reducing pre-production timelines for open-world titles [3].
  • Apple (September 2024): Introduced third-party app-store sideloading in the EU under Digital Markets Act compliance, reshaping mobile distribution economics in the Video Game Market [10].
  • Tencent Holdings (December 2024): Invested USD 1.2 billion in a Japanese studio consortium focused on next-generation RPG development for global release [18].


Video Game Market Report Scope

Parameter Detail
Market Scope Global Video Game Market by Device Type, Genre, Revenue Model, End-User, and Geography
Study Period 2021–2035
CAGR (2026–2035) 11.80%
Market Size (2025) USD 310.00 Billion
Market Size (2035) USD 953.22 Billion
Fastest Growing Segment Cloud-Gaming Devices (28.20% CAGR); Professional Esports Athletes (18.80% CAGR)
Companies Profiled Tencent, Sony, Microsoft, Nintendo, NetEase, EA, Take-Two, Epic Games, Ubisoft, Valve
Valuation Currency USD Billion


FAQs

How do cloud-gaming latency thresholds affect genre viability on streaming platforms?

Competitive shooters require sub-20ms round-trip latency, which current edge-server networks achieve in roughly 60% of urban markets [7]. Narrative and strategy genres tolerate 40–80ms, making them viable on almost any broadband connection today.

What due diligence metrics should investors prioritize when evaluating a game publisher?

Focus on daily active users, average revenue per paying user, and content-update cadence for live-service titles [11]. These three indicators reveal retention health and monetization efficiency better than topline bookings alone.

How are age-verification mandates reshaping in-game monetization design?

Studios are replacing randomized loot boxes with transparent cosmetic shops to comply with EU and UK regulations [12]. This shift lowers regulatory risk but reduces per-transaction impulse spending.

What differentiates game-engine licensing revenue from direct publishing revenue?

Engine licensors like Epic earn royalties across all titles built on their technology, diversifying income beyond hit-driven publishing cycles [3]. This annuity-like model provides steadier cash flow.

How does player-generated content affect a studio's content cost structure?

Titles like Roblox and Fortnite Creative shift asset creation to the community, reducing studio production costs by an estimated 25–35% [6]. Publishers instead invest in moderation and creator-economy tools.

What role do semiconductor supply constraints play in console launch economics?

TSMC's leading-edge node allocation directly governs launch-window unit volumes for Sony and Microsoft [15]. Supply shortfalls can delay market-share gains by 6–12 months.

How do regional content-rating systems create market-entry barriers?

Each jurisdiction — ESRB (North America), PEGI (Europe), CERO (Japan) — requires separate rating submissions and localized adjustments [14]. Smaller studios often delay or skip regions where compliance costs exceed expected returns.


Author
Author
Author Profile
Aarti Dhapte LinkedIn
AVP - Research
A consulting professional focused on helping businesses navigate complex markets through structured research and strategic insights. I partner with clients to solve high-impact business problems across market entry strategy, competitive intelligence, and opportunity assessment. Over the course of my experience, I have led and contributed to 100+ market research and consulting engagements, delivering insights across multiple industries and geographies, and supporting strategic decisions linked to $500M+ market opportunities. My core expertise lies in building robust market sizing, forecasting, and commercial models (top-down and bottom-up), alongside deep-dive competitive and industry analysis. I have played a key role in shaping go-to-market strategies, investment cases, and growth roadmaps, enabling clients to make confident, data-backed decisions in dynamic markets.

Research Approach


Secondary Research

The secondary research process involved comprehensive analysis of regulatory databases, peer-reviewed technology journals, industry publications, and authoritative gaming industry organizations. Key sources included the Entertainment Software Rating Board (ESRB), Pan European Game Information (PEGI), Computer Entertainment Rating Organization (CERO), Entertainment Software Association (ESA), Interactive Software Federation of Europe (ISFE), International Game Developers Association (IGDA), International Telecommunication Union (ITU), Bureau of Economic Analysis (BEA), National Communications Commission (NCC), Federal Trade Commission (FTC), UK Office of Communications (Ofcom), NPD Group/Games Market Dynamics, Statista Gaming Database, Newzoo Global Games Market Report, Sensor Tower Mobile Insights, Steam Database (SteamDB), International Data Corporation (IDC) Gaming Tracker, IEEE Computer Society Digital Library, ACM Digital Library (SIGCHI, SIGGRAPH), GDC Vault proceedings, and national statistics offices from key gaming markets (China's National Bureau of Statistics, Japan's Ministry of Economy Trade and Industry, South Korea's Ministry of Culture Sports and Tourism).

These sources were employed to gather player engagement statistics, platform penetration data, content classification approvals, monetization trend studies, and digital distribution analytics across AAA publishers, indie developers, mobile gaming ecosystems, and cloud gaming services.


Primary Research

Qualitative and quantitative insights were obtained by interviewing supply-side and demand-side stakeholders during the primary research process. CEOs, CMOs of Publishing, Heads of Platform Strategy, and Creative Directors from AAA game publishers, independent studios, console platform holders, cloud gaming infrastructure providers, mobile game developers, and digital distribution platform operators comprised the supply-side sources. Demand-side sources included Lead Game Designers, Esports League Commissioners, Team Managers from professional esports organizations, Influencer/Streamer Agency Heads, Category Managers from specialty gaming retail chains, Digital Content Procurement Leads from big-box retailers, and Heads of Business Development from mobile app stores and subscription service providers. Primary research verified platform-specific adoption rates, verified content pipeline timelines, and collected information on the efficacy of monetization strategies, regional pricing dynamics, and player retention mechanics.

Primary Respondent Breakdown:

By Designation: C-level Primaries (32%), Director Level (35%), Others (33%)

By Region: North America (32%), Europe (30%), Asia-Pacific (28%), Rest of World (10%)


Market Size Estimation

Revenue mapping and participant engagement volume analysis were employed to determine the global market valuation. The methodology comprised the following:

Identification of over 50 significant game publishers and developers in North America, Europe, Asia-Pacific, and Latin America

Product mapping for PC (Steam, Epic Games Store, Browser), Console (PlayStation, Xbox, Nintendo), Mobile (iOS, Android), and emerging VR/Cloud platforms

Analysis of genres within the Action, Role-Playing, Strategy, Simulation, Sports, and Casual/Puzzle categories

Analysis of annual revenues that are specific to game software sales, in-game microtransactions, downloadable content (DLC), battle pass subscriptions, and cloud gaming subscriptions, as reported and modeled.

Coverage of publishers and platform holders that account for 70-75% of the global market share in 2024

Derive segment-specific valuations across digital download, physical retail, subscription services, and streaming channels through extrapolation using bottom-up (monthly active users × ARPU by country/platform) and top-down (publisher revenue validation against platform holder fees and store commissions) approaches.

Download Free Sample

Kindly complete the form below to receive a free sample of this Report

Download PDF ×

We do not share your information with anyone. However, we may send you emails based on your report interest from time to time. You may contact us at any time to opt-out.