Vinyl Ester Market (2026 - 2035)

Vinyl Ester Market Research Report: By Application (Construction, Transportation, Marine, Chemical Processing, Electrical), By End Use Industry (Aerospace, Automotive, Energy, Manufacturing), By Product Type (Vinyl Ester Resin, Vinyl Ester Copolymer, Vinyl Ester Blends), By Formulation (General Purpose, High Performance, Specialty) and By Regional (North America, Europe, South America, Asia Pacific, Middle East and Africa) - Forecast to 2035.
ID: MRFR/CnM/3420-HCR
111 Pages
Chitranshi Jaiswal
Last Updated: July 03, 2026
Vinyl Ester Market
Market Size
Forecast Period2026-2035
CAGR (2026-2035)4.98%
2025 Market SizeUSD 1.24 Billion
2035 Market SizeUSD 2.02 Billion
Key Players
Ashland Inc.
AOC
Polynt-Reichhold Group
Sino Polymer Co. Ltd.
Interplastic Corporation
Swancor Inc.
Opportunities
  • Bio-Based and Low-Styrene Formulations
  • Hydrogen Infrastructure Buildout
  • Emerging Markets in Southeast Asia and Africa

Vinyl Ester Market Summary

The global Vinyl Ester Market reached an estimated USD 1.24 Billion in 2025 and is projected to grow from USD 1.30 Billion in 2026 to USD 2.02 Billion by 2035, registering a CAGR of 4.98% during the forecast period. Accelerating demand from chemical processing, water treatment, and energy infrastructure is anchoring this expansion. Governments across Asia and North America have earmarked over USD 340 billion in combined infrastructure and industrial modernization programs between 2024 and 2030, creating a sustained pull for high-performance lining and structural materials [1][2].

A technical revolution is changing the way end customers specify their resin systems. The vinyl ester formulations are steadily gaining popularity over traditional polyester and isophthalic resins by providing better resistance against hydrolysis, chlorine attack and heat cycling. The U.S. Department of Energy’s 2024 Advanced Manufacturing Initiative dedicated USD 1.8 billion to next-generation process equipment, explicitly naming vinyl ester-lined containers as a benchmark technology for severe chemical conditions [3]. This tailwind is pushing specifiers and fabricators toward higher-performance Vinyl Ester Market product lines across numerous verticals.


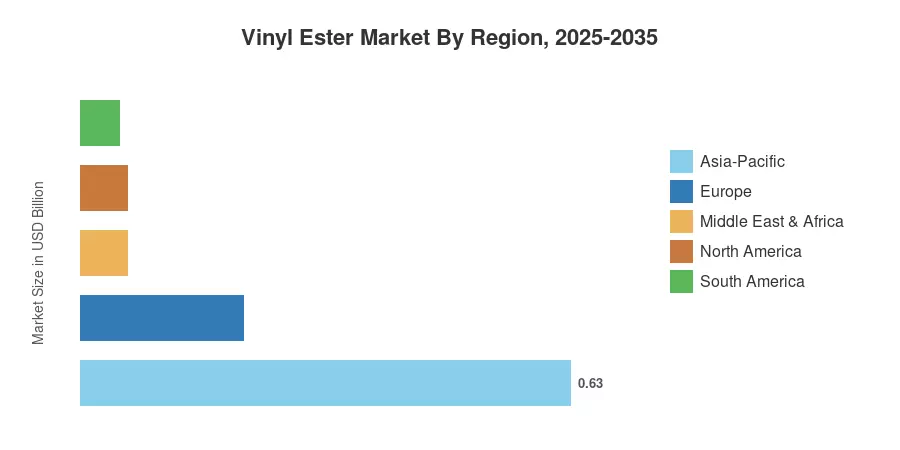
The Asia-Pacific region accounts for around 51% of the global Vinyl Ester Market revenue, as a result of fast-paced capacity build-outs in China, India and Southeast Asia. The region also has the highest CAGR of 5.20% until 2035. North America’s market share is roughly 22% due to refurbishment cycles in aged petrochemical and pulp-and-paper facilities, while Europe’s is around 17%, driven by offshore wind and wastewater infrastructure upgrades. Vinyl Ester Market set for a decade of compounding growth as regulatory standards tighten and asset owners desire longer service life.


Key Report Takeaways

• By Type

  • DGEBA-based resins captured approximately 57% of the Vinyl Ester Market in 2025, reflecting broad adoption across corrosion-barrier and structural laminate applications.
  • Epoxy Phenol Novolac (EPN) resins are expanding at a CAGR of 4.62%, gaining share in high-temperature chemical processing environments.

• By Application

  • Pipes and tanks represented roughly 69% of the Vinyl Ester Market in 2025, underpinned by global water and wastewater capital programs.
  • Paints and coatings applications are growing at a 4.45% CAGR as asset owners shift to longer-lasting protective systems.

• By Geography

  • Asia-Pacific held the largest share of the Vinyl Ester Market and is projected to record a 5.20% CAGR through 2035.
  • North America accounted for an estimated USD 0.27 Billion in 2025, led by U.S. chemical plant reinvestment.


Vinyl Ester Market Size and Forecast (2021–2035)

Market Research Future (MRFR) uses a triangulated approach to estimate demand, combining bottom-up resin shipment numbers from trade bodies, top-down demand modeling from end-use verticals, and firsthand interviews with formulators and distributors. Industry association filings and customs data corroborate historical figures. Forecast Projections use the calibrated 4.98% CAGR with modifications for cyclical capex timing and raw material price corridors.
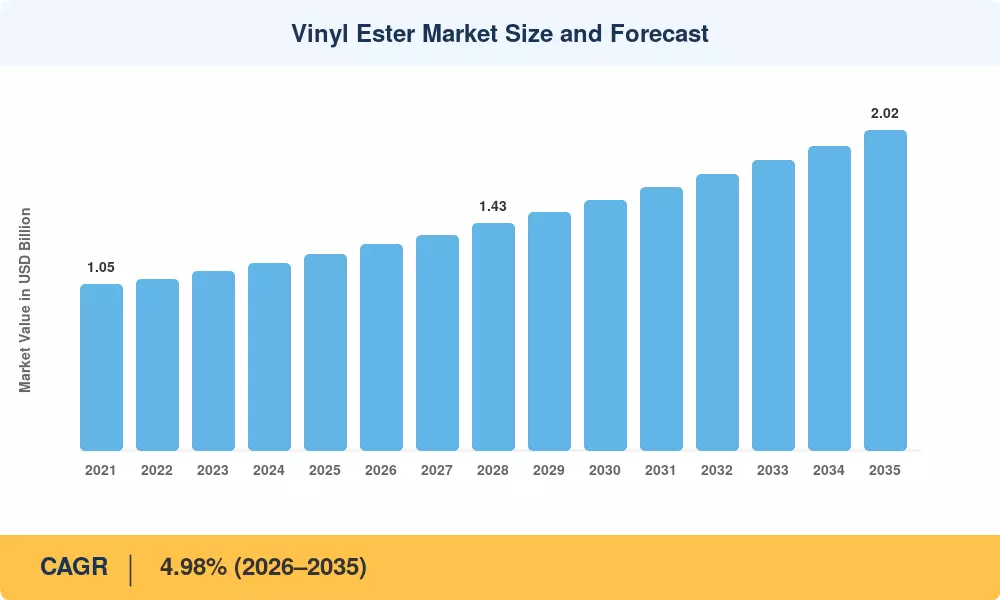
Vinyl Ester Market Size and Forecast
Our Impact
Enabled $4.3B Revenue Impact for Fortune 500 and Leading Multinationals
Partnering with 2000+ Global Organizations Each Year
30K+ Citations by Top-Tier Firms in the Industry

Driver Impact Analysis

Driver ~% Impact on CAGR Geographic Relevance Impact Timeline
Chemical plant refurbishment and relining ~22% North America, Europe Short-term (≤2 yr)
Water and wastewater infrastructure expansion ~20% Asia-Pacific, MEA Medium-term (2–4 yr)
Offshore wind turbine blade and nacelle demand ~15% Europe, Asia-Pacific Medium-term (2–4 yr)
Tightening environmental regulations (PFAS, VOC) ~14% North America, Europe Short-term (≤2 yr)
Hydrogen economy equipment fabrication ~12% Global Long-term (≥4 yr)
Desalination and brine-handling system growth ~10% Middle East, South Asia Medium-term (2–4 yr)
Replacement cycle for aging composite assets ~7% Global Long-term (≥4 yr)


Chemical Plant Refurbishment and Relining

Across North America, the aging of the chemical sector infrastructure—where a significant portion of assets have exceeded 25 years of service—is driving mandated integrity assessments under OSHA’s Process Safety Management (PSM) standard. Facility operators are increasingly prioritizing the replacement of legacy polyester-lined vessels with high-performance vinyl ester systems, which offer superior chemical resistance and can extend service intervals. While specific industry-wide maintenance spending figures vary, the chemical sector remains a critical market for long-term corrosion-resistant asset investments as operators seek to mitigate operational risks and extend asset lifecycles.


Water and Wastewater Infrastructure Expansion

The World Bank's 2024 Global Water Security report flagged a USD 150 billion annual funding gap in water infrastructure across developing economies [15]. Asia-Pacific nations — particularly India, Indonesia, and Vietnam — are deploying large-diameter GRP and FRP pipe networks that rely on vinyl ester inner linings to resist chloramine and sulfide attack. India's Jal Jeevan Mission alone targets 190 million rural household connections by 2026, creating a downstream pull that reinforces the Vinyl Ester Market pipeline.

Offshore Wind Turbine Demand

Europe's REPowerEU plan targets 60 GW of new offshore wind capacity by 2030, and blade manufacturers are increasingly specifying vinyl ester resins for root sections and spar caps where fatigue performance is critical [8]. China's 14th Five-Year Plan adds another 30 GW of offshore installations, amplifying the Vinyl Ester Market opportunity in structural laminates. Combined, these mandates represent a multi-billion-dollar resin demand channel over the next decade.

Tightening Environmental Regulations

The U.S. EPA’s 2024 National Primary Drinking Water Regulation for PFAS has set in motion a multi-year compliance cycle for water utilities, requiring the installation of new treatment and filtration vessels. While the regulation does not mandate specific materials, the technical requirements for these treatment systems are driving engineers toward robust, corrosion-resistant composite materials. In Europe, ongoing discussions regarding REACH restrictions on various bisphenol compounds are shifting market focus toward supply chains that can demonstrate transparency and regulatory compliance, favoring established resin suppliers with the capability to provide validated safety and performance data.


Restraints Impact Analysis

Restraint impact percentages are directional estimates reflecting the degree to which each factor could moderate the Vinyl Ester Market growth rate. They do not subtract linearly from the CAGR and are informed by supply-side interviews and pricing analysis.

Restraint ~% Impact on CAGR Geographic Relevance Impact Timeline
Feedstock price volatility (styrene, epoxy) ~−30% Global Short-term (≤2 yr)
Competition from novolac and epoxy alternatives ~−20% North America, Europe Medium-term (2–4 yr)
Skilled labor shortages in FRP fabrication ~−18% Global Medium-term (2–4 yr)
Styrene emission regulations (HAP limits) ~−17% North America, Europe Short-term (≤2 yr)
Long qualification cycles for new grades ~−15% Global Long-term (≥4 yr)


Feedstock Price Volatility

Styrene monomer—which typically constitutes 35–45% of a vinyl ester formulation by weight—is a significant driver of production costs. As a commodity chemical derived from crude oil and benzene, its pricing is susceptible to supply chain disruptions, such as refinery maintenance or regional logistics challenges. These price fluctuations can compress fabricator margins and influence procurement timelines. While larger formulators may mitigate risk through backward integration or long-term hedging, mid-tier blenders are often more exposed to market volatility, which can create pressure on R&D and capital reinvestment.


Competition from Alternative Resin Chemistries

The market for high-performance resins is evolving. While standard vinyl esters remain the workhorse for corrosion resistance in tanks and pipes, epoxy and novolac systems are increasingly specified in high-temperature or high-purity applications. Although these alternatives often command a price premium over standard vinyl esters, they are increasingly competitive in niche sectors where extreme thermal or chemical performance requirements justify the higher cost, such as in aerospace or advanced chemical processing.


Styrene Emission Regulations

OSHA's updated permissible exposure limit for styrene, tightened from 50 ppm to 20 ppm in 2024, raises compliance costs for open-mold fabrication shops that consume vinyl ester resins [10]. Fabricators must invest in closed-mold processes, vapor-capture systems, or low-styrene formulations — all of which add cost and complexity. This regulatory pressure is reshaping fabrication economics within the Vinyl Ester Market, particularly for smaller operators without capital for process upgrades.


Vinyl Ester Market Opportunities

Bio-Based and Low-Styrene Formulations

Resin producers are investing in plant-derived glycidyl ether intermediates and methacrylated soybean-oil crosslinkers that can reduce styrene content by up to 40% without sacrificing corrosion resistance [13]. Early commercial grades from European specialty houses entered qualification trials in 2024, and full-scale adoption could open a premium Vinyl Ester Market segment aligned with circular-economy procurement mandates.

Hydrogen Infrastructure Buildout

Electrolyzer balance-of-plant, high-pressure storage vessels, and alkaline brine handling systems all require chemically resistant composite materials. The IEA's 2024 Global Hydrogen Review projects over USD 90 billion in cumulative electrolyzer investment through 2030, and vinyl ester-lined pressure equipment is emerging as the specification of choice for high-purity, caustic-environment service [11]. This represents a greenfield opportunity for the Vinyl Ester Market.

Emerging Markets in Southeast Asia and Africa

Countries such as Vietnam, the Philippines, and Nigeria are investing heavily in municipal water, mining, and power-generation infrastructure — sectors where vinyl ester composites outperform metallic alternatives in total cost of ownership [15]. These regions are at an early stage of composite adoption, giving first-movers an opportunity to shape specification standards and distribution networks within the Vinyl Ester Market.

Digital Specification and Predictive Maintenance Platforms

Several fabricators are deploying IoT-enabled condition-monitoring sensors bonded into vinyl ester laminates to track residual thickness, chemical exposure, and temperature history in real time [19]. This data layer enables predictive maintenance scheduling and creates a recurring Vinyl Ester Market revenue stream tied to digital services rather than one-time resin sales.

Modular Prefabricated Composite Structures

The trend toward off-site construction and modular process skids is driving demand for factory-built, vinyl ester-lined pipe spools, ducting sections, and tank modules that can be shipped and assembled on-site. This approach reduces field labor requirements — directly addressing the skilled-workforce constraint — and accelerates project timelines, expanding the addressable Vinyl Ester Market for prefab composite specialists.


Vinyl Ester Market Future Outlook

Digitalization and Smart Composite Monitoring

Embedded fiber-optic sensors and IoT gateways are transforming vinyl ester composite installations from passive structures into data-generating assets. By 2030, an estimated 15% of new FRP process vessels in North America will ship with built-in condition-monitoring capability, enabling operators to shift from scheduled to predictive maintenance [19]. This digital layer deepens customer lock-in and creates aftermarket revenue channels within the Vinyl Ester Market.

Sustainability and Circular-Economy Pressures

The EU's forthcoming Ecodesign for Sustainable Products Regulation will mandate lifecycle environmental declarations for industrial composites by 2028, pushing formulators to document carbon footprints, recyclability pathways, and end-of-life options [13]. Producers that invest in closed-loop styrene recovery, bio-based feedstocks, and mechanical recycling processes will capture specification preference in the Vinyl Ester Market as procurement teams integrate sustainability scoring into vendor selection.

Hydrogen and Energy-Transition Equipment

The global electrolyzer installed base is expected to grow from under 1 GW in 2024 to over 130 GW by 2035, according to IRENA's World Energy Transitions Outlook [11]. Alkaline and PEM electrolyzer stacks require chemically resistant balance-of-plant components — pumps, heat exchangers, piping, and brine-handling tanks — where vinyl ester composites offer a compelling weight, corrosion, and cost advantage. This energy-transition supercycle positions the Vinyl Ester Market for structural demand growth well into the 2030s.

Consolidation and Platform Business Models

The competitive landscape is shifting toward platform-scale operators that combine resin formulation, application engineering, and aftermarket services under one roof. Recent M&A activity — including cross-border acquisitions in Asia and Europe — signals that top-tier players are assembling vertically integrated Vinyl Ester Market platforms capable of offering turnkey solutions from resin chemistry through installed-and-warranted composite structures [20].


Vinyl Ester Market Segmentation

By Type

Segment Key Metric Primary Demand Driver
Bisphenol A Diglycidyl Ether (DGEBA) 57% share (2025) Broad corrosion resistance, cost-effective processing
Epoxy Phenol Novolac (EPN) CAGR 4.62% High-temperature and aggressive-chemical environments
Other Types USD 0.09 Billion (2025) Specialty and hybrid formulations


DGEBA resins dominate the Vinyl Ester Market because they deliver an optimal balance of chemical resistance, mechanical strength, and ease of fabrication at a competitive price point. These resins are the default specification for pipes, tanks, scrubbers, and secondary containment in chemical processing, water treatment, and pulp-and-paper industries. Their relatively low viscosity allows hand-layup, filament winding, and closed-mold processing with minimal formulation adjustment.

EPN-based vinyl esters target the upper tier of the Vinyl Ester Market, where operating temperatures exceed 150 °C or chemical exposure involves concentrated acids, solvents, and oxidizers. Chlor-alkali plants, pharmaceutical reactors, and semiconductor wafer-fabrication chemical-delivery systems are primary consumers. Although EPN resins command a 20–30% price premium over DGEBA grades, their extended service life in extreme conditions justifies the investment for asset owners focused on total cost of ownership.

By Application

Segment Key Metric Primary Demand Driver
Pipes and Tanks 69% share (2025) Water infrastructure, chemical processing capex
Paints and Coatings CAGR 4.45% Protective coatings for steel and concrete assets
Transportation USD 0.05 Billion (2025) Lightweight structural components in rail and marine
Other Applications 4% share (2025) Electrical, construction, consumer products


Pipes and tanks represent the backbone of the Vinyl Ester Market, absorbing the largest share of resin volume globally. Municipal water utilities, industrial wastewater operators, and chemical manufacturers specify vinyl ester-lined GRP piping for its resistance to internal corrosion, low maintenance burden, and 25-year-plus design life. Large-diameter storage tanks for sulfuric acid, sodium hypochlorite, and other aggressive media constitute a high-value sub-segment within this category.

The paints and coatings application segment is gaining traction as asset owners seek longer recoating intervals for steel bridges, marine structures, and concrete containment basins. Vinyl ester-based coating systems offer 2–3 times the blister resistance of conventional polyester gel coats, positioning them as a premium protective option in the Vinyl Ester Market.


Regional Market Share Analysis

Region Key Metric Primary Investment Themes
Asia-Pacific 51% revenue share (2025) Chemical processing, water infrastructure, wind energy
North America CAGR 4.72% (2026–2035) Plant relining, PFAS compliance, hydrogen pilots
Europe USD 0.21 Billion (2025) Offshore wind, wastewater and circular-economy mandates
South America CAGR 4.35% (2026–2035) Mining, pulp-and-paper, oil and gas
Middle East & Africa USD 0.06 Billion (2025) Desalination, petrochemicals, power generation
Total USD 1.24 Billion (2025)

The Vinyl Ester Market exhibits a clear geographic hierarchy anchored by Asia-Pacific's manufacturing density and infrastructure investment momentum. North America and Europe follow as mature but active reinvestment markets, while South America and the Middle East & Africa represent earlier-stage growth pockets with outsized long-term potential.


North America

Country Key Metric Key Driver
United States 78% of regional share Chemical plant turnaround and EPA PFAS mandates
Canada CAGR 4.55% Mining and oil-sands pipe replacement
Mexico USD 0.01 Billion (2025) Petrochemical corridor expansion in Veracruz and Tabasco


The United States drives the Vinyl Ester Market in North America, with Gulf Coast chemical producers and Midwest pulp-and-paper facilities executing multiyear relining programs. Canada's oil-sands operators are replacing carbon-steel piping with composite alternatives to cut maintenance frequency, while Mexico's state-backed petrochemical modernization plan channels investment toward corrosion-resistant equipment.

Europe

Country Key Metric Key Driver
Germany 24% of regional share Chemical processing and automotive composites
United Kingdom CAGR 4.68% Offshore wind blade fabrication
France USD 0.03 Billion (2025) Nuclear plant cooling-water systems
Italy CAGR 4.42% Marine and yacht manufacturing
Spain 8% of regional share Desalination and water reuse
Nordic Countries CAGR 4.50% Offshore energy and pulp-mill upgrades
Russia USD 0.01 Billion (2025) Petrochemical and mining
Rest of Europe 11% of regional share Wastewater and general industrial


Europe's Vinyl Ester Market benefits from the EU's Green Deal Industrial Plan, which channels EUR 270 billion toward clean-energy manufacturing and infrastructure resilience [8]. Germany remains the largest national market, anchored by BASF and Bayer's chemical complex relining schedules, while the UK's Crown Estate seabed leasing rounds drive blade-fabrication demand.

Asia-Pacific

Country Key Metric Key Driver
China 42% of regional share Chemical parks, wind energy and water treatment
India CAGR 5.45% Jal Jeevan Mission, refinery expansion
Japan USD 0.07 Billion (2025) Semiconductor fab chemical handling
South Korea CAGR 5.10% Shipbuilding and battery plant infrastructure
ASEAN 12% of regional share Municipal water, mining and palm-oil processing
Rest of Asia-Pacific CAGR 4.80% General industrialization


Asia-Pacific's dominance in the Vinyl Ester Market rests on China's chemical-park expansion and India's accelerating infrastructure buildout. China's 14th Five-Year Plan earmarked over CNY 1.2 trillion for environmental-protection equipment upgrades, directly stimulating demand for lined process vessels and scrubber ducting [7]. India's refinery capacity is expanding from 254 MTPA to over 310 MTPA by 2028, generating specification cycles for vinyl ester-lined storage and transfer systems.

South America

Country Key Metric Key Driver
Brazil 62% of regional share Pulp-and-paper, mining, oil and gas
Argentina CAGR 4.20% Lithium brine handling, petrochemicals
Rest of South America USD 0.01 Billion (2025) Mining and municipal water


Brazil's pre-salt oil developments and expanding pulp-mill capacity make it the anchor of the South American Vinyl Ester Market. Argentina's lithium-triangle brine-processing facilities are adopting composite tankage to manage highly corrosive electrolyte solutions, adding a new end-use vector to the region.

Middle East & Africa

Country Key Metric Key Driver
Saudi Arabia 34% of the regional share NEOM and Vision 2030 desalination
UAE CAGR 4.60% Petrochemical and power-plant cooling
South Africa USD 0.008 Billion (2025) Mining and water treatment
Egypt CAGR 4.30% Suez Canal industrial corridor
Rest of MEA 18% of regional share General industrial and municipal water


Saudi Arabia's Vision 2030 program includes over USD 80 billion in desalination and industrial-water investments, driving specification of vinyl ester-lined GRP piping and storage vessels across multiple mega-projects [9]. The Vinyl Ester Market in the UAE benefits from sustained petrochemical expansion at Ruwais and Jebel Ali, while South Africa's mining sector is a nascent but growing consumer.


Vinyl Ester Market By Region, 2025-2035

Competitive Benchmarking

The Vinyl Ester Market is moderately concentrated, with the top five producers anticipated to hold a 55-62% share of the worldwide revenue. The Herfindahl-Hirschman Index is in the 1,200-1,500 range, which means that the market is not fragmented, but not monopolistic. The competition is on formulation breadth, technical service capability, feedstock integration and proximity of supply-chain region.

Company Est. Revenue Share Range Key Offerings Strategic Positioning
Ashland Inc. ~12–16% Hetron and Derakane vinyl ester lines Broadest corrosion-grade portfolio; integrated styrene supply
AOC (Aliancys) ~10–14% Vipel and Atlac product families Strong in Europe and Asia; closed-mold focus
Polynt-Reichhold Group ~8–12% Dion and Stypol resin systems Vertically integrated; wide geographic footprint
Scott Bader Company ~5–8% Crystic vinyl ester range UK-based; co-operative ownership model
Sino Polymer Co. Ltd. ~5–8% Cost-competitive DGEBA grades Dominant in the Chinese domestic Vinyl Ester Market
Interplastic Corporation ~4–7% CoREZYN vinyl ester products North American distribution strength
Swancor Inc. ~4–6% Wind-energy and industrial grades Leading supplier to Asian wind-blade fabricators
BUFA Composite Systems ~3–5% Polycor and Oldopal specialty lines European technical service network
Hexion Inc. ~3–5% Epoxy and vinyl ester hybrid systems Cross-selling from the epoxy platform
Resonac Holdings (formerly Showa Denko) ~2–4% High-purity electronic-grade resins Niche positioning in semiconductor fabrication


Recent News & Developments


  • AOC (Aliancys) (November 2024): Launched a low-styrene-emission vinyl ester resin series targeting European fabricators facing tightened workplace-exposure limits under the updated EU Chemical Agents Directive [10].


  • IRENA (July 2023): Published the World Energy Transitions Outlook 2023, projecting that global electrolyzer capacity must reach 350 GW by 2030 to meet net-zero pathways — a forecast that underscores the growing role of vinyl ester composites in hydrogen balance-of-plant equipment [11].


Vinyl Ester Market Report Scope

Parameter Detail
Market Scope Global Vinyl Ester Market, covering resin production, formulation, and end-use consumption
Study Period 2021–2035
CAGR 4.98% (2026–2035)
Base Year Market Size USD 1.24 Billion (2025)
Forecast Endpoint USD 2.02 Billion (2035)
Fastest Growing Segment (Type) DGEBA — CAGR 5.10%
Fastest Growing Region Asia-Pacific — CAGR 5.20%
Companies Profiled 10
Valuation Currency USD Billion


FAQs

What qualification testing should buyers require before specifying a new vinyl ester grade?
Buyers should demand ASTM C581 immersion testing at the target chemical concentration and temperature for a minimum of 12 months. Independent coupon testing under actual process conditions eliminates premature laminate failure.
How does styrene-monomer price hedging affect procurement strategy for vinyl ester resins?
Locking in quarterly styrene contracts can reduce resin-cost variability by 15–20%. Buyers with annual volumes above 200 metric tons typically negotiate index-linked pricing to share feedstock risk with suppliers [16].
What differentiates vinyl ester from isophthalic polyester in secondary-containment applications?
Vinyl ester resins resist hydrolysis and chemical permeation far longer, extending containment-system life to 25-plus years versus 10–12 years for isophthalic polyester. Lower lifecycle maintenance costs offset the upfront premium.
How are fabricators adapting to tighter styrene workplace-exposure limits?
Most fabricators are migrating to closed-mold processes such as vacuum infusion and RTM, which cut styrene emissions by over 90%. Low-styrene and styrene-free vinyl ester grades are also entering commercial production [10].
What role do vinyl ester composites play in hydrogen electrolyzer installations?
They line balance-of-plant piping, brine tanks, and heat exchangers exposed to hot caustic electrolyte. Composite solutions weigh 60–70% less than stainless-steel alternatives while matching corrosion resistance [11].
Are bio-based vinyl ester resins commercially viable at scale today?
Early commercial grades with 25–30% renewable carbon content are in qualification trials across Europe and North America. Full price parity with petroleum-based resins is expected by 2029 as feedstock supply chains mature [13].
What post-cure protocol maximizes long-term chemical resistance in vinyl ester laminates?
A staged post-cure — typically 2 hours at 80 °C followed by 4 hours at 120 °C — achieves near-full crosslink density. Incomplete post-cure is the leading root cause of premature liner degradation in field installations.    
Author
Author
Author Profile
Chitranshi Jaiswal LinkedIn
Team Lead - Research
Chitranshi is a Team Leader in the Chemicals & Materials (CnM) and Energy & Power (EnP) domains, with 6+ years of experience in market research. She leads and mentors teams to deliver cross-domain projects that equip clients with actionable insights and growth strategies. She is skilled in market estimation, forecasting, competitive benchmarking, and both primary & secondary research, enabling her to turn complex data into decision-ready insights. An engineer and MBA professional, she combines technical expertise with strategic acumen to solve dynamic market challenges. Chitranshi has successfully managed projects that support market entry, investment planning, and competitive positioning, while building strong client relationships. Certified in Advanced Excel & Power BI she leverages data-driven approaches to ensure accuracy, clarity, and impactful outcomes.

Research Approach


Secondary Research

The secondary research process involved comprehensive analysis of regulatory databases, industry publications, chemical manufacturing journals, and authoritative industrial organizations. Key sources included the US Environmental Protection Agency (EPA), Occupational Safety and Health Administration (OSHA), American Chemistry Council (ACC), European Chemicals Agency (ECHA), National Institute of Standards and Technology (NIST), American Composites Manufacturers Association (ACMA), Society of Plastics Engineers (SPE), International Maritime Organization (IMO), International Organization of Motor Vehicle Manufacturers (OICA), US Department of Energy (DOE), International Energy Agency (IEA), EU Eurostat Industrial Production Database, US Census Bureau Construction Spending Reports, Bureau of Transportation Statistics, and national chemical industry associations from key markets. These sources were used to collect production statistics, regulatory compliance data, safety studies, industrial demand trends, and market landscape analysis for vinyl ester resins, copolymers, blends, and specialty formulations.


Primary Research

As part of the initial research process, stakeholders from both the supply and demand sides were interviewed to get both qualitative and quantitative information. CEOs, VPs of Manufacturing, R&D heads, regulatory affairs managers, and commercial directors from chemical companies, composite material makers, and businesses that make vinyl ester resin were some of the supply-side sources. Sources on the demand side included procurement directors, engineering managers, plant managers, and technical leads from building companies, automakers, shipbuilders, chemical plants, and wind energy businesses. Primary study confirmed the division of the market into segments, set dates for expanding capacity, and gathered information on how materials are adopted, how prices are set, and how the supply chain works.

Primary Respondent Breakdown:

By Designation: C-level Primaries (32%), Director Level (30%), Others (38%)

By Region: North America (32%), Europe (30%), Asia-Pacific (28%), Rest of World (10%)


Market Size Estimation

Global market valuation was derived through production capacity mapping and consumption volume analysis. The methodology included:

Identification of 40+ key manufacturers across North America, Europe, Asia-Pacific, and Latin America

Product mapping across vinyl ester resin, vinyl ester copolymer, vinyl ester blends, and specialty formulation categories

Analysis of reported and modeled annual revenues specific to vinyl ester portfolios

Coverage of manufacturers representing 65-70% of global market share in 2024

Extrapolation using bottom-up (consumption volume × ASP by application/region) and top-down (manufacturer revenue validation) approaches to derive segment-specific valuations

Download Free Sample

Kindly complete the form below to receive a free sample of this Report

Download PDF ×

We do not share your information with anyone. However, we may send you emails based on your report interest from time to time. You may contact us at any time to opt-out.

















