• Cat-intel
  • MedIntelliX
  • Resources
  • About Us
  • Hero Background
    English
    Chinese
    French
    Japanese
    Korean
    German
    Spanish

    Vitamins D Market Size

    ID: MRFR/F-B & N/10454-CR
    167 Pages
    Pradeep Nandi
    July 2023

    Vitamins D Market Research Report Information by Type (Vitamins D3, and Mineral D2), Application (Bakery & Confectionery, Dairy & Frozen Desserts, Meat Alternatives, Oils & Fats, Sports Nutrition, Dairy Alternatives, Dietary Supplements, Breakfast Cereals, and Others), And by Region (North America, Europe, Asia-Pacific, Latin America, Middle East, and Africa) - Forecast Till 2035

    Share:
    Download PDF ×

    We do not share your information with anyone. However, we may send you emails based on your report interest from time to time. You may contact us at any time to opt-out.

    Vitamins D Market Infographic
    $ 4,950.0
    $ 5,950.0
    $ 7,250.0

    Vitamins D Size

    Vitamins D Market Growth Projections and Opportunities

    The Vitamins D market is shaped by various factors that collectively influence its dynamics and growth. A primary driver is the growing awareness of the essential role vitamin D plays in maintaining overall health. Vitamin D is crucial for bone health, immune system function, and various physiological processes. As consumers become more health-conscious and seek preventive measures, the demand for vitamin D supplements has risen. The increased awareness of vitamin D's importance, coupled with lifestyle factors that limit sun exposure, contributes to the market's expansion.

    Changing dietary habits and lifestyles contribute significantly to the Vitamins D market. Modern lifestyles, which may involve indoor work environments and sedentary behaviors, limit exposure to sunlight, a natural source of vitamin D. Additionally, dietary patterns that may not include sufficient vitamin D-rich foods prompt individuals to turn to supplements to meet their nutritional needs. This shift in dietary habits towards convenience and processed foods has led to a greater emphasis on supplementation to address potential deficiencies.

    The influence of scientific research and medical recommendations is a pivotal factor shaping the Vitamins D market. Ongoing research highlighting the multifaceted benefits of vitamin D, including its role in preventing chronic diseases, has contributed to medical professionals recommending supplements. Medical advice emphasizing the importance of maintaining optimal vitamin D levels for various health outcomes has driven consumer interest and adoption of vitamin D supplements.

    The impact of demographic factors, including aging populations, contributes to the growth of the Vitamins D market. As individuals age, there is a natural decline in the skin's ability to produce vitamin D from sunlight. The elderly population, often more susceptible to vitamin D deficiency, turns to supplements to support bone health, reduce the risk of fractures, and address other age-related health concerns. The aging demographic and their focus on maintaining overall health contribute to the sustained demand for vitamin D supplements.

    The influence of seasonal variations and geographical factors is evident in the Vitamins D market. Regions with limited sunlight during certain seasons may experience higher rates of vitamin D deficiency. Individuals in these areas, as well as those with limited sun exposure due to geographical location, may rely on supplements to maintain adequate vitamin D levels. Seasonal fluctuations and geographic considerations impact regional market trends and consumer preferences.

    The impact of health trends and the rise of preventive healthcare practices contribute to the growth of the Vitamins D market. Consumers increasingly view vitamin D supplements as a proactive measure to support immune health and prevent chronic diseases. The global emphasis on wellness and preventive healthcare aligns with the narrative of maintaining optimal vitamin D levels as part of a comprehensive health strategy.

    Technological advancements in supplement formulations play a significant role in the Vitamins D market. Efforts to enhance the bioavailability, taste, and convenience of vitamin D supplements contribute to product development and consumer acceptance. Innovations such as liquid formulations, chewable tablets, and combination products catering to diverse consumer preferences further fuel market growth.

    The impact of e-commerce and digital platforms transforms the accessibility and distribution of Vitamins D supplements. Consumers can easily research, compare, and purchase a variety of supplements online, making it convenient to explore different brands and formulations. The online presence of health and wellness information further influences consumer decision-making, contributing to the growth of the e-commerce segment in the vitamin D supplement market.

    Regulatory factors, including quality standards and labeling requirements, significantly influence the Vitamins D market. Governments and regulatory bodies enforce guidelines to ensure the safety, quality, and efficacy of dietary supplements. Manufacturers must comply with these regulations to gain consumer trust and meet the evolving standards in the industry, contributing to a more transparent and accountable vitamin D supplement market.
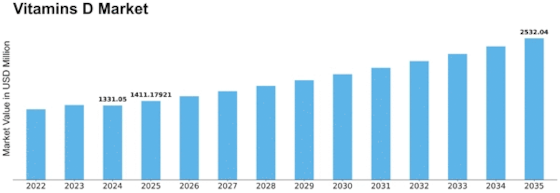
    Vitamins D Market Size Graph
    Author
    Pradeep Nandi
    Senior Research Analyst

    I have a bachelor's degree in mechanical engineering and an MBA. I have more than two years of expertise in the retail, food, and beverage, chemical, and material industries, and hence have developed a sound cross-domain expertise. A firm believer in lifelong learning and sharing of knowledge. Having a proclivity for hatching ideas and trying to absorb as much information as possible in a short amount of time. Introducing corporates to the data and insight, which enables them to move from probability to possibility, has been my key areas of interest. 

    Leave a Comment

    FAQs

    What is the current valuation of the Vitamins D Market as of 2024?

    The Vitamins D Market was valued at 1331.05 USD Million in 2024.

    What is the projected market valuation for the Vitamins D Market in 2035?

    The projected valuation for the Vitamins D Market in 2035 is 2532.04 USD Million.

    What is the expected CAGR for the Vitamins D Market during the forecast period 2025 - 2035?

    The expected CAGR for the Vitamins D Market during the forecast period 2025 - 2035 is 6.02%.

    Which companies are considered key players in the Vitamins D Market?

    Key players in the Vitamins D Market include Bayer AG, Pfizer Inc, Nestle SA, Amgen Inc, and DSM Nutritional Products.

    What are the main types of Vitamins D available in the market?

    The main types of Vitamins D available in the market are Vitamins D3 and D2, with D3 valued at 800.0 to 1500.0 USD Million and D2 at 531.05 to 1032.04 USD Million.

    What applications are driving the demand for Vitamins D?

    Applications driving demand for Vitamins D include Dietary Supplements, Dairy & Frozen Desserts, and Sports Nutrition, with Dietary Supplements valued at 532.99 to 1010.0 USD Million.

    How does the performance of the Dairy Alternatives segment compare to others?

    The Dairy Alternatives segment is projected to perform similarly to Dairy & Frozen Desserts, both valued between 199.66 and 380.0 USD Million.

    Market Summary

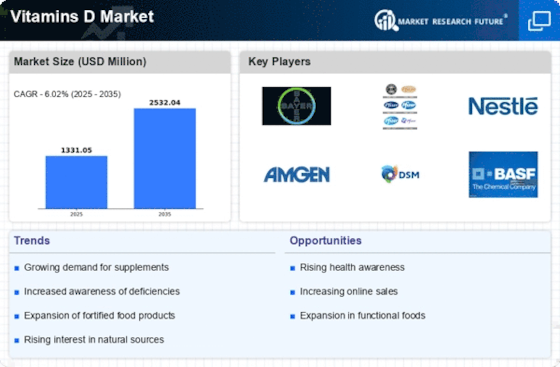
    As per MRFR analysis, the Vitamins D Market Size was estimated at 1331.05 USD Million in 2024. The Vitamins D industry is projected to grow from 1411.18 USD Million in 2025 to 2532.04 USD Million by 2035, exhibiting a compound annual growth rate (CAGR) of 6.02 during the forecast period 2025 - 2035.

    Key Market Trends & Highlights

    The Vitamins D Market is experiencing robust growth driven by health awareness and innovative product offerings.

    • Health awareness is rising, leading to increased demand for Vitamin D products in North America.
    • The Vitamins D3 segment remains the largest, while the Vitamins D2 segment is witnessing rapid growth in Asia-Pacific.
    • Preventive healthcare focus is driving interest in dietary supplements, which dominate the market, alongside the fast-growing dairy alternatives segment.
    • Key market drivers include the increased incidence of Vitamin D deficiency and the expansion of e-commerce platforms.

    Market Size & Forecast

    2024 Market Size 1331.05 (USD Million)
    2035 Market Size 2532.04 (USD Million)
    CAGR (2025 - 2035) 6.02%
    Largest Regional Market Share in 2024 Europe

    Major Players

    <p>Bayer AG (DE), Pfizer Inc (US), Nestle SA (CH), Amgen Inc (US), DSM Nutritional Products (NL), BASF SE (DE), Herbalife Nutrition Ltd (US), GSK plc (GB), Nature's Way Products LLC (US)</p>

    Market Trends

    The Vitamins D Market is currently experiencing a notable transformation, driven by a growing awareness of the health benefits associated with vitamin D. This nutrient is increasingly recognized for its role in supporting bone health, immune function, and overall well-being. As consumers become more health-conscious, the demand for vitamin D supplements is rising, leading to a proliferation of products in various forms, including capsules, gummies, and fortified foods. Additionally, the trend towards preventive healthcare is influencing purchasing behaviors, as individuals seek to enhance their nutritional intake to mitigate potential health issues. Moreover, the Vitamins D Market is witnessing a shift towards natural and organic products. Consumers are showing a preference for supplements derived from natural sources, which aligns with the broader trend of clean label products. This inclination towards transparency in ingredient sourcing is prompting manufacturers to innovate and reformulate their offerings. Furthermore, the increasing prevalence of lifestyle-related health concerns is likely to sustain the momentum of this market, as individuals look for effective ways to support their health through dietary supplementation. Overall, the Vitamins D Market appears poised for continued growth, driven by evolving consumer preferences and a heightened focus on health and wellness.

    Rising Health Awareness

    There is a growing recognition among consumers regarding the importance of vitamin D for overall health. This trend is leading to increased demand for supplements as individuals seek to improve their nutritional intake.

    Preference for Natural Products

    Consumers are increasingly favoring natural and organic vitamin D supplements. This shift reflects a broader trend towards clean label products, where transparency in ingredient sourcing is prioritized.

    Preventive Healthcare Focus

    The Vitamins D Market is benefiting from a heightened emphasis on preventive healthcare. Individuals are actively seeking ways to enhance their health and well-being, which is driving the demand for vitamin D supplementation.

    The growing recognition of Vitamin D's role in immune function and overall health suggests a sustained increase in consumer demand for supplementation, particularly in regions with limited sunlight exposure.

    National Institutes of Health

    Vitamins D Market Market Drivers

    Growing Aging Population

    The demographic shift towards an aging population is poised to influence the Vitamins D Market significantly. Older adults are particularly susceptible to Vitamin D deficiency due to factors such as reduced skin synthesis and dietary intake. This demographic is increasingly aware of the importance of maintaining bone health and preventing age-related diseases, which has led to a surge in the consumption of Vitamin D supplements. Market data suggests that the demand for Vitamin D products among older adults is expected to rise, as they seek to enhance their overall health and well-being. The Vitamins D Market may see a notable increase in product offerings tailored specifically for this age group, reflecting their unique health needs.

    Expansion of E-commerce Platforms

    The expansion of e-commerce platforms is transforming the Vitamins D Market by providing consumers with greater access to a variety of Vitamin D products. Online shopping has become increasingly popular, allowing consumers to conveniently purchase supplements from the comfort of their homes. This trend is particularly relevant in the context of health and wellness, where consumers seek reliable sources for their nutritional needs. Market data suggests that e-commerce sales of dietary supplements, including Vitamin D, have seen substantial growth, indicating a shift in consumer purchasing behavior. As more individuals turn to online platforms for their health products, the Vitamins D Market is likely to experience increased sales and market penetration.

    Innovations in Product Formulations

    Innovations in product formulations are emerging as a key driver for the Vitamins D Market. Manufacturers are increasingly developing new and improved Vitamin D supplements that cater to diverse consumer preferences and needs. This includes the introduction of vegan and plant-based Vitamin D options, appealing to the growing segment of health-conscious consumers who prioritize natural ingredients. Additionally, advancements in delivery methods, such as gummies and liquid forms, are enhancing the appeal of Vitamin D supplements. Market trends indicate that consumers are more likely to choose products that align with their lifestyle and dietary choices. As a result, the Vitamins D Market is expected to witness a surge in innovative products that meet the evolving demands of consumers.

    Increased Incidence of Vitamin D Deficiency

    The rising incidence of Vitamin D deficiency across various populations appears to be a significant driver for the Vitamins D Market. Studies indicate that a substantial portion of the population, particularly in regions with limited sunlight exposure, experiences low levels of Vitamin D. This deficiency is linked to various health issues, including bone disorders and immune dysfunction. Consequently, there is a growing demand for Vitamin D supplements as individuals seek to mitigate these health risks. The Vitamins D Market is likely to benefit from this trend, as healthcare professionals increasingly recommend supplementation to address deficiencies. Furthermore, the market is projected to expand as awareness of the importance of maintaining adequate Vitamin D levels continues to rise.

    Rising Interest in Preventive Health Measures

    The growing interest in preventive health measures is driving the Vitamins D Market forward. Consumers are becoming more proactive about their health, seeking ways to prevent chronic diseases rather than merely treating them. Vitamin D is increasingly recognized for its role in supporting immune function and overall health, leading to a heightened demand for supplements. Market Research Future indicates that consumers are more inclined to invest in preventive health products, including Vitamin D, as part of their daily wellness routines. This trend is likely to propel the Vitamins D Market, as manufacturers respond with innovative formulations and marketing strategies aimed at health-conscious consumers.

    Market Segment Insights

    By Type: Vitamins D3 (Largest) vs. Vitamins D2 (Fastest-Growing)

    <p>In the Vitamins D market, the distribution of share between Vitamins D3 and D2 reveals a clear dominance of Vitamins D3. It accounts for a significant portion of the market share due to its greater efficacy in raising serum levels of vitamin D in the body. This segment has been preferred by consumers and manufacturers alike for its proven benefits in supplementation, which continues to bolster its market position. Conversely, Vitamins D2, while currently a smaller player, is increasingly being recognized for its potential in addressing vitamin D deficiencies, especially among specific demographic groups. Its utilization in fortified foods and supplements marks its rising significance in the market.</p>

    <p>Vitamins D3 (Dominant) vs. Vitamins D2 (Emerging)</p>

    <p>Vitamins D3, known for its high bioavailability, is primarily sourced from animal fats and exposure to sunlight, making it the most favored form in the market. Its efficacy has made it the dominant choice among consumers seeking reliable supplementation. On the other hand, Vitamins D2, often derived from yeast and fungi, represents an emerging alternative that caters to vegan and vegetarian consumers. While it trails behind D3 in market share, the increasing awareness of vitamin D deficiencies and a broader acceptance of D2 in health-conscious markets positions it for rapid growth. As dietary preferences shift and health trends evolve, Vitamins D2 is poised to carve a more substantial niche in the Vitamins D market.</p>

    By Application: Dietary Supplements (Largest) vs. Dairy Alternatives (Fastest-Growing)

    <p>The Vitamins D Market showcases a diverse application segment, with Dietary Supplements commanding the largest share. This sector is increasingly popular due to the rising awareness of the health benefits associated with Vitamin D, particularly in immune support and bone health. Other notable applications include Bakery & Confectionery, Dairy & Frozen Desserts, and Meat Alternatives, although they account for a smaller fraction of market share. These segments provide essential nutrients while catering to various dietary preferences and consumer demands. Growth trends in the Vitamins D application space highlight the accelerating demand for Dairy Alternatives, which is becoming significant due to the rise in veganism and lactose intolerance awareness. Additionally, the Sports Nutrition sector is gaining traction as athletes look for ways to enhance performance and recovery through adequate nutrient intake. The health and wellness trend continues to fuel innovations across all applications, driving revenue growth in this market.</p>

    <p>Bakery & Confectionery (Dominant) vs. Sports Nutrition (Emerging)</p>

    <p>The Bakery & Confectionery segment within the Vitamins D Market maintains a dominant stance, favored for its ability to enrich products like breads, pastries, and snack items with vital nutrients. This segment has successfully integrated Vitamin D into conventional products, leveraging consumer demand for fortified foods that cater to health-conscious audiences. Meanwhile, the Sports Nutrition segment is emerging, driven by the increasing number of fitness enthusiasts and athletes focusing on nutrient density for optimal performance. Both segments are characterized by their innovative product development, with bakery items and sports supplements increasingly incorporating Vitamins D to meet active lifestyles and dietary requirements. As consumer awareness of nutritional benefits grows, both segments are poised to adapt and evolve dynamically.</p>

    Get more detailed insights about Vitamins D Market Research Report—Global Forecast till 2032

    Regional Insights

    North America : Health-Conscious Market Leader

    North America is the largest market for Vitamin D, accounting for approximately 40% of global consumption. The region's growth is driven by increasing awareness of health benefits, rising incidences of Vitamin D deficiency, and supportive regulatory frameworks. The demand for fortified foods and dietary supplements is on the rise, fueled by health-conscious consumers and a growing aging population seeking preventive healthcare solutions. The United States and Canada are the leading countries in this market, with major players like Pfizer Inc and Herbalife Nutrition Ltd dominating the landscape. The competitive environment is characterized by innovation in product formulations and marketing strategies aimed at health benefits. The presence of established companies ensures a robust supply chain and distribution network, further enhancing market growth.

    Europe : Regulatory-Driven Market Growth

    Europe is the second-largest market for Vitamin D, holding around 30% of the global share. The region's growth is propelled by stringent regulations promoting health supplements and increasing public health initiatives aimed at combating Vitamin D deficiency. Countries like Germany and the UK are at the forefront, with rising consumer awareness driving demand for fortified products and supplements, particularly among vulnerable populations. Germany, the UK, and France are key players in this market, with a competitive landscape featuring companies like Bayer AG and DSM Nutritional Products. The presence of regulatory bodies ensures product safety and efficacy, fostering consumer trust. The market is characterized by a mix of local and international players, leading to a diverse range of products catering to various consumer needs.

    Asia-Pacific : Rapidly Growing Health Sector

    Asia-Pacific is witnessing significant growth in the Vitamin D market, driven by increasing health awareness and rising disposable incomes. The region holds approximately 20% of the global market share, with countries like China and India leading the charge. The demand for dietary supplements is surging, particularly among urban populations, as consumers become more health-conscious and seek preventive healthcare solutions. China and India are the largest markets in this region, with a competitive landscape featuring both local and international players. Companies like Amgen Inc and BASF SE are expanding their presence, focusing on innovative product offerings. The market is characterized by a growing trend towards natural and organic supplements, catering to the evolving preferences of health-conscious consumers.

    Middle East and Africa : Emerging Market Potential

    The Middle East and Africa region is emerging as a potential market for Vitamin D, accounting for about 10% of the global share. The growth is driven by increasing awareness of health issues related to Vitamin D deficiency, particularly in countries with limited sunlight exposure. Public health campaigns and government initiatives are catalyzing demand for supplements and fortified foods, especially among at-risk populations. Countries like South Africa and the UAE are leading the market, with a competitive landscape that includes both local and international players. Companies such as GSK plc and Nature's Way Products LLC are focusing on expanding their product lines to meet the growing demand. The region's unique demographic trends and health challenges present significant opportunities for market growth and innovation.

    Key Players and Competitive Insights

    The Vitamins D Market is currently characterized by a dynamic competitive landscape, driven by increasing consumer awareness regarding health and wellness, alongside a growing demand for dietary supplements. Key players such as Bayer AG (DE), Pfizer Inc (US), and Nestle SA (CH) are strategically positioning themselves through innovation and regional expansion. Bayer AG (DE) has focused on enhancing its product portfolio with a range of vitamin D supplements tailored for specific demographics, while Pfizer Inc (US) emphasizes research and development to create advanced formulations. Nestle SA (CH) is leveraging its extensive distribution network to penetrate emerging markets, thereby shaping a competitive environment that is increasingly focused on consumer-centric solutions.

    In terms of business tactics, companies are localizing manufacturing to reduce costs and optimize supply chains, which appears to be a response to the growing demand for faster delivery and customization. The market structure is moderately fragmented, with several players vying for market share, yet the collective influence of major companies is significant. This competitive structure fosters innovation and encourages companies to differentiate their offerings, thereby enhancing overall market growth.

    In August 2025, Amgen Inc (US) announced a strategic partnership with a leading health technology firm to develop a digital platform aimed at monitoring vitamin D levels in consumers. This initiative not only underscores Amgen's commitment to innovation but also positions the company at the forefront of personalized health solutions, potentially enhancing customer engagement and loyalty. The integration of technology into health management is likely to redefine consumer interactions with vitamin D products.

    In September 2025, DSM Nutritional Products (NL) launched a new line of vegan vitamin D supplements, catering to the rising demand for plant-based products. This move reflects DSM's strategic focus on sustainability and aligns with current consumer trends favoring environmentally friendly options. By diversifying its product range, DSM is not only addressing market needs but also reinforcing its brand as a leader in sustainable nutrition.

    In October 2025, Herbalife Nutrition Ltd (US) unveiled a comprehensive marketing campaign aimed at educating consumers about the benefits of vitamin D, particularly in relation to immune health. This campaign is indicative of Herbalife's strategy to enhance brand visibility and consumer trust, which may lead to increased market penetration. By prioritizing education, Herbalife is likely to foster a more informed consumer base, thereby driving sales growth.

    As of October 2025, current competitive trends in the Vitamins D Market are increasingly defined by digitalization, sustainability, and the integration of artificial intelligence. Strategic alliances among companies are shaping the landscape, facilitating knowledge sharing and resource optimization. Looking ahead, competitive differentiation is expected to evolve from traditional price-based competition to a focus on innovation, technological advancements, and supply chain reliability. This shift suggests that companies that prioritize these aspects will likely gain a competitive edge in the ever-evolving market.

    Key Companies in the Vitamins D Market market include

    Industry Developments

    March 2021: koninklijke dsm n.v launched ampli-D, a vitamin D under the brand name FORTARO for dietary supplements in Australia. This product launch extended company's nutrition portfolio.

    December 2021: Prinova acquired Lakeshore Technologies, contract manufacturer experts in powder micronizing, blending, and repacking. This acquisition helped Prinova to build a more sustainable operation.

    January 2021: The Kellogg company expanded its raisin bran line portfolio with raisin bran toasted oats and honey.

    May 2021: The Kellogg company collaborated with McKee Foods' Little Debbie brand to launch new cosmic brownies cereal. This launch expanded its portfolio.

    Future Outlook

    Vitamins D Market Future Outlook

    <p>The Vitamins D Market is projected to grow at a 6.02% CAGR from 2024 to 2035, driven by increasing health awareness, dietary supplementation trends, and regulatory support.</p>

    New opportunities lie in:

    • <p>Development of personalized vitamin D supplements based on genetic testing.</p>
    • <p>Expansion into emerging markets with tailored marketing strategies.</p>
    • <p>Integration of vitamin D into functional foods and beverages for broader consumer appeal.</p>

    <p>By 2035, the Vitamins D Market is expected to achieve substantial growth, reflecting evolving consumer preferences and innovative product offerings.</p>

    Market Segmentation

    Vitamins D Market Type Outlook

    • Vitamins D3
    • Vitamins D2

    Vitamins D Market Application Outlook

    • Bakery & Confectionery
    • Dairy & Frozen Desserts
    • Meat Alternatives
    • Oils & Fats
    • Sports Nutrition
    • Dairy Alternatives
    • Dietary Supplements
    • Breakfast Cereals
    • Others

    Report Scope

    MARKET SIZE 20241331.05(USD Million)
    MARKET SIZE 20251411.18(USD Million)
    MARKET SIZE 20352532.04(USD Million)
    COMPOUND ANNUAL GROWTH RATE (CAGR)6.02% (2024 - 2035)
    REPORT COVERAGERevenue Forecast, Competitive Landscape, Growth Factors, and Trends
    BASE YEAR2024
    Market Forecast Period2025 - 2035
    Historical Data2019 - 2024
    Market Forecast UnitsUSD Million
    Key Companies ProfiledMarket analysis in progress
    Segments CoveredMarket segmentation analysis in progress
    Key Market OpportunitiesGrowing consumer awareness of health benefits drives demand for innovative Vitamins D formulations and delivery methods.
    Key Market DynamicsRising consumer awareness of health benefits drives demand for Vitamin D supplements, influencing market dynamics and competition.
    Countries CoveredNorth America, Europe, APAC, South America, MEA

    Market Highlights

    Author

    Pradeep Nandi
    Senior Research Analyst

    She holds an experience of about 6+ years in market research and business consulting, working under the spectrum of information communication technology, telecommunications and semiconductor domains. aarti conceptualizes and implements a scalable business strategy and provides strategic leadership to the clients. her expertise lies in market estimation, competitive intelligence, pipeline analysis, customer assessment, etc.

    Leave a Comment

    Latest Comments

    John Doe
    john@example.com

    This is a great article! Really helped me understand the topic better.

    Posted on July 23, 2025, 10:15 AM
    Jane Smith
    jane@domain.com

    Thanks for sharing this. I’ve bookmarked it for later reference.

    Posted on July 22, 2025, 7:45 PM

    FAQs

    What is the current valuation of the Vitamins D Market as of 2024?

    The Vitamins D Market was valued at 1331.05 USD Million in 2024.

    What is the projected market valuation for the Vitamins D Market in 2035?

    The projected valuation for the Vitamins D Market in 2035 is 2532.04 USD Million.

    What is the expected CAGR for the Vitamins D Market during the forecast period 2025 - 2035?

    The expected CAGR for the Vitamins D Market during the forecast period 2025 - 2035 is 6.02%.

    Which companies are considered key players in the Vitamins D Market?

    Key players in the Vitamins D Market include Bayer AG, Pfizer Inc, Nestle SA, Amgen Inc, and DSM Nutritional Products.

    What are the main types of Vitamins D available in the market?

    The main types of Vitamins D available in the market are Vitamins D3 and D2, with D3 valued at 800.0 to 1500.0 USD Million and D2 at 531.05 to 1032.04 USD Million.

    What applications are driving the demand for Vitamins D?

    Applications driving demand for Vitamins D include Dietary Supplements, Dairy & Frozen Desserts, and Sports Nutrition, with Dietary Supplements valued at 532.99 to 1010.0 USD Million.

    How does the performance of the Dairy Alternatives segment compare to others?

    The Dairy Alternatives segment is projected to perform similarly to Dairy & Frozen Desserts, both valued between 199.66 and 380.0 USD Million.

    1. SUPPLEMENTS MARKET, BY TYPE 20
      1. \r\n1.2 GLOBAL
    2. VITAMIN & MINERAL SUPPLEMENTS MARKET, BY FORM 21
      1. \r\n1.3
    3. GLOBAL VITAMIN & MINERAL SUPPLEMENTS MARKET, BY END-USER 22
    4. \r\n1.4 GLOBAL VITAMIN & MINERAL SUPPLEMENTS MARKET, BY APPLICATION
      1. 23
      2. \r\n1.5 GLOBAL VITAMIN & MINERAL SUPPLEMENTS
    5. MARKET, BY DISTRIBUTION CHANNEL 24
      1. \r\n1.6 GLOBAL
    6. VITAMIN & MINERAL SUPPLEMENTS MARKET, BY REGION 25
      1. \r\n2
      2. MARKET INTRODUCTION 26
      3. \r\n2.1 DEFINITION 26
      4. \r\n2.2 SCOPE OF THE STUDY 26
      5. \r\n2.3
      6. RESEARCH OBJECTIVE 26
      7. \r\n2.4 MARKET STRUCTURE 27
      8. \r\n3 RESEARCH METHODOLOGY 28
      9. \r\n3.1
      10. RESEARCH PROCESS 28
      11. \r\n3.2 PRIMARY RESEARCH 29
      12. \r\n3.3 SECONDARY RESEARCH 30
      13. \r\n3.4
      14. MARKET SIZE ESTIMATION 31
      15. \r\n3.5 FORECAST
      16. MODEL 32
      17. \r\n3.6 LIST OF ASSUMPTIONS &
      18. LIMITATIONS 33
      19. \r\n4 MARKET DYNAMICS 34
      20. \r\n4.1 INTRODUCTION 34
      21. \r\n4.2 DRIVERS
      22. 35
      23. \r\n4.2.1 GROWING DEMAND FOR IMMUNITY-BOOSTING
      24. PRODUCTS 35
      25. \r\n4.2.2 US GYM MEMBERSHIP BY GENERATION,
      26. \r\n4.2.3 INCREASING HEALTHCARE COSTS
      27. 36
      28. \r\n4.2.4 DRIVERS IMPACT ANALYSIS 37
      29. \r\n4.3 RESTRAINT 37
      30. \r\n4.3.1 RISE
      31. OF COUNTERFEIT AND FAKE PRODUCTS SUPPLY 37
      32. \r\n4.3.2
      33. RESTRAINT IMPACT ANALYSIS 38
      34. \r\n4.4 OPPORTUNITIES
      35. 38
      36. \r\n4.4.1 STRONG GROWTH OF THE GERIATRIC
      37. POPULATION 38
      38. \r\n4.4.2 GROWTH OF E-COMMERCE SALES
      39. IN THE DIETARY SUPPLEMENTS INDUSTRY 39
      40. \r\n4.5 CHALLENGES
      41. 40
      42. \r\n4.5.1 VARYING GOVERNMENT REGULATIONS
      43. RELATED TO LABELING AND CLAIMS 40
      44. \r\n5 MARKET
      45. FACTOR ANALYSIS 41
      46. \r\n5.1 VALUE CHAIN ANALYSIS 41
      47. \r\n5.1.1 RAW MATERIAL PROCUREMENT 42
      48. \r\n5.1.2
      49. PROCESSING 42
      50. \r\n5.1.3 PACKING 42
      51. \r\n5.2 SUPPLY CHAIN ANALYSIS 43
      52. \r\n5.2.1
      53. RAW MATERIAL SOURCING 44
      54. \r\n5.2.2 MANUFACTURING 44
      55. \r\n5.2.3 DISTRIBUTION 44
      56. \r\n5.2.4
      57. END-USER 44
      58. \r\n5.3 PORTER'S FIVE FORCES MODEL
      59. 45
      60. \r\n5.3.1 THREAT OF NEW ENTRANTS 45
      61. \r\n5.3.2 BARGAINING POWER OF SUPPLIERS 46
      62. \r\n5.3.3
      63. THREAT OF SUBSTITUTES 46
      64. \r\n5.3.4 BARGAINING POWER OF BUYERS
      65. 46
      66. \r\n5.3.5 INTENSITY OF RIVALRY 46
      67. \r\n5.4 IMPACT OF COVID-19 ON THE GLOBAL VITAMIN AND MINERAL SUPPLEMENTS
      68. MARKET 47
      69. \r\n5.4.1 IMPACT ON RAW MATERIAL
      70. AVAILABILITY & PRODUCTION 47
      71. \r\n5.4.2 IMPACT
      72. ON CONSUMER BUYING BEHAVIOUR 48
      73. \r\n5.4.3 IMPACT
      74. ON ONLINE VS STORE-BASED SALES 48
      75. \r\n5.4.4 IMPACT
      76. ON PRICING 48
      77. \r\n6 GLOBAL VITAMIN & MINERAL
    7. SUPPLEMENTS MARKET, BY TYPE 49
      1. \r\n6.1 OVERVIEW
      2. 49
      3. \r\n6.1.1 GLOBAL VITAMIN & MINERAL SUPPLEMENTS
    8. MARKET ESTIMATES & FORECAST, BY TYPE, 2024–2032 50
      1. \r\n6.2
      2. VITAMINS 51
      3. \r\n6.2.1 VITAMINS: MARKET ESTIMATES
      4. & FORECAST, BY REGION, 2024–2032 52
      5. \r\n6.3
      6. MINERALS 52
      7. \r\n6.3.1 MINERALS: MARKET ESTIMATES
      8. & FORECAST, BY REGION, 2024–2032 53
      9. \r\n7
    9. GLOBAL VITAMIN & MINERAL SUPPLEMENTS MARKET, BY FORM 54
      1. \r\n7.1
      2. OVERVIEW 54
      3. \r\n7.1.1 GLOBAL VITAMIN & MINERAL
    10. SUPPLEMENTS MARKET ESTIMATES & FORECAST, BY FORM, 2024–2032 55
      1. \r\n7.2 POWDER 55
      2. \r\n7.2.1 POWDER:
    11. MARKET ESTIMATES & FORECAST, BY REGION, 2024–2032 55
      1. \r\n7.3 CAPSULE & TABLETS 56
      2. \r\n7.3.1
    12. CAPSULE & TABLETS: MARKET ESTIMATES & FORECAST, BY REGION, 2024–2032
      1. 56
      2. \r\n7.4 LIQUID 57
      3. \r\n7.4.1
    13. LIQUID: MARKET ESTIMATES & FORECAST, BY REGION, 2024–2032 57
      1. \r\n7.5 OTHERS 58
      2. \r\n7.5.1 OTHERS:
    14. MARKET ESTIMATES & FORECAST, BY REGION, 2024–2032 58
    15. \r\n8 GLOBAL VITAMIN & MINERAL SUPPLEMENTS MARKET, BY END USER
      1. 59
      2. \r\n8.1 OVERVIEW 59
      3. \r\n8.1.1
    16. GLOBAL VITAMIN & MINERAL SUPPLEMENTS MARKET ESTIMATES & FORECAST, BY END
      1. USER, 2024–2032 60
      2. \r\n8.2 MEN 60
      3. \r\n8.2.1
    17. MEN: MARKET ESTIMATES & FORECAST, BY REGION, 2024–2032 60
      1. \r\n8.3 WOMEN 61
      2. \r\n8.3.1 WOMEN:
    18. MARKET ESTIMATES & FORECAST, BY REGION, 2024–2032 61
      1. \r\n8.4 UNISEX 62
      2. \r\n8.4.1 UNISEX:
    19. MARKET ESTIMATES & FORECAST, BY REGION, 2024–2032 62
    20. \r\n9 GLOBAL VITAMIN & MINERAL SUPPLEMENTS MARKET, BY APPLICATION
      1. 63
      2. \r\n9.1 OVERVIEW 63
      3. \r\n9.1.1
    21. GLOBAL VITAMIN & MINERAL SUPPLEMENTS MARKET ESTIMATES & FORECAST, BY APPLICATION,
      1. \r\n9.2 ENERGY/SPORTS NUTRITION 65
      2. \r\n9.2.1 ENERGY/ SPORTS NUTRITION: MARKET ESTIMATES & FORECAST,
      3. BY REGION, 2024–2032 65
      4. \r\n9.3 WEIGHT
      5. MANAGEMENT 66
      6. \r\n9.3.1 WEIGHT MANAGEMENT: MARKET
      7. ESTIMATES & FORECAST, BY REGION, 2024–2032 66
      8. \r\n9.4
      9. IMMUNITY AND DIGESTIVE HEALTH 67
      10. \r\n9.4.1 IMMUNITY
    22. AND DIGESTIVE HEALTH: MARKET ESTIMATES & FORECAST, BY REGION, 2024–2032
      1. 67
      2. \r\n9.5 ANTI-CANCER 68
    23. \r\n9.5.1 ANTI-CANCER: MARKET ESTIMATES & FORECAST, BY REGION,
      1. \r\n9.6 SKIN CARE 69
    24. \r\n9.6.1 SKIN CARE: MARKET ESTIMATES & FORECAST, BY REGION,
      1. \r\n9.7 GLYCEMIC & DIABETES MANAGEMENT
      2. 70
      3. \r\n9.7.1 GLYCEMIC & DIABETES MANAGEMENT:
    25. MARKET ESTIMATES & FORECAST, BY REGION, 2024–2032 70
      1. \r\n9.8 OTHER 71
      2. \r\n9.8.1 OTHER:
    26. MARKET ESTIMATES & FORECAST, BY REGION, 2024–2032 71
    27. \r\n10 GLOBAL VITAMIN & MINERAL SUPPLEMENTS MARKET, BY DISTRIBUTION
      1. CHANNEL 72
      2. \r\n10.1 OVERVIEW 72
      3. \r\n10.1.1 GLOBAL VITAMIN & MINERAL SUPPLEMENTS MARKET ESTIMATES
      4. & FORECAST, BY DISTRIBUTION CHANNEL, 2024–2032 73
      5. \r\n10.2
      6. SUPERMARKET & HYPERMARKET 74
      7. \r\n10.2.1 SUPERMARKET
    28. & HYPERMARKET: MARKET ESTIMATES & FORECAST, BY REGION, 2024–2032 74
      1. \r\n10.3 CHEMIST/PHARMACIES 75
      2. \r\n10.3.1
    29. CHEMIST/PHARMACIES: MARKET ESTIMATES & FORECAST, BY REGION, 2024–2032
      1. 75
      2. \r\n10.4 DRUGSTORES/PARAPHARAMCIES 76
      3. \r\n10.4.1 DRUGSTORES/PARAPHARAMCIES: MARKET ESTIMATES & FORECAST,
      4. BY REGION, 2024–2032 76
      5. \r\n10.5 ONLINE
      6. 77
      7. \r\n10.5.1 ONLINE: MARKET ESTIMATES &
      8. FORECAST, BY REGION, 2024–2032 77
      9. \r\n10.6 OTHERS
      10. 78
      11. \r\n10.6.1 OTHERS: MARKET ESTIMATES &
      12. FORECAST, BY REGION, 2024–2032 78
      13. \r\n11 GLOBAL
    30. VITAMIN & MINERAL SUPPLEMENT MARKET, BY REGION 79
      1. \r\n11.1
      2. OVERVIEW 79
      3. \r\n11.2 NORTH AMERICA 81
      4. \r\n11.2.1 US 84
      5. \r\n11.2.2 CANADA
      6. 86
      7. \r\n11.2.3 MEXICO 88
      8. \r\n11.3
      9. EUROPE 90
      10. \r\n11.3.1 GERMANY 93
      11. \r\n11.3.2 UK 95
      12. \r\n11.3.3 FRANCE
      13. 97
      14. \r\n11.3.4 SPAIN 99
      15. \r\n11.3.5
      16. ITALY 101
      17. \r\n11.3.6 REST OF EUROPE 103
      18. \r\n11.4 ASIA-PACIFIC 106
      19. \r\n11.4.1
      20. CHINA 109
      21. \r\n11.4.2 JAPAN 111
      22. \r\n11.4.3 INDIA 113
      23. \r\n11.4.4 AUSTRALIA
      24. & NEW ZEALAND 115
      25. \r\n11.4.5 REST OF ASIA-PACIFIC 117
      26. \r\n11.5 REST OF THE WORLD 119
      27. \r\n11.5.1
      28. SOUTH AMERICA 122
      29. \r\n11.5.2 MIDDLE EAST 124
      30. \r\n11.5.3 AFRICA 126
      31. \r\n12 COMPETITIVE
      32. LANDSCAPE 128
      33. \r\n12.1 INTRODUCTION 128
      34. \r\n12.2 MARKET STRATEGY ANALYSIS 128
      35. \r\n12.3
      36. COMPETITIVE BENCHMARKING 129
      37. \r\n12.4 KEY
      38. DEVELOPMENTS & GROWTH STRATEGIES 131
      39. \r\n12.4.1 PRODUCT
      40. LAUNCH 131
      41. \r\n12.4.2 EXPANSION 132
      42. \r\n12.4.3 ACQUISITION 133
      43. \r\n12.4.4
      44. JOINT VENTURE 133
      45. \r\n13 COMPANY PROFILES 134
      46. \r\n13.1 BAYER AG 134
      47. \r\n13.1.1 COMPANY
      48. OVERVIEW 134
      49. \r\n13.1.2 FINANCIAL OVERVIEW 135
      50. \r\n13.1.3 PRODUCTS OFFERED 135
      51. \r\n13.1.4
      52. KEY DEVELOPMENTS 136
      53. \r\n13.1.5 SWOT ANALYSIS 136
      54. \r\n13.1.6 KEY STRATEGIES 137
      55. \r\n13.2
      56. GLANBIA PLC 138
      57. \r\n13.2.1 COMPANY OVERVIEW 138
      58. \r\n13.2.2 FINANCIAL OVERVIEW 139
      59. \r\n13.2.3
      60. PRODUCTS OFFERED 140
      61. \r\n13.2.4 KEY DEVELOPMENTS 140
      62. \r\n13.2.5 SWOT ANALYSIS 141
      63. \r\n13.2.6
      64. KEY STRATEGIES 141
      65. \r\n13.3 ABBOTT 142
      66. \r\n13.3.1 COMPANY OVERVIEW 142
      67. \r\n13.3.2
      68. FINANCIAL OVERVIEW 143
      69. \r\n13.3.3 PRODUCTS OFFERED 143
      70. \r\n13.3.4 KEY DEVELOPMENTS 144
      71. \r\n13.3.5
      72. SWOT ANALYSIS 145
      73. \r\n13.3.6 KEY STRATEGIES 145
      74. \r\n13.4 PFIZER INC. 146
      75. \r\n13.4.1 COMPANY
      76. OVERVIEW 146
      77. \r\n13.4.2 FINANCIAL OVERVIEW 146
      78. \r\n13.4.3 PRODUCTS OFFERED 147
      79. \r\n13.4.4
      80. KEY DEVELOPMENTS 147
      81. \r\n13.4.5 SWOT ANALYSIS 148
      82. \r\n13.4.6 KEY STRATEGIES 148
      83. \r\n13.5
      84. AMWAY CORP. 149
      85. \r\n13.5.1 COMPANY OVERVIEW 149
      86. \r\n13.5.2 FINANCIAL OVERVIEW 149
      87. \r\n13.5.3
      88. PRODUCTS OFFERED 150
      89. \r\n13.5.4 KEY DEVELOPMENTS 150
      90. \r\n13.5.5 SWOT ANALYSIS 151
      91. \r\n13.5.6
      92. KEY STRATEGIES 151
      93. \r\n13.6 GSK PLC. 152
      94. \r\n13.6.1 COMPANY OVERVIEW 152
      95. \r\n13.6.2
      96. FINANCIAL OVERVIEW 153
      97. \r\n13.6.3 PRODUCTS OFFERED 153
      98. \r\n13.6.4 KEY DEVELOPMENTS 154
      99. \r\n13.6.5
      100. KEY STRATEGIES 154
      101. \r\n13.7 HERBALIFE INTERNATIONAL
      102. OF AMERICA, INC. 155
      103. \r\n13.7.1 COMPANY OVERVIEW 155
      104. \r\n13.7.2 FINANCIAL OVERVIEW 156
      105. \r\n13.7.3
      106. PRODUCTS OFFERED 156
      107. \r\n13.7.4 KEY DEVELOPMENTS 157
      108. \r\n13.7.5 KEY STRATEGIES 157
      109. \r\n13.8
      110. OTSUKA PHARMACEUTICAL CO., LTD. 158
      111. \r\n13.8.1 COMPANY
      112. OVERVIEW 158
      113. \r\n13.8.2 FINANCIAL OVERVIEW 158
      114. \r\n13.8.3 PRODUCTS OFFERED 159
      115. \r\n13.8.4
      116. KEY DEVELOPMENTS 160
      117. \r\n13.8.5 KEY STRATEGIES 160
      118. \r\n13.9 NATURE'S WAY BRANDS 161
      119. \r\n13.9.1
      120. COMPANY OVERVIEW 161
      121. \r\n13.9.2 FINANCIAL OVERVIEW 161
      122. \r\n13.9.3 PRODUCTS OFFERED 161
      123. \r\n13.9.4
      124. KEY DEVELOPMENTS 162
      125. \r\n13.9.5 KEY STRATEGIES 162
      126. \r\n13.10 NATURE'S BOUNTY 163
      127. \r\n13.10.1
      128. COMPANY OVERVIEW 163
      129. \r\n13.10.2 FINANCIAL OVERVIEW 163
      130. \r\n13.10.3 PRODUCTS OFFERED 163
      131. \r\n13.10.4
      132. KEY DEVELOPMENTS 164
      133. \r\n13.10.5 KEY STRATEGIES 164
      134. \r\n13.11 GLOBAL CALCIUM PVT LTD 165
      135. \r\n13.11.1
      136. COMPANY OVERVIEW 165
      137. \r\n13.11.2 FINANCIAL OVERVIEW 165
      138. \r\n13.11.3 PRODUCTS OFFERED 165
      139. \r\n13.11.4
      140. KEY DEVELOPMENTS 166
      141. \r\n13.11.5 SWOT ANALYSIS 166
      142. \r\n13.11.6 KEY STRATEGIES 166
      143. \r\n13.12
      144. LEHMANN&VOSS&CO. (LEHVOSS) 167
      145. \r\n13.12.1
      146. COMPANY OVERVIEW 167
      147. \r\n13.12.2 FINANCIAL OVERVIEW 167
      148. \r\n13.12.3 PRODUCTS OFFERED 167
      149. \r\n13.12.4
      150. KEY DEVELOPMENTS 168
      151. \r\n13.12.5 SWOT ANALYSIS 169
      152. \r\n13.12.6 KEY STRATEGIES 169
      153. \r\n13.13
      154. ZINPRO CORP. 170
      155. \r\n13.13.1 COMPANY OVERVIEW 170
      156. \r\n13.13.2 FINANCIAL OVERVIEW 170
      157. \r\n13.13.3
      158. PRODUCTS OFFERED 170
      159. \r\n13.13.4 KEY DEVELOPMENTS 171
      160. \r\n13.13.5 SWOT ANALYSIS 171
      161. \r\n13.13.6
      162. KEY STRATEGIES 171
      163. \r\n13.14 NOVOTECH NUTRACEUTICALS,
      164. INC. 172
      165. \r\n13.14.1 COMPANY OVERVIEW 172
      166. \r\n13.14.2 FINANCIAL OVERVIEW 172
      167. \r\n13.14.3
      168. PRODUCTS OFFERED 172
      169. \r\n13.14.4 KEY DEVELOPMENTS 172
      170. \r\n13.14.5 SWOT ANALYSIS 173
      171. \r\n13.14.6
      172. KEY STRATEGIES 173
      173. \r\n13.15 AMERICA ALIMENTOS SA DE
      174. CV 174
      175. \r\n13.15.1 COMPANY OVERVIEW 174
      176. \r\n13.15.2 FINANCIAL OVERVIEW 174
      177. \r\n13.15.3
      178. PRODUCTS OFFERED 174
      179. \r\n13.15.4 KEY DEVELOPMENTS 174
      180. \r\n13.15.5 SWOT ANALYSIS 175
      181. \r\n13.15.6
      182. KEY STRATEGIES 175
      183. \r\n13.16 JOST CHEMICAL CO. 176
      184. \r\n13.16.1 COMPANY OVERVIEW 176
      185. \r\n13.16.2
      186. FINANCIAL OVERVIEW 176
      187. \r\n13.16.3 PRODUCTS OFFERED 176
      188. \r\n13.16.4 KEY DEVELOPMENTS 177
      189. \r\n13.16.5
      190. KEY STRATEGIES 177
      191. \r\n14 APPENDIX 178
      192. \r\n14.1 REFERENCES 178
      193. \r\n14.2 RELATED
      194. REPORTS 178
      195. \r\n 
      196. \r\nLIST
    31. OF TABLES
      1. \r\nTABLE 1 PRIMARY INTERVIEWS 29
      2. \r\nTABLE 2 LIST OF ASSUMPTIONS & LIMITATIONS 33
      3. \r\nTABLE 3 GLOBAL VITAMIN & MINERAL SUPPLEMENTS MARKET ESTIMATES
      4. & FORECAST, BY TYPE, 2024–2032 (USD MILLION) 50
      5. \r\nTABLE
    32. VITAMINS: MARKET ESTIMATES & FORECAST, BY REGION, 2024–2032 (USD MILLION)
      1. 52
      2. \r\nTABLE 5 MINERALS: MARKET ESTIMATES &
      3. FORECAST, BY REGION, 2024–2032 (USD MILLION) 53
      4. \r\nTABLE
    33. GLOBAL VITAMIN & MINERAL SUPPLEMENTS MARKET ESTIMATES & FORECAST, BY FORM,
      1. \r\nTABLE 7
    34. POWDER: MARKET ESTIMATES & FORECAST, BY REGION, 2024–2032 (USD MILLION)
      1. 55
      2. \r\nTABLE 8 CAPSULE & TABLETS: MARKET
      3. ESTIMATES & FORECAST, BY REGION, 2024–2032 (USD MILLION) 56
    35. \r\nTABLE 9 LIQUID: MARKET ESTIMATES & FORECAST, BY REGION,
      1. \r\nTABLE 10
    36. OTHERS: MARKET ESTIMATES & FORECAST, BY REGION, 2024–2032 (USD MILLION)
      1. 58
      2. \r\nTABLE 11 GLOBAL VITAMIN & MINERAL
    37. SUPPLEMENTS MARKET ESTIMATES & FORECAST, BY END USER, 2024–2032 (USD MILLION)
      1. 60
      2. \r\nTABLE 12 MEN: MARKET ESTIMATES &
      3. FORECAST, BY REGION, 2024–2032 (USD MILLION) 60
      4. \r\nTABLE
    38. WOMEN: MARKET ESTIMATES & FORECAST, BY REGION, 2024–2032 (USD MILLION)
      1. 61
      2. \r\nTABLE 14 UNISEX: MARKET ESTIMATES &
      3. FORECAST, BY REGION, 2024–2032 (USD MILLION) 62
      4. \r\nTABLE
    39. GLOBAL VITAMIN & MINERAL SUPPLEMENTS MARKET ESTIMATES & FORECAST, BY
      1. APPLICATION, 2024–2032 (USD MILLION) 64
      2. \r\nTABLE
    40. ENERGY/ SPORTS NUTRITION: MARKET ESTIMATES & FORECAST, BY REGION, 2024–2032
      1. (USD MILLION) 65
      2. \r\nTABLE 17 WEIGHT MANAGEMENT: MARKET
      3. ESTIMATES & FORECAST, BY REGION, 2024–2032 (USD MILLION) 66
      4. \r\nTABLE 18 IMMUNITY AND DIGESTIVE HEALTH: MARKET ESTIMATES &
      5. FORECAST, BY REGION, 2024–2032 (USD MILLION) 67
      6. \r\nTABLE
    41. ANTI-CANCER: MARKET ESTIMATES & FORECAST, BY REGION, 2024–2032 (USD
      1. MILLION) 68
      2. \r\nTABLE 20 SKIN CARE: MARKET ESTIMATES
      3. & FORECAST, BY REGION, 2024–2032 (USD MILLION) 69
      4. \r\nTABLE
    42. GLYCEMIC & DIABETES MANAGEMENT: MARKET ESTIMATES & FORECAST, BY REGION,
      1. \r\nTABLE 22
    43. OTHER: MARKET ESTIMATES & FORECAST, BY REGION, 2024–2032 (USD MILLION)
      1. 71
      2. \r\nTABLE 23 GLOBAL VITAMIN & MINERAL
    44. SUPPLEMENTS MARKET ESTIMATES & FORECAST, BY DISTRIBUTION CHANNEL, 2024–2032
      1. (USD MILLION) 73
      2. \r\nTABLE 24 SUPERMARKET & HYPERMARKET:
    45. MARKET ESTIMATES & FORECAST, BY REGION, 2024–2032 (USD MILLION) 74
      1. \r\nTABLE 25 CHEMIST/PHARMACIES: MARKET ESTIMATES & FORECAST,
      2. BY REGION, 2024–2032 (USD MILLION) 75
      3. \r\nTABLE
    46. DRUGSTORES/PARAPHARAMCIES: MARKET ESTIMATES & FORECAST, BY REGION, 2024–2032
      1. (USD MILLION) 76
      2. \r\nTABLE 27 ONLINE: MARKET ESTIMATES
      3. & FORECAST, BY REGION, 2024–2032 (USD MILLION) 77
      4. \r\nTABLE
    47. OTHERS: MARKET ESTIMATES & FORECAST, BY REGION, 2024–2032 (USD MILLION)
      1. 78
      2. \r\nTABLE 29 GLOBAL VITAMIN & MINERAL
    48. SUPPLEMENT MARKET ESTIMATES & FORECAST, BY REGION, 2024–2032 (USD MILLION)
      1. 80
      2. \r\nTABLE 30 NORTH AMERICA: VITAMIN &
    49. MINERAL SUPPLEMENT MARKET ESTIMATES & FORECAST, BY COUNTRY, 2024–2032
      1. (USD MILLION) 81
      2. \r\nTABLE 31 NORTH AMERICA: VITAMIN
    50. & MINERAL SUPPLEMENT MARKET, BY TYPE, 2024–2032 (USD MILLION) 82
      1. \r\nTABLE 32 NORTH AMERICA: VITAMIN & MINERAL SUPPLEMENT MARKET,
      2. BY FORM, 2024–2032 (USD MILLION) 82
      3. \r\nTABLE 33
    51. NORTH AMERICA: VITAMIN & MINERAL SUPPLEMENT MARKET, BY END USER, 2024–2032
      1. (USD MILLION) 83
      2. \r\nTABLE 34 NORTH AMERICA: VITAMIN
    52. & MINERAL SUPPLEMENT MARKET, BY APPLICATION, 2024–2032 (USD MILLION) 83
      1. \r\nTABLE 35 NORTH AMERICA: VITAMIN & MINERAL SUPPLEMENT MARKET,
      2. BY DISTRIBUTION CHANNEL, 2024–2032 (USD MILLION) 83
      3. \r\nTABLE
    53. US: VITAMIN & MINERAL SUPPLEMENT MARKET, BY TYPE, 2024–2032 (USD MILLION)
      1. 84
      2. \r\nTABLE 37 US: VITAMIN & MINERAL SUPPLEMENT
    54. MARKET, BY FORM, 2024–2032 (USD MILLION) 84
      1. \r\nTABLE
    55. US: VITAMIN & MINERAL SUPPLEMENT MARKET, BY END USER, 2024–2032 (USD
      1. MILLION) 85
      2. \r\nTABLE 39 US: VITAMIN & MINERAL
    56. SUPPLEMENT MARKET, BY APPLICATION, 2024–2032 (USD MILLION) 85
    57. \r\nTABLE 40 US: VITAMIN & MINERAL SUPPLEMENT MARKET, BY DISTRIBUTION
      1. CHANNEL, 2024–2032 (USD MILLION) 85
      2. \r\nTABLE 41
    58. CANADA: VITAMIN & MINERAL SUPPLEMENT MARKET, BY TYPE, 2024–2032 (USD MILLION)
      1. 86
      2. \r\nTABLE 42 CANADA: VITAMIN & MINERAL
    59. SUPPLEMENT MARKET, BY FORM, 2024–2032 (USD MILLION) 86
      1. \r\nTABLE
    60. CANADA: VITAMIN & MINERAL SUPPLEMENT MARKET, BY END USER, 2024–2032
      1. (USD MILLION) 87
      2. \r\nTABLE 44 CANADA: VITAMIN &
    61. MINERAL SUPPLEMENT MARKET, BY APPLICATION, 2024–2032 (USD MILLION) 87
      1. \r\nTABLE 45 CANADA: VITAMIN & MINERAL SUPPLEMENT MARKET, BY
      2. DISTRIBUTION CHANNEL, 2024–2032 (USD MILLION) 87
      3. \r\nTABLE
    62. MEXICO: VITAMIN & MINERAL SUPPLEMENT MARKET, BY TYPE, 2024–2032 (USD
      1. MILLION) 88
      2. \r\nTABLE 47 MEXICO: VITAMIN &
    63. MINERAL SUPPLEMENT MARKET, BY FORM, 2024–2032 (USD MILLION) 88
      1. \r\nTABLE 48 MEXICO: VITAMIN & MINERAL SUPPLEMENT MARKET, BY
      2. END USER, 2024–2032 (USD MILLION) 89
      3. \r\nTABLE
    64. MEXICO: VITAMIN & MINERAL SUPPLEMENT MARKET, BY APPLICATION, 2024–2032
      1. (USD MILLION) 89
      2. \r\nTABLE 50 MEXICO: VITAMIN &
    65. MINERAL SUPPLEMENT MARKET, BY DISTRIBUTION CHANNEL, 2024–2032 (USD MILLION)
      1. 89
      2. \r\nTABLE 51 EUROPE: VITAMIN & MINERAL
    66. SUPPLEMENT MARKET ESTIMATES & FORECAST, BY COUNTRY, 2019–2030 (USD MILLION)
      1. 91
      2. \r\nTABLE 52 EUROPE: VITAMIN & MINERAL
    67. SUPPLEMENT MARKET, BY TYPE, 2024–2032 (USD MILLION) 91
      1. \r\nTABLE
    68. EUROPE: VITAMIN & MINERAL SUPPLEMENT MARKET, BY FORM, 2024–2032 (USD
      1. MILLION) 92
      2. \r\nTABLE 54 EUROPE: VITAMIN &
    69. MINERAL SUPPLEMENT MARKET, BY END USER, 2024–2032 (USD MILLION) 92
      1. \r\nTABLE 55 EUROPE: VITAMIN & MINERAL SUPPLEMENT MARKET, BY
      2. APPLICATION, 2024–2032 (USD MILLION) 92
      3. \r\nTABLE
    70. EUROPE: VITAMIN & MINERAL SUPPLEMENT MARKET, BY DISTRIBUTION CHANNEL, 2024–2032
      1. (USD MILLION) 93
      2. \r\nTABLE 57 GERMANY: VITAMIN &
    71. MINERAL SUPPLEMENT MARKET, BY TYPE, 2024–2032 (USD MILLION) 93
      1. \r\nTABLE 58 GERMANY: VITAMIN & MINERAL SUPPLEMENT MARKET,
      2. BY FORM, 2024–2032 (USD MILLION) 94
      3. \r\nTABLE 59
    72. GERMANY: VITAMIN & MINERAL SUPPLEMENT MARKET, BY END USER, 2024–2032 (USD
      1. MILLION) 94
      2. \r\nTABLE 60 GERMANY: VITAMIN &
    73. MINERAL SUPPLEMENT MARKET, BY APPLICATION, 2024–2032 (USD MILLION) 94
      1. \r\nTABLE 61 GERMANY: VITAMIN & MINERAL SUPPLEMENT MARKET,
      2. BY DISTRIBUTION CHANNEL, 2024–2032 (USD MILLION) 95
      3. \r\nTABLE
    74. UK: VITAMIN & MINERAL SUPPLEMENT MARKET, BY TYPE, 2024–2032 (USD MILLION)
      1. 95
      2. \r\nTABLE 63 UK: VITAMIN & MINERAL SUPPLEMENT
    75. MARKET, BY FORM, 2024–2032 (USD MILLION) 96
      1. \r\nTABLE
    76. UK: VITAMIN & MINERAL SUPPLEMENT MARKET, BY END USER, 2024–2032 (USD
      1. MILLION) 96
      2. \r\nTABLE 65 UK: VITAMIN & MINERAL
    77. SUPPLEMENT MARKET, BY APPLICATION, 2024–2032 (USD MILLION) 96
    78. \r\nTABLE 66 UK: VITAMIN & MINERAL SUPPLEMENT MARKET, BY DISTRIBUTION
      1. CHANNEL, 2024–2032 (USD MILLION) 97
      2. \r\nTABLE 67
    79. FRANCE: VITAMIN & MINERAL SUPPLEMENT MARKET, BY TYPE, 2024–2032 (USD MILLION)
      1. 97
      2. \r\nTABLE 68 FRANCE: VITAMIN & MINERAL
    80. SUPPLEMENT MARKET, BY FORM, 2024–2032 (USD MILLION) 98
      1. \r\nTABLE
    81. FRANCE: VITAMIN & MINERAL SUPPLEMENT MARKET, BY END USER, 2024–2032
      1. (USD MILLION) 98
      2. \r\nTABLE 70 FRANCE: VITAMIN &
    82. MINERAL SUPPLEMENT MARKET, BY APPLICATION, 2024–2032 (USD MILLION) 98
      1. \r\nTABLE 71 FRANCE: VITAMIN & MINERAL SUPPLEMENT MARKET, BY
      2. DISTRIBUTION CHANNEL, 2024–2032 (USD MILLION) 99
      3. \r\nTABLE
    83. SPAIN: VITAMIN & MINERAL SUPPLEMENT MARKET, BY TYPE, 2024–2032 (USD
      1. MILLION) 99
      2. \r\nTABLE 73 SPAIN: VITAMIN &
    84. MINERAL SUPPLEMENT MARKET, BY FROM, 2024–2032 (USD MILLION) 100
      1. \r\nTABLE 74 SPAIN: VITAMIN & MINERAL SUPPLEMENT MARKET, BY
      2. END USER, 2024–2032 (USD MILLION) 100
      3. \r\nTABLE
    85. SPAIN: VITAMIN & MINERAL SUPPLEMENT MARKET, BY APPLICATION, 2024–2032
      1. (USD MILLION) 100
      2. \r\nTABLE 76 SPAIN: VITAMIN &
    86. MINERAL SUPPLEMENT MARKET, BY DISTRIBUTION CHANNEL, 2024–2032 (USD MILLION)
      1. 101
      2. \r\nTABLE 77 ITALY: VITAMIN & MINERAL
    87. SUPPLEMENT MARKET, BY TYPE, 2024–2032 (USD MILLION) 101
      1. \r\nTABLE
    88. ITALY: VITAMIN & MINERAL SUPPLEMENT MARKET, BY FROM, 2024–2032 (USD
      1. MILLION) 102
      2. \r\nTABLE 79 ITALY: VITAMIN &
    89. MINERAL SUPPLEMENT MARKET, BY END USER, 2024–2032 (USD MILLION) 102
      1. \r\nTABLE 80 ITALY: VITAMIN & MINERAL SUPPLEMENT MARKET, BY
      2. APPLICATION, 2024–2032 (USD MILLION) 102
      3. \r\nTABLE
    90. ITALY: VITAMIN & MINERAL SUPPLEMENT MARKET, BY DISTRIBUTION CHANNEL, 2024–2032
      1. (USD MILLION) 103
      2. \r\nTABLE 82 REST OF EUROPE: VITAMIN
    91. & MINERAL SUPPLEMENT MARKET, BY TYPE, 2024–2032 (USD MILLION) 103
      1. \r\nTABLE 83 REST OF EUROPE: VITAMIN & MINERAL SUPPLEMENT MARKET,
      2. BY FORM, 2024–2032 (USD MILLION) 104
      3. \r\nTABLE
    92. REST OF EUROPE: VITAMIN & MINERAL SUPPLEMENT MARKET, BY END USER, 2024–2032
      1. (USD MILLION) 104
      2. \r\nTABLE 85 REST OF EUROPE: VITAMIN
    93. & MINERAL SUPPLEMENT MARKET, BY APPLICATION, 2024–2032 (USD MILLION) 104
      1. \r\nTABLE 86 REST OF EUROPE: VITAMIN & MINERAL SUPPLEMENT MARKET,
      2. BY DISTRIBUTION CHANNEL, 2024–2032 (USD MILLION) 105
      3. \r\nTABLE
    94. ASIA-PACIFIC: VITAMIN & MINERAL SUPPLEMENT MARKET ESTIMATES & FORECAST,
      1. BY COUNTRY, 2019–2030 (USD MILLION) 106
      2. \r\nTABLE
    95. ASIA-PACIFIC: VITAMIN & MINERAL SUPPLEMENT MARKET, BY TYPE, 2024–2032
      1. (USD MILLION) 107
      2. \r\nTABLE 89 ASIA-PACIFIC: VITAMIN
    96. & MINERAL SUPPLEMENT MARKET, BY FROM, 2024–2032 (USD MILLION) 107
      1. \r\nTABLE 90 ASIA PACIFIC: VITAMIN & MINERAL SUPPLEMENT MARKET,
      2. BY END USER, 2024–2032 (USD MILLION) 108
      3. \r\nTABLE
    97. ASIA-PACIFIC: VITAMIN & MINERAL SUPPLEMENT MARKET, BY APPLICATION, 2024–2032
      1. (USD MILLION) 108
      2. \r\nTABLE 92 ASIA-PACIFIC: VITAMIN
    98. & MINERAL SUPPLEMENT MARKET, BY DISTRIBUTION CHANNEL, 2024–2032 (USD MILLION)
      1. 108
      2. \r\nTABLE 93 CHINA: VITAMIN & MINERAL
    99. SUPPLEMENT MARKET, BY TYPE, 2024–2032 (USD MILLION) 109
      1. \r\nTABLE
    100. CHINA: VITAMIN & MINERAL SUPPLEMENT MARKET, BY FROM, 2024–2032 (USD
      1. MILLION) 109
      2. \r\nTABLE 95 CHINA: VITAMIN &
    101. MINERAL SUPPLEMENT MARKET, BY END USER, 2024–2032 (USD MILLION) 110
      1. \r\nTABLE 96 CHINA: VITAMIN & MINERAL SUPPLEMENT MARKET, BY
      2. APPLICATION, 2024–2032 (USD MILLION) 110
      3. \r\nTABLE
    102. CHINA: VITAMIN & MINERAL SUPPLEMENT MARKET, BY DISTRIBUTION CHANNEL, 2024–2032
      1. (USD MILLION) 110
      2. \r\nTABLE 98 JAPAN: VITAMIN &
    103. MINERAL SUPPLEMENT MARKET, BY TYPE, 2024–2032 (USD MILLION) 111
      1. \r\nTABLE 99 JAPAN: VITAMIN & MINERAL SUPPLEMENT MARKET, BY
      2. FROM, 2024–2032 (USD MILLION) 111
      3. \r\nTABLE 100
    104. JAPAN: VITAMIN & MINERAL SUPPLEMENT MARKET, BY END USER, 2024–2032 (USD
      1. MILLION) 112
      2. \r\nTABLE 101 JAPAN: VITAMIN &
    105. MINERAL SUPPLEMENT MARKET, BY APPLICATION, 2024–2032 (USD MILLION) 112
      1. \r\nTABLE 102 JAPAN: VITAMIN & MINERAL SUPPLEMENT MARKET, BY
      2. DISTRIBUTION CHANNEL, 2024–2032 (USD MILLION) 112
      3. \r\nTABLE
    106. INDIA: VITAMIN & MINERAL SUPPLEMENT MARKET, BY TYPE, 2024–2032 (USD
      1. MILLION) 113
      2. \r\nTABLE 104 INDIA: VITAMIN &
    107. MINERAL SUPPLEMENT MARKET, BY FROM, 2024–2032 (USD MILLION) 113
      1. \r\nTABLE 105 INDIA: VITAMIN & MINERAL SUPPLEMENT MARKET, BY
      2. END USER, 2024–2032 (USD MILLION) 114
      3. \r\nTABLE
    108. INDIA: VITAMIN & MINERAL SUPPLEMENT MARKET, BY APPLICATION, 2024–2032
      1. (USD MILLION) 114
      2. \r\nTABLE 107 INDIA: VITAMIN &
    109. MINERAL SUPPLEMENT MARKET, BY DISTRIBUTION CHANNEL, 2024–2032 (USD MILLION)
      1. 114
      2. \r\nTABLE 108 AUSTRALIA & NEW ZEALAND:
    110. VITAMIN & MINERAL SUPPLEMENT MARKET, BY TYPE, 2024–2032 (USD MILLION)
      1. 115
      2. \r\nTABLE 109 AUSTRALIA & NEW ZEALAND:
    111. VITAMIN & MINERAL SUPPLEMENT MARKET, BY FROM, 2024–2032 (USD MILLION)
      1. 115
      2. \r\nTABLE 110 AUSTRALIA & NEW ZEALAND:
    112. VITAMIN & MINERAL SUPPLEMENT MARKET, BY END USER, 2024–2032 (USD MILLION)
      1. 116
      2. \r\nTABLE 111 AUSTRALIA & NEW ZEALAND:
    113. VITAMIN & MINERAL SUPPLEMENT MARKET, BY APPLICATION, 2024–2032 (USD MILLION)
      1. 116
      2. \r\nTABLE 112 AUSTRALIA & NEW ZEALAND:
    114. VITAMIN & MINERAL SUPPLEMENT MARKET, BY DISTRIBUTION CHANNEL, 2024–2032
      1. (USD MILLION) 116
      2. \r\nTABLE 113 REST OF ASIA-PACIFIC:
    115. VITAMIN & MINERAL SUPPLEMENT MARKET, BY TYPE, 2024–2032 (USD MILLION)
      1. 117
      2. \r\nTABLE 114 REST OF ASIA-PACIFIC: VITAMIN
    116. & MINERAL SUPPLEMENT MARKET, BY FROM, 2024–2032 (USD MILLION) 117
      1. \r\nTABLE 115 REST OF ASIA-PACIFIC: VITAMIN & MINERAL SUPPLEMENT
    117. MARKET, BY END USER, 2024–2032 (USD MILLION) 118
      1. \r\nTABLE
    118. REST OF ASIA-PACIFIC: VITAMIN & MINERAL SUPPLEMENT MARKET, BY APPLICATION,
      1. \r\nTABLE 117
    119. REST OF ASIA-PACIFIC: VITAMIN & MINERAL SUPPLEMENT MARKET, BY DISTRIBUTION CHANNEL,
      1. \r\nTABLE 118
      2. REST OF THE WORLD: VITAMIN & MINERAL SUPPLEMENT MARKET ESTIMATES & FORECAST,
      3. BY REGION, 2019–2030 (USD MILLION) 119
      4. \r\nTABLE
    120. REST OF THE WORLD: VITAMIN & MINERAL SUPPLEMENT MARKET, BY TYPE, 2024–2032
      1. (USD MILLION) 120
      2. \r\nTABLE 120 REST OF THE WORLD:
    121. VITAMIN & MINERAL SUPPLEMENT MARKET, BY FROM, 2024–2032 (USD MILLION)
      1. 120
      2. \r\nTABLE 121 REST OF THE WORLD: VITAMIN
    122. & MINERAL SUPPLEMENT MARKET, BY END USER, 2024–2032 (USD MILLION) 121
      1. \r\nTABLE 122 REST OF THE WORLD: VITAMIN & MINERAL SUPPLEMENT
    123. MARKET, BY APPLICATION, 2024–2032 (USD MILLION) 121
      1. \r\nTABLE
    124. REST OF THE WORLD: VITAMIN & MINERAL SUPPLEMENT MARKET, BY DISTRIBUTION
      1. CHANNEL, 2024–2032 (USD MILLION) 121
      2. \r\nTABLE
    125. SOUTH AMERICA: VITAMIN & MINERAL SUPPLEMENT MARKET, BY TYPE, 2024–2032
      1. (USD MILLION) 122
      2. \r\nTABLE 125 SOUTH AMERICA: VITAMIN
    126. & MINERAL SUPPLEMENT MARKET, BY FORM, 2024–2032 (USD MILLION) 122
      1. \r\nTABLE 126 SOUTH AMERICA: VITAMIN & MINERAL SUPPLEMENT MARKET,
      2. BY END USER, 2024–2032 (USD MILLION) 123
      3. \r\nTABLE
    127. SOUTH AMERICA: VITAMIN & MINERAL SUPPLEMENT MARKET, BY APPLICATION, 2024–2032
      1. (USD MILLION) 123
      2. \r\nTABLE 128 SOUTH AMERICA: VITAMIN
    128. & MINERAL SUPPLEMENT MARKET, BY DISTRIBUTION CHANNEL, 2024–2032 (USD MILLION)
      1. 123
      2. \r\nTABLE 129 MIDDLE EAST: VITAMIN &
    129. MINERAL SUPPLEMENT MARKET, BY TYPE, 2024–2032 (USD MILLION) 124
      1. \r\nTABLE 130 MIDDLE EAST: VITAMIN & MINERAL SUPPLEMENT MARKET,
      2. BY FROM, 2024–2032 (USD MILLION) 124
      3. \r\nTABLE
    130. MIDDLE EAST: VITAMIN & MINERAL SUPPLEMENT MARKET, BY END USER, 2024–2032
      1. (USD MILLION) 125
      2. \r\nTABLE 132 MIDDLE EAST: VITAMIN
    131. & MINERAL SUPPLEMENT MARKET, BY APPLICATION, 2024–2032 (USD MILLION) 125
      1. \r\nTABLE 133 MIDDLE EAST: VITAMIN & MINERAL SUPPLEMENT MARKET,
      2. BY DISTRIBUTION CHANNEL, 2024–2032 (USD MILLION) 125
      3. \r\nTABLE
    132. AFRICA: VITAMIN & MINERAL SUPPLEMENT MARKET, BY TYPE, 2024–2032 (USD
      1. MILLION) 126
      2. \r\nTABLE 135 AFRICA: VITAMIN &
    133. MINERAL SUPPLEMENT MARKET, BY FORM, 2024–2032 (USD MILLION) 126
      1. \r\nTABLE 136 AFRICA: VITAMIN & MINERAL SUPPLEMENT MARKET,
      2. BY END USER, 2024–2032 (USD MILLION) 127
      3. \r\nTABLE
    134. AFRICA: VITAMIN & MINERAL SUPPLEMENT MARKET, BY APPLICATION, 2024–2032
      1. (USD MILLION) 127
      2. \r\nTABLE 138 AFRICA: VITAMIN &
    135. MINERAL SUPPLEMENT MARKET, BY DISTRIBUTION CHANNEL, 2024–2032 (USD MILLION)
      1. 127
      2. \r\nTABLE 139 PRODUCT LAUNCH 131
      3. \r\nTABLE 140 EXPANSION 132
      4. \r\nTABLE
    136. ACQUISITION 133
      1. \r\nTABLE 142 JOINT VENTURE 133
      2. \r\nTABLE 143 BAYER AG: PRODUCTS OFFERED 135
      3. \r\nTABLE
    137. BAYER AG: KEY DEVELOPMENTS 136
      1. \r\nTABLE 145
      2. GLANBIA PLC: PRODUCTS OFFERED 140
      3. \r\nTABLE 146
      4. GLANBIA PLC: KEY DEVELOPMENTS 140
      5. \r\nTABLE 147
      6. ABBOTT: PRODUCTS OFFERED 143
      7. \r\nTABLE 148
      8. ABBOTT: KEY DEVELOPMENTS 144
      9. \r\nTABLE 149
      10. PFIZER INC.: PRODUCTS OFFERED 147
      11. \r\nTABLE 150
      12. PFIZER INC.: KEY DEVELOPMENTS 147
      13. \r\nTABLE 151
      14. AMWAY CORP.: PRODUCTS OFFERED 150
      15. \r\nTABLE 152
      16. AMWAY CORP.: KEY DEVELOPMENTS 150
      17. \r\nTABLE 153
      18. GSK PLC.: PRODUCTS OFFERED 153
      19. \r\nTABLE 154
      20. GSK PLC.: KEY DEVELOPMENTS 154
      21. \r\nTABLE 155
      22. HERBALIFE INTERNATIONAL OF AMERICA, INC.: PRODUCTS OFFERED 156
      23. \r\nTABLE 156 HERBALIFE INTERNATIONAL OF AMERICA, INC.: KEY DEVELOPMENTS
      24. 157
      25. \r\nTABLE 157 OTSUKA PHARMACEUTICAL CO.,
      26. LTD.: PRODUCTS OFFERED 159
      27. \r\nTABLE 158
      28. OTSUKA PHARMACEUTICAL CO., LTD.: KEY DEVELOPMENTS 160
      29. \r\nTABLE
    138. NATURE'S WAY BRANDS: PRODUCTS OFFERED 161
      1. \r\nTABLE
    139. NATURE'S WAY BRANDS: KEY DEVELOPMENTS 162
      1. \r\nTABLE
    140. NATURE'S BOUNTY: PRODUCTS OFFERED 163
      1. \r\nTABLE 162
      2. NATURE'S BOUNTY: KEY DEVELOPMENTS 164
      3. \r\nTABLE 163
      4. GLOBAL CALCIUM PVT LTD: PRODUCTS OFFERED 165
      5. \r\nTABLE
    141. LEHMANN&VOSS&CO. (LEHVOSS): PRODUCTS OFFERED 167
      1. \r\nTABLE
    142. ZINPRO CORP.: PRODUCTS OFFERED 170
      1. \r\nTABLE 166
      2. NOVOTECH NUTRACEUTICALS, INC.: PRODUCTS OFFERED 172
      3. \r\nTABLE
    143. AMERICA ALIMENTOS SA DE CV: PRODUCTS OFFERED 174
      1. \r\nTABLE
    144. JOST CHEMICAL CO.: PRODUCTS OFFERED 176
      1. \r\n 
      2. \r\nLIST OF FIGURES
      3. \r\nFIGURE 1
      4. MARKET SYNOPSIS 19
      5. \r\nFIGURE 2 GLOBAL VITAMIN &
      6. MINERAL SUPPLEMENTS MARKET ANALYSIS BY TYPE 20
      7. \r\nFIGURE
    145. GLOBAL VITAMIN & MINERAL SUPPLEMENTS MARKET ANALYSIS BY FORM 21
      1. \r\nFIGURE 4 GLOBAL VITAMIN & MINERAL SUPPLEMENTS MARKET ANALYSIS
      2. BY END-USER 22
      3. \r\nFIGURE 5 GLOBAL VITAMIN &
      4. MINERAL SUPPLEMENTS MARKET ANALYSIS BY APPLICATION 23
      5. \r\nFIGURE
    146. GLOBAL VITAMIN & MINERAL SUPPLEMENTS MARKET ANALYSIS BY DISTRIBUTION CHANNEL
      1. 24
      2. \r\nFIGURE 7 GLOBAL VITAMIN & MINERAL
      3. SUPPLEMENTS MARKET ANALYSIS BY REGION 25
      4. \r\nFIGURE 8
      5. GLOBAL VITAMIN & MINERAL SUPPLEMENTS MARKET: STRUCTURE 27
      6. \r\nFIGURE
    147. RESEARCH PROCESS 28
      1. \r\nFIGURE 10 TOP-DOWN & BOTTOM-UP
      2. APPROACHES 31
      3. \r\nFIGURE 11 MARKET DYNAMICS OVERVIEW
      4. 34
      5. \r\nFIGURE 12 HEALTHCARE EXPENDITURE SPENDING
      6. ON INSULIN FOR DIABETES 36
      7. \r\nFIGURE 13
      8. DRIVERS IMPACT ANALYSIS: GLOBAL VITAMIN AND MINERAL SUPPLEMENTS MARKET 37
      9. \r\nFIGURE 14 RESTRAINT IMPACT ANALYSIS: GLOBAL VITAMIN AND MINERAL
      10. SUPPLEMENTS MARKET 38
      11. \r\nFIGURE 15 VALUE CHAIN: GLOBAL
      12. VITAMIN AND MINERAL SUPPLEMENTS MARKET 41
      13. \r\nFIGURE 16
      14. GLOBAL VITAMIN AND MINERAL SUPPLEMENTS MARKET: SUPPLY CHAIN ANALYSIS 43
      15. \r\nFIGURE 17 PORTER'S FIVE FORCES ANALYSIS OF THE GLOBAL VITAMIN
      16. AND MINERAL SUPPLEMENTS MARKET 45
      17. \r\nFIGURE 18
    148. GLOBAL VITAMIN & MINERAL SUPPLEMENTS MARKET, BY TYPE, 2022 (% SHARE) 49
      1. \r\nFIGURE 19 GLOBAL VITAMIN & MINERAL SUPPLEMENTS MARKET,
      2. BY TYPE, 2024–2032 (USD MILLION) 49
      3. \r\nFIGURE 20
    149. GLOBAL VITAMIN & MINERAL SUPPLEMENTS MARKET, BY FORM, 2022 (% SHARE) 54
      1. \r\nFIGURE 21 GLOBAL VITAMIN & MINERAL SUPPLEMENTS MARKET,
      2. BY FORM, 2024–2032 (USD MILLION) 54
      3. \r\nFIGURE 22
    150. GLOBAL VITAMIN & MINERAL SUPPLEMENTS MARKET, BY END USER, 2022 (% SHARE) 59
      1. \r\nFIGURE 23 GLOBAL VITAMIN & MINERAL SUPPLEMENTS MARKET,
      2. BY END USER, 2024–2032 (USD MILLION) 59
      3. \r\nFIGURE
    151. GLOBAL VITAMIN & MINERAL SUPPLEMENTS MARKET, BY APPLICATION, 2022 (% SHARE)
      1. 63
      2. \r\nFIGURE 25 GLOBAL VITAMIN & MINERAL
    152. SUPPLEMENTS MARKET, BY APPLICATION, 2024–2032 (USD MILLION) 64
      1. \r\nFIGURE 26 GLOBAL VITAMIN & MINERAL SUPPLEMENTS MARKET,
      2. BY DISTRIBUTION CHANNEL, 2022 (% SHARE) 72
      3. \r\nFIGURE
    153. GLOBAL VITAMIN & MINERAL SUPPLEMENTS MARKET, BY DISTRIBUTION CHANNEL, 2024–2032
      1. (USD MILLION) 73
      2. \r\nFIGURE 28 GLOBAL VITAMIN &
    154. MINERAL SUPPLEMENT MARKET, BY REGION, 2024–2032 (USD MILLION) 79
      1. \r\nFIGURE 29 GLOBAL VITAMIN & MINERAL SUPPLEMENT MARKET, BY
      2. REGION, 2022 (% SHARE) 80
      3. \r\nFIGURE 30
    155. NORTH AMERICA: VITAMIN & MINERAL SUPPLEMENT MARKET SHARE, BY COUNTRY, 2022 (%
      1. SHARE) 81
      2. \r\nFIGURE 31 EUROPE: VITAMIN &
    156. MINERAL SUPPLEMENT MARKET SHARE, BY COUNTRY, 2022 (% SHARE) 90
      1. \r\nFIGURE 32 ASIA-PACIFIC: VITAMIN & MINERAL SUPPLEMENT MARKET
      2. SHARE, BY COUNTRY, 2022 (% SHARE) 106
      3. \r\nFIGURE 33
    157. REST OF THE WORLD: VITAMIN & MINERAL SUPPLEMENT MARKET SHARE, BY REGION, 2022
      1. (% SHARE) 119
      2. \r\nFIGURE 34 BENCHMARKING OF MAJOR
      3. COMPETITORS 129
      4. \r\nFIGURE 35 BAYER AG: FINANCIAL
      5. OVERVIEW SNAPSHOT 135
      6. \r\nFIGURE 36 BAYER AG: SWOT ANALYSIS
      7. 136
      8. \r\nFIGURE 37 GLANBIA PLC: FINANCIAL OVERVIEW
      9. SNAPSHOT 139
      10. \r\nFIGURE 38 GLANBIA PLC: SWOT ANALYSIS
      11. 141
      12. \r\nFIGURE 39 ABBOTT: FINANCIAL OVERVIEW
      13. SNAPSHOT 143
      14. \r\nFIGURE 40 ABBOTT: SWOT ANALYSIS
      15. 145
      16. \r\nFIGURE 41 PFIZER INC.: FINANCIAL OVERVIEW
      17. SNAPSHOT 146
      18. \r\nFIGURE 42 PFIZER INC.: SWOT ANALYSIS
      19. 148
      20. \r\nFIGURE 43 AMWAY CORP.: FINANCIAL OVERVIEW
      21. SNAPSHOT 149
      22. \r\nFIGURE 44 AMWAY CORP.: SWOT ANALYSIS
      23. 151
      24. \r\nFIGURE 45 GSK PLC.: FINANCIAL OVERVIEW
      25. SNAPSHOT 153
      26. \r\nFIGURE 46 HERBALIFE INTERNATIONAL
      27. OF AMERICA, INC.: FINANCIAL OVERVIEW SNAPSHOT 156
      28. \r\nFIGURE
    158. OTSUKA PHARMACEUTICAL CO., LTD.: FINANCIAL OVERVIEW SNAPSHOT 158
      1. \r\nFIGURE 48 GLOBAL CALCIUM PVT LTD: SWOT ANALYSIS 166
      2. \r\nFIGURE 49 LEHMANN&VOSS&CO. (LEHVOSS): SWOT ANALYSIS
      3. 169
      4. \r\nFIGURE 50 ZINPRO CORP.: SWOT ANALYSIS
      5. 171
      6. \r\nFIGURE 51 NOVOTECH NUTRACEUTICALS, INC.:
      7. SWOT ANALYSIS 173
      8. \r\nFIGURE 52 AMÉRICA ALIMENTOS
      9. SA DE CV: SWOT ANALYSIS 175

    Vitamins D Market Segmentation

    Vitamins D Type Outlook (USD Million, 2019-2030)

    • Vitamins D3
    • Vitamins D2

    Vitamins D Application Outlook (USD Million, 2019-2030)

    • Bakery & Confectionery
    • Dairy & Frozen Desserts
    • Meat Alternatives
    • Oils & Fats
    • Sports Nutrition
    • Dairy Alternatives
    • Dietary Supplements
    • Breakfast Cereals
    • Others

    Vitamins D Regional Outlook (USD Million, 2019-2030)

    • North America Outlook (USD Million, 2019-2030)

      • North America Vitamins D by Type

        • Vitamins D3
        • Vitamins D2
      • North America Vitamins D by Application

        • Bakery & Confectionery
        • Dairy & Frozen Desserts
        • Meat Alternatives
        • Oils & Fats
        • Sports Nutrition
        • Dairy Alternatives
        • Dietary Supplements
        • Breakfast Cereals
        • Others
      • US Outlook (USD Million, 2019-2030)

      • US Vitamins D by Type

        • Vitamins D3
        • Vitamins D2
      • US Vitamins D by Application

        • Bakery & Confectionery
        • Dairy & Frozen Desserts
        • Meat Alternatives
        • Oils & Fats
        • Sports Nutrition
        • Dairy Alternatives
        • Dietary Supplements
        • Breakfast Cereals
        • Others
      • Canada Outlook (USD Million, 2019-2030)

      • Canada Vitamins D by Type

        • Vitamins D3
        • Vitamins D2
      • Canada Vitamins D by Application

        • Bakery & Confectionery
        • Dairy & Frozen Desserts
        • Meat Alternatives
        • Oils & Fats
        • Sports Nutrition
        • Dairy Alternatives
        • Dietary Supplements
        • Breakfast Cereals
        • Others
    • Europe Outlook (USD Million, 2019-2030)

      • Europe Vitamins D by Type

        • Vitamins D3
        • Vitamins D2
      • Europe Vitamins D by Application

        • Bakery & Confectionery
        • Dairy & Frozen Desserts
        • Meat Alternatives
        • Oils & Fats
        • Sports Nutrition
        • Dairy Alternatives
        • Dietary Supplements
        • Breakfast Cereals
        • Others
      • Germany Outlook (USD Million, 2019-2030)

      • Germany Vitamins D by Type

        • Vitamins D3
        • Vitamins D2
      • Germany Vitamins D by Application

        • Bakery & Confectionery
        • Dairy & Frozen Desserts
        • Meat Alternatives
        • Oils & Fats
        • Sports Nutrition
        • Dairy Alternatives
        • Dietary Supplements
        • Breakfast Cereals
        • Others
      • UK Outlook (USD Million, 2019-2030)

      • UK Vitamins D by Type

        • Vitamins D3
        • Vitamins D2
      • UK Vitamins D by Application

        • Bakery & Confectionery
        • Dairy & Frozen Desserts
        • Meat Alternatives
        • Oils & Fats
        • Sports Nutrition
        • Dairy Alternatives
        • Dietary Supplements
        • Breakfast Cereals
        • Others
      • France Outlook (USD Million, 2019-2030)

      • France Vitamins D by Type

        • Vitamins D3
        • Vitamins D2
      • France Vitamins D by Application

        • Bakery & Confectionery
        • Dairy & Frozen Desserts
        • Meat Alternatives
        • Oils & Fats
        • Sports Nutrition
        • Dairy Alternatives
        • Dietary Supplements
        • Breakfast Cereals
        • Others
      • Italy Outlook (USD Million, 2019-2030)

      • Italy Vitamins D by Type

        • Vitamins D3
        • Vitamins D2
      • Italy Vitamins D by Application

        • Bakery & Confectionery
        • Dairy & Frozen Desserts
        • Meat Alternatives
        • Oils & Fats
        • Sports Nutrition
        • Dairy Alternatives
        • Dietary Supplements
        • Breakfast Cereals
        • Others
      • Spain Outlook (USD Million, 2019-2030)

      • Spain Vitamins D by Type

        • Vitamins D3
        • Vitamins D2
      • Spain Vitamins D by Application

        • Bakery & Confectionery
        • Dairy & Frozen Desserts
        • Meat Alternatives
        • Oils & Fats
        • Sports Nutrition
        • Dairy Alternatives
        • Dietary Supplements
        • Breakfast Cereals
        • Others
      • Netherland Outlook (USD Million, 2019-2030)

      • Netherland Vitamins D by Type

        • Vitamins D3
        • Vitamins D2
      • Netherland Vitamins D by Application

        • Bakery & Confectionery
        • Dairy & Frozen Desserts
        • Meat Alternatives
        • Oils & Fats
        • Sports Nutrition
        • Dairy Alternatives
        • Dietary Supplements
        • Breakfast Cereals
        • Others
      • Rest of Europe Outlook (USD Million, 2019-2030)

      • Rest of Europe Vitamins D by Type

        • Vitamins D3
        • Vitamins D2
      • Rest of Europe Vitamins D by Application

        • Bakery & Confectionery
        • Dairy & Frozen Desserts
        • Meat Alternatives
        • Oils & Fats
        • Sports Nutrition
        • Dairy Alternatives
        • Dietary Supplements
        • Breakfast Cereals
        • Others
    • Asia-Pacific Outlook (USD Million, 2019-2030)

      • Asia-Pacific Vitamins D by Type

        • Vitamins D3
        • Vitamins D2
      • Asia-Pacific Vitamins D by Application

        • Bakery & Confectionery
        • Dairy & Frozen Desserts
        • Meat Alternatives
        • Oils & Fats
        • Sports Nutrition
        • Dairy Alternatives
        • Dietary Supplements
        • Breakfast Cereals
        • Others
      • China Outlook (USD Million, 2019-2030)

      • China Vitamins D by Type

        • Vitamins D3
        • Vitamins D2
      • China Vitamins D by Application

        • Bakery & Confectionery
        • Dairy & Frozen Desserts
        • Meat Alternatives
        • Oils & Fats
        • Sports Nutrition
        • Dairy Alternatives
        • Dietary Supplements
        • Breakfast Cereals
        • Others
      • Japan Outlook (USD Million, 2019-2030)

      • Japan Vitamins D by Type

        • Vitamins D3
        • Vitamins D2
      • Japan Vitamins D by Application

        • Bakery & Confectionery
        • Dairy & Frozen Desserts
        • Meat Alternatives
        • Oils & Fats
        • Sports Nutrition
        • Dairy Alternatives
        • Dietary Supplements
        • Breakfast Cereals
        • Others
      • India Outlook (USD Million, 2019-2030)

      • India Vitamins D by Type

        • Vitamins D3
        • Vitamins D2
      • India Vitamins D by Application

        • Bakery & Confectionery
        • Dairy & Frozen Desserts
        • Meat Alternatives
        • Oils & Fats
        • Sports Nutrition
        • Dairy Alternatives
        • Dietary Supplements
        • Breakfast Cereals
        • Others
      • Australia & New Zealand Outlook (USD Million, 2019-2030)

      • Australia & New Zealand Vitamins D by Type

        • Vitamins D3
        • Vitamins D2
      • Australia & New Zealand Vitamins D by Application

        • Bakery & Confectionery
        • Dairy & Frozen Desserts
        • Meat Alternatives
        • Oils & Fats
        • Sports Nutrition
        • Dairy Alternatives
        • Dietary Supplements
        • Breakfast Cereals
        • Others
      • Rest of Asia-Pacific Outlook (USD Million, 2019-2030)

      • Rest of Asia-Pacific Vitamins D by Type

        • Vitamins D3
        • Vitamins D2
      • Rest of Asia-Pacific Vitamins D by Application

        • Bakery & Confectionery
        • Dairy & Frozen Desserts
        • Meat Alternatives
        • Oils & Fats
        • Sports Nutrition
        • Dairy Alternatives
        • Dietary Supplements
        • Breakfast Cereals
        • Others
    • Latin America Outlook (USD Million, 2019-2030)

      • Latin America Vitamins D by Type

        • Vitamins D3
        • Vitamins D2
      • Latin America Vitamins D by Application

        • Bakery & Confectionery
        • Dairy & Frozen Desserts
        • Meat Alternatives
        • Oils & Fats
        • Sports Nutrition
        • Dairy Alternatives
        • Dietary Supplements
        • Breakfast Cereals
        • Others
      • Brazil Outlook (USD Million, 2019-2030)

      • Brazil Vitamins D by Type

        • Vitamins D3
        • Vitamins D2
      • Brazil Vitamins D by Application

        • Bakery & Confectionery
        • Dairy & Frozen Desserts
        • Meat Alternatives
        • Oils & Fats
        • Sports Nutrition
        • Dairy Alternatives
        • Dietary Supplements
        • Breakfast Cereals
        • Others
      • Mexico Outlook (USD Million, 2019-2030)

      • Brazil Vitamins D by Type

        • Vitamins D3
        • Vitamins D2
      • Mexico Vitamins D by Application

        • Bakery & Confectionery
        • Dairy & Frozen Desserts
        • Meat Alternatives
        • Oils & Fats
        • Sports Nutrition
        • Dairy Alternatives
        • Dietary Supplements
        • Breakfast Cereals
        • Others
      • Argentina Outlook (USD Million, 2019-2030)

      • Argentina Vitamins D by Type

        • Vitamins D3
        • Vitamins D2
      • Argentina Vitamins D by Application

        • Bakery & Confectionery
        • Dairy & Frozen Desserts
        • Meat Alternatives
        • Oils & Fats
        • Sports Nutrition
        • Dairy Alternatives
        • Dietary Supplements
        • Breakfast Cereals
        • Others
      • Rest of Latin America Outlook (USD Million, 2019-2030)

      • Rest of Latin America Vitamins D by Type

        • Vitamins D3
        • Vitamins D2
      • Rest of Latin America Vitamins D by Application

        • Bakery & Confectionery
        • Dairy & Frozen Desserts
        • Meat Alternatives
        • Oils & Fats
        • Sports Nutrition
        • Dairy Alternatives
        • Dietary Supplements
        • Breakfast Cereals
        • Others
    • Middle East Outlook (USD Million, 2019-2030)

      • Middle East Vitamins D by Type

        • Vitamins D3
        • Vitamins D2
      • Middle East Vitamins D by Application

        • Bakery & Confectionery
        • Dairy & Frozen Desserts
        • Meat Alternatives
        • Oils & Fats
        • Sports Nutrition
        • Dairy Alternatives
        • Dietary Supplements
        • Breakfast Cereals
        • Others
      • GCC Countries Outlook (USD Million, 2019-2030)

      • GCC Countries Vitamins D by Type

        • Vitamins D3
        • Vitamins D2
      • GCC Countries Vitamins D by Application

        • Bakery & Confectionery
        • Dairy & Frozen Desserts
        • Meat Alternatives
        • Oils & Fats
        • Sports Nutrition
        • Dairy Alternatives
        • Dietary Supplements
        • Breakfast Cereals
        • Others
      • Iran Outlook (USD Million, 2019-2030)

      • Iran Vitamins D by Type

        • Vitamins D3
        • Vitamins D2
      • Iran Vitamins D by Application

        • Bakery & Confectionery
        • Dairy & Frozen Desserts
        • Meat Alternatives
        • Oils & Fats
        • Sports Nutrition
        • Dairy Alternatives
        • Dietary Supplements
        • Breakfast Cereals
        • Others
      • Rest of Middle East Outlook (USD Million, 2019-2030)

      • Rest of Middle East Vitamins D by Type

        • Vitamins D3
        • Vitamins D2
      • Rest of Middle East Vitamins D by Application

        • Bakery & Confectionery
        • Dairy & Frozen Desserts
        • Meat Alternatives
        • Oils & Fats
        • Sports Nutrition
        • Dairy Alternatives
        • Dietary Supplements
        • Breakfast Cereals
        • Others
    • Africa Outlook (USD Million, 2019-2030)

      • Africa Vitamins D by Type

        • Vitamins D3
        • Vitamins D2
      • Africa Vitamins D by Application

        • Bakery & Confectionery
        • Dairy & Frozen Desserts
        • Meat Alternatives
        • Oils & Fats
        • Sports Nutrition
        • Dairy Alternatives
        • Dietary Supplements
        • Breakfast Cereals
        • Others
      • South Africa Outlook (USD Million, 2019-2030)

      • South Africa Vitamins D by Type

        • Vitamins D3
        • Vitamins D2
      • South Africa Vitamins D by Application

        • Bakery & Confectionery
        • Dairy & Frozen Desserts
        • Meat Alternatives
        • Oils & Fats
        • Sports Nutrition
        • Dairy Alternatives
        • Dietary Supplements
        • Breakfast Cereals
        • Others
      • Egypt Outlook (USD Million, 2019-2030)

      • Egypt Vitamins D by Type

        • Vitamins D3
        • Vitamins D2
      • Egypt Vitamins D by Application

        • Bakery & Confectionery
        • Dairy & Frozen Desserts
        • Meat Alternatives
        • Oils & Fats
        • Sports Nutrition
        • Dairy Alternatives
        • Dietary Supplements
        • Breakfast Cereals
        • Others
      • Rest of Africa Outlook (USD Million, 2019-2030)

      • Rest of Africa Vitamins D by Type

        • Vitamins D3
        • Vitamins D2
      • Rest of Africa Vitamins D by Application

        • Bakery & Confectionery
        • Dairy & Frozen Desserts
        • Meat Alternatives
        • Oils & Fats
        • Sports Nutrition
        • Dairy Alternatives
        • Dietary Supplements
        • Breakfast Cereals
        • Others
    Infographic

    Free Sample Request

    Kindly complete the form below to receive a free sample of this Report

    Get Free Sample

    Customer Strories

    “I am very pleased with how market segments have been defined in a relevant way for my purposes (such as "Portable Freezers & refrigerators" and "last-mile"). In general the report is well structured. Thanks very much for your efforts.”

    Victoria Milne

    Founder
    Case Study
    Chemicals and Materials