-
TABLE OF CONTENTS\r\n \r\n \r\n \r\n \r\n1. EXECUTIVE SUMMARY \r\n1.1. Market Overview \r\n1.2. Key Findings \r\n1.3. Market Segmentation \r\n1.4. Competitive Landscape \r\n1.5. Challenges and Opportunities \r\n1.6. Future Outlook \r\n \r\n \r\n \r\n2. MARKET INTRODUCTION \r\n2.1. Definition \r\n2.2. Scope of the study \r\n2.2.1. Research Objective \r\n2.2.2. Assumption \r\n2.2.3. Limitations \r\n3. RESEARCH METHODOLOGY \r\n3.1. Overview \r\n3.2. Data Mining \r\n3.3. Secondary Research \r\n3.4. Primary Research \r\n3.4.1. Primary Interviews and Information Gathering Process \r\n3.4.2. Breakdown of Primary Respondents \r\n3.5. Forecasting Model \r\n3.6. Market Size Estimation \r\n3.6.1. Bottom-Up Approach \r\n3.6.2. Top-Down Approach \r\n3.7. Data Triangulation \r\n3.8. Validation \r\n \r\n \r\n \r\n4. MARKET DYNAMICS \r\n4.1. Overview \r\n4.2. Drivers \r\n4.3. Restraints \r\n4.4. Opportunities \r\n5. MARKET FACTOR ANALYSIS \r\n5.1. Value chain Analysis \r\n5.2. Porter's Five Forces Analysis \r\n5.2.1. Bargaining Power of Suppliers \r\n5.2.2. Bargaining Power of Buyers \r\n5.2.3. Threat of New Entrants \r\n5.2.4. Threat of Substitutes \r\n5.2.5. Intensity of Rivalry \r\n5.3. COVID-19 Impact Analysis \r\n5.3.1. Market Impact Analysis \r\n5.3.2. Regional Impact \r\n5.3.3. Opportunity and Threat Analysis \r\n \r\n \r\n \r\n6. DISTRIBUTION TRANSFORMER MARKET, BY TYPE (USD BILLION) \r\n6.1. Oil-Filled \r\n6.2. Dry Type \r\n6.3. Vacuum \r\n7. DISTRIBUTION TRANSFORMER MARKET, BY POWER RATING (USD BILLION) \r\n7.1. Less than 10 MVA \r\n7.2. 10 MVA to 25 MVA \r\n7.3. 25 MVA to 50 MVA \r\n7.4. More than 50 MVA \r\n8. DISTRIBUTION TRANSFORMER MARKET, BY COOLING METHOD (USD BILLION) \r\n8.1. Natural Air Cooling \r\n8.2. Forced Air Cooling \r\n8.3. Water Cooling \r\n9. DISTRIBUTION TRANSFORMER MARKET, BY END USE (USD BILLION) \r\n9.1. Industrial \r\n9.2. Commercial \r\n9.3. Residential \r\n9.4. Utility \r\n10. DISTRIBUTION TRANSFORMER MARKET, BY REGIONAL (USD BILLION) \r\n10.1. North America \r\n10.1.1. US \r\n10.1.2. Canada \r\n10.2. Europe \r\n10.2.1. Germany \r\n10.2.2. UK \r\n10.2.3. France \r\n10.2.4. Russia \r\n10.2.5. Italy \r\n10.2.6. Spain \r\n10.2.7. Rest of Europe \r\n10.3. APAC \r\n10.3.1. China \r\n10.3.2. India \r\n10.3.3. Japan \r\n10.3.4. South Korea \r\n10.3.5. Malaysia \r\n10.3.6. Thailand \r\n10.3.7. Indonesia \r\n10.3.8. Rest of APAC \r\n10.4. South America \r\n10.4.1. Brazil \r\n10.4.2. Mexico \r\n10.4.3. Argentina \r\n10.4.4. Rest of South America \r\n10.5. MEA \r\n10.5.1. GCC Countries \r\n10.5.2. South Africa \r\n10.5.3. Rest of MEA \r\n \r\n \r\n \r\n11. COMPETITIVE LANDSCAPE \r\n11.1. Overview \r\n11.2. Competitive Analysis \r\n11.3. Market share Analysis \r\n11.4. Major Growth Strategy in the Distribution Transformer Market \r\n11.5. Competitive Benchmarking \r\n11.6. Leading Players in Terms of Number of Developments in the Distribution Transformer Market \r\n11.7. Key developments and growth strategies \r\n11.7.1. New Product Launch/Service Deployment \r\n11.7.2. Merger & Acquisitions \r\n11.7.3. Joint Ventures \r\n11.8. Major Players Financial Matrix \r\n11.8.1. Sales and Operating Income \r\n11.8.2. Major Players R&D Expenditure. 2023 \r\n12. COMPANY PROFILES \r\n12.1. ABB \r\n12.1.1. Financial Overview \r\n12.1.2. Products Offered \r\n12.1.3. Key Developments \r\n12.1.4. SWOT Analysis \r\n12.1.5. Key Strategies \r\n12.2. Hammond Power Solutions \r\n12.2.1. Financial Overview \r\n12.2.2. Products Offered \r\n12.2.3. Key Developments \r\n12.2.4. SWOT Analysis \r\n12.2.5. Key Strategies \r\n12.3. Crompton Greaves \r\n12.3.1. Financial Overview \r\n12.3.2. Products Offered \r\n12.3.3. Key Developments \r\n12.3.4. SWOT Analysis \r\n12.3.5. Key Strategies \r\n12.4. Vijay Electricals \r\n12.4.1. Financial Overview \r\n12.4.2. Products Offered \r\n12.4.3. Key Developments \r\n12.4.4. SWOT Analysis \r\n12.4.5. Key Strategies \r\n12.5. Larsen and Toubro \r\n12.5.1. Financial Overview \r\n12.5.2. Products Offered \r\n12.5.3. Key Developments \r\n12.5.4. SWOT Analysis \r\n12.5.5. Key Strategies \r\n12.6. Emerson Electric \r\n12.6.1. Financial Overview \r\n12.6.2. Products Offered \r\n12.6.3. Key Developments \r\n12.6.4. SWOT Analysis \r\n12.6.5. Key Strategies \r\n12.7. Eaton \r\n12.7.1. Financial Overview \r\n12.7.2. Products Offered \r\n12.7.3. Key Developments \r\n12.7.4. SWOT Analysis \r\n12.7.5. Key Strategies \r\n12.8. Schneider Electric \r\n12.8.1. Financial Overview \r\n12.8.2. Products Offered \r\n12.8.3. Key Developments \r\n12.8.4. SWOT Analysis \r\n12.8.5. Key Strategies \r\n12.9. Toshiba \r\n12.9.1. Financial Overview \r\n12.9.2. Products Offered \r\n12.9.3. Key Developments \r\n12.9.4. SWOT Analysis \r\n12.9.5. Key Strategies \r\n12.10. Nexans \r\n12.10.1. Financial Overview \r\n12.10.2. Products Offered \r\n12.10.3. Key Developments \r\n12.10.4. SWOT Analysis \r\n12.10.5. Key Strategies \r\n12.11. Honeywell \r\n12.11.1. Financial Overview \r\n12.11.2. Products Offered \r\n12.11.3. Key Developments \r\n12.11.4. SWOT Analysis \r\n12.11.5. Key Strategies \r\n12.12. Pfisterer \r\n12.12.1. Financial Overview \r\n12.12.2. Products Offered \r\n12.12.3. Key Developments \r\n12.12.4. SWOT Analysis \r\n12.12.5. Key Strategies \r\n12.13. Siemens \r\n12.13.1. Financial Overview \r\n12.13.2. Products Offered \r\n12.13.3. Key Developments \r\n12.13.4. SWOT Analysis \r\n12.13.5. Key Strategies \r\n12.14. Mitsubishi Electric \r\n12.14.1. Financial Overview \r\n12.14.2. Products Offered \r\n12.14.3. Key Developments \r\n12.14.4. SWOT Analysis \r\n12.14.5. Key Strategies \r\n12.15. General Electric \r\n12.15.1. Financial Overview \r\n12.15.2. Products Offered \r\n12.15.3. Key Developments \r\n12.15.4. SWOT Analysis \r\n12.15.5. Key Strategies \r\n13.
-
APPENDIX \r\n13.1.
-
References \r\n13.2. Related Reports \r\nLIST OF TABLES\r\n \r\nTABLE
-
LIST OF ASSUMPTIONS \r\nTABLE
-
NORTH AMERICA DISTRIBUTION TRANSFORMER MARKET SIZE ESTIMATES & FORECAST, BY TYPE, 2019-2035 (USD BILLIONS) \r\nTABLE
-
NORTH AMERICA DISTRIBUTION TRANSFORMER MARKET SIZE ESTIMATES & FORECAST, BY POWER RATING, 2019-2035 (USD BILLIONS) \r\nTABLE
-
NORTH AMERICA DISTRIBUTION TRANSFORMER MARKET SIZE ESTIMATES & FORECAST, BY COOLING METHOD, 2019-2035 (USD BILLIONS) \r\nTABLE
-
NORTH AMERICA DISTRIBUTION TRANSFORMER MARKET SIZE ESTIMATES & FORECAST, BY END USE, 2019-2035 (USD BILLIONS) \r\nTABLE
-
NORTH AMERICA DISTRIBUTION TRANSFORMER MARKET SIZE ESTIMATES & FORECAST, BY REGIONAL, 2019-2035 (USD BILLIONS) \r\nTABLE
-
US DISTRIBUTION TRANSFORMER MARKET SIZE ESTIMATES & FORECAST, BY TYPE, 2019-2035 (USD BILLIONS) \r\nTABLE
-
US DISTRIBUTION TRANSFORMER MARKET SIZE ESTIMATES & FORECAST, BY POWER RATING, 2019-2035 (USD BILLIONS) \r\nTABLE
-
US DISTRIBUTION TRANSFORMER MARKET SIZE ESTIMATES & FORECAST, BY COOLING METHOD, 2019-2035 (USD BILLIONS) \r\nTABLE
-
US DISTRIBUTION TRANSFORMER MARKET SIZE ESTIMATES & FORECAST, BY END USE, 2019-2035 (USD BILLIONS) \r\nTABLE
-
US DISTRIBUTION TRANSFORMER MARKET SIZE ESTIMATES & FORECAST, BY REGIONAL, 2019-2035 (USD BILLIONS) \r\nTABLE
-
CANADA DISTRIBUTION TRANSFORMER MARKET SIZE ESTIMATES & FORECAST, BY TYPE, 2019-2035 (USD BILLIONS) \r\nTABLE
-
CANADA DISTRIBUTION TRANSFORMER MARKET SIZE ESTIMATES & FORECAST, BY POWER RATING, 2019-2035 (USD BILLIONS) \r\nTABLE
-
CANADA DISTRIBUTION TRANSFORMER MARKET SIZE ESTIMATES & FORECAST, BY COOLING METHOD, 2019-2035 (USD BILLIONS) \r\nTABLE
-
CANADA DISTRIBUTION TRANSFORMER MARKET SIZE ESTIMATES & FORECAST, BY END USE, 2019-2035 (USD BILLIONS) \r\nTABLE
-
CANADA DISTRIBUTION TRANSFORMER MARKET SIZE ESTIMATES & FORECAST, BY REGIONAL, 2019-2035 (USD BILLIONS) \r\nTABLE
-
EUROPE DISTRIBUTION TRANSFORMER MARKET SIZE ESTIMATES & FORECAST, BY TYPE, 2019-2035 (USD BILLIONS) \r\nTABLE
-
EUROPE DISTRIBUTION TRANSFORMER MARKET SIZE ESTIMATES & FORECAST, BY POWER RATING, 2019-2035 (USD BILLIONS) \r\nTABLE
-
EUROPE DISTRIBUTION TRANSFORMER MARKET SIZE ESTIMATES & FORECAST, BY COOLING METHOD, 2019-2035 (USD BILLIONS) \r\nTABLE
-
EUROPE DISTRIBUTION TRANSFORMER MARKET SIZE ESTIMATES & FORECAST, BY END USE, 2019-2035 (USD BILLIONS) \r\nTABLE
-
EUROPE DISTRIBUTION TRANSFORMER MARKET SIZE ESTIMATES & FORECAST, BY REGIONAL, 2019-2035 (USD BILLIONS) \r\nTABLE
-
GERMANY DISTRIBUTION TRANSFORMER MARKET SIZE ESTIMATES & FORECAST, BY TYPE, 2019-2035 (USD BILLIONS) \r\nTABLE
-
GERMANY DISTRIBUTION TRANSFORMER MARKET SIZE ESTIMATES & FORECAST, BY POWER RATING, 2019-2035 (USD BILLIONS) \r\nTABLE
-
GERMANY DISTRIBUTION TRANSFORMER MARKET SIZE ESTIMATES & FORECAST, BY COOLING METHOD, 2019-2035 (USD BILLIONS) \r\nTABLE
-
GERMANY DISTRIBUTION TRANSFORMER MARKET SIZE ESTIMATES & FORECAST, BY END USE, 2019-2035 (USD BILLIONS) \r\nTABLE
-
GERMANY DISTRIBUTION TRANSFORMER MARKET SIZE ESTIMATES & FORECAST, BY REGIONAL, 2019-2035 (USD BILLIONS) \r\nTABLE
-
UK DISTRIBUTION TRANSFORMER MARKET SIZE ESTIMATES & FORECAST, BY TYPE, 2019-2035 (USD BILLIONS) \r\nTABLE
-
UK DISTRIBUTION TRANSFORMER MARKET SIZE ESTIMATES & FORECAST, BY POWER RATING, 2019-2035 (USD BILLIONS) \r\nTABLE
-
UK DISTRIBUTION TRANSFORMER MARKET SIZE ESTIMATES & FORECAST, BY COOLING METHOD, 2019-2035 (USD BILLIONS) \r\nTABLE
-
UK DISTRIBUTION TRANSFORMER MARKET SIZE ESTIMATES & FORECAST, BY END USE, 2019-2035 (USD BILLIONS) \r\nTABLE
-
UK DISTRIBUTION TRANSFORMER MARKET SIZE ESTIMATES & FORECAST, BY REGIONAL, 2019-2035 (USD BILLIONS) \r\nTABLE
-
FRANCE DISTRIBUTION TRANSFORMER MARKET SIZE ESTIMATES & FORECAST, BY TYPE, 2019-2035 (USD BILLIONS) \r\nTABLE
-
FRANCE DISTRIBUTION TRANSFORMER MARKET SIZE ESTIMATES & FORECAST, BY POWER RATING, 2019-2035 (USD BILLIONS) \r\nTABLE
-
FRANCE DISTRIBUTION TRANSFORMER MARKET SIZE ESTIMATES & FORECAST, BY COOLING METHOD, 2019-2035 (USD BILLIONS) \r\nTABLE
-
FRANCE DISTRIBUTION TRANSFORMER MARKET SIZE ESTIMATES & FORECAST, BY END USE, 2019-2035 (USD BILLIONS) \r\nTABLE
-
FRANCE DISTRIBUTION TRANSFORMER MARKET SIZE ESTIMATES & FORECAST, BY REGIONAL, 2019-2035 (USD BILLIONS) \r\nTABLE
-
RUSSIA DISTRIBUTION TRANSFORMER MARKET SIZE ESTIMATES & FORECAST, BY TYPE, 2019-2035 (USD BILLIONS) \r\nTABLE
-
RUSSIA DISTRIBUTION TRANSFORMER MARKET SIZE ESTIMATES & FORECAST, BY POWER RATING, 2019-2035 (USD BILLIONS) \r\nTABLE
-
RUSSIA DISTRIBUTION TRANSFORMER MARKET SIZE ESTIMATES & FORECAST, BY COOLING METHOD, 2019-2035 (USD BILLIONS) \r\nTABLE
-
RUSSIA DISTRIBUTION TRANSFORMER MARKET SIZE ESTIMATES & FORECAST, BY END USE, 2019-2035 (USD BILLIONS) \r\nTABLE
-
RUSSIA DISTRIBUTION TRANSFORMER MARKET SIZE ESTIMATES & FORECAST, BY REGIONAL, 2019-2035 (USD BILLIONS) \r\nTABLE
-
ITALY DISTRIBUTION TRANSFORMER MARKET SIZE ESTIMATES & FORECAST, BY TYPE, 2019-2035 (USD BILLIONS) \r\nTABLE
-
ITALY DISTRIBUTION TRANSFORMER MARKET SIZE ESTIMATES & FORECAST, BY POWER RATING, 2019-2035 (USD BILLIONS) \r\nTABLE
-
ITALY DISTRIBUTION TRANSFORMER MARKET SIZE ESTIMATES & FORECAST, BY COOLING METHOD, 2019-2035 (USD BILLIONS) \r\nTABLE
-
ITALY DISTRIBUTION TRANSFORMER MARKET SIZE ESTIMATES & FORECAST, BY END USE, 2019-2035 (USD BILLIONS) \r\nTABLE
-
ITALY DISTRIBUTION TRANSFORMER MARKET SIZE ESTIMATES & FORECAST, BY REGIONAL, 2019-2035 (USD BILLIONS) \r\nTABLE
-
SPAIN DISTRIBUTION TRANSFORMER MARKET SIZE ESTIMATES & FORECAST, BY TYPE, 2019-2035 (USD BILLIONS) \r\nTABLE
-
SPAIN DISTRIBUTION TRANSFORMER MARKET SIZE ESTIMATES & FORECAST, BY POWER RATING, 2019-2035 (USD BILLIONS) \r\nTABLE
-
SPAIN DISTRIBUTION TRANSFORMER MARKET SIZE ESTIMATES & FORECAST, BY COOLING METHOD, 2019-2035 (USD BILLIONS) \r\nTABLE
-
SPAIN DISTRIBUTION TRANSFORMER MARKET SIZE ESTIMATES & FORECAST, BY END USE, 2019-2035 (USD BILLIONS) \r\nTABLE
-
SPAIN DISTRIBUTION TRANSFORMER MARKET SIZE ESTIMATES & FORECAST, BY REGIONAL, 2019-2035 (USD BILLIONS) \r\nTABLE
-
REST OF EUROPE DISTRIBUTION TRANSFORMER MARKET SIZE ESTIMATES & FORECAST, BY TYPE, 2019-2035 (USD BILLIONS) \r\nTABLE
-
REST OF EUROPE DISTRIBUTION TRANSFORMER MARKET SIZE ESTIMATES & FORECAST, BY POWER RATING, 2019-2035 (USD BILLIONS) \r\nTABLE
-
REST OF EUROPE DISTRIBUTION TRANSFORMER MARKET SIZE ESTIMATES & FORECAST, BY COOLING METHOD, 2019-2035 (USD BILLIONS) \r\nTABLE
-
REST OF EUROPE DISTRIBUTION TRANSFORMER MARKET SIZE ESTIMATES & FORECAST, BY END USE, 2019-2035 (USD BILLIONS) \r\nTABLE
-
REST OF EUROPE DISTRIBUTION TRANSFORMER MARKET SIZE ESTIMATES & FORECAST, BY REGIONAL, 2019-2035 (USD BILLIONS) \r\nTABLE
-
APAC DISTRIBUTION TRANSFORMER MARKET SIZE ESTIMATES & FORECAST, BY TYPE, 2019-2035 (USD BILLIONS) \r\nTABLE
-
APAC DISTRIBUTION TRANSFORMER MARKET SIZE ESTIMATES & FORECAST, BY POWER RATING, 2019-2035 (USD BILLIONS) \r\nTABLE
-
APAC DISTRIBUTION TRANSFORMER MARKET SIZE ESTIMATES & FORECAST, BY COOLING METHOD, 2019-2035 (USD BILLIONS) \r\nTABLE
-
APAC DISTRIBUTION TRANSFORMER MARKET SIZE ESTIMATES & FORECAST, BY END USE, 2019-2035 (USD BILLIONS) \r\nTABLE
-
APAC DISTRIBUTION TRANSFORMER MARKET SIZE ESTIMATES & FORECAST, BY REGIONAL, 2019-2035 (USD BILLIONS) \r\nTABLE
-
CHINA DISTRIBUTION TRANSFORMER MARKET SIZE ESTIMATES & FORECAST, BY TYPE, 2019-2035 (USD BILLIONS) \r\nTABLE
-
CHINA DISTRIBUTION TRANSFORMER MARKET SIZE ESTIMATES & FORECAST, BY POWER RATING, 2019-2035 (USD BILLIONS) \r\nTABLE
-
CHINA DISTRIBUTION TRANSFORMER MARKET SIZE ESTIMATES & FORECAST, BY COOLING METHOD, 2019-2035 (USD BILLIONS) \r\nTABLE
-
CHINA DISTRIBUTION TRANSFORMER MARKET SIZE ESTIMATES & FORECAST, BY END USE, 2019-2035 (USD BILLIONS) \r\nTABLE
-
CHINA DISTRIBUTION TRANSFORMER MARKET SIZE ESTIMATES & FORECAST, BY REGIONAL, 2019-2035 (USD BILLIONS) \r\nTABLE
-
INDIA DISTRIBUTION TRANSFORMER MARKET SIZE ESTIMATES & FORECAST, BY TYPE, 2019-2035 (USD BILLIONS) \r\nTABLE
-
INDIA DISTRIBUTION TRANSFORMER MARKET SIZE ESTIMATES & FORECAST, BY POWER RATING, 2019-2035 (USD BILLIONS) \r\nTABLE
-
INDIA DISTRIBUTION TRANSFORMER MARKET SIZE ESTIMATES & FORECAST, BY COOLING METHOD, 2019-2035 (USD BILLIONS) \r\nTABLE
-
INDIA DISTRIBUTION TRANSFORMER MARKET SIZE ESTIMATES & FORECAST, BY END USE, 2019-2035 (USD BILLIONS) \r\nTABLE
-
INDIA DISTRIBUTION TRANSFORMER MARKET SIZE ESTIMATES & FORECAST, BY REGIONAL, 2019-2035 (USD BILLIONS) \r\nTABLE
-
JAPAN DISTRIBUTION TRANSFORMER MARKET SIZE ESTIMATES & FORECAST, BY TYPE, 2019-2035 (USD BILLIONS) \r\nTABLE
-
JAPAN DISTRIBUTION TRANSFORMER MARKET SIZE ESTIMATES & FORECAST, BY POWER RATING, 2019-2035 (USD BILLIONS) \r\nTABLE
-
JAPAN DISTRIBUTION TRANSFORMER MARKET SIZE ESTIMATES & FORECAST, BY COOLING METHOD, 2019-2035 (USD BILLIONS) \r\nTABLE
-
JAPAN DISTRIBUTION TRANSFORMER MARKET SIZE ESTIMATES & FORECAST, BY END USE, 2019-2035 (USD BILLIONS) \r\nTABLE
-
JAPAN DISTRIBUTION TRANSFORMER MARKET SIZE ESTIMATES & FORECAST, BY REGIONAL, 2019-2035 (USD BILLIONS) \r\nTABLE
-
SOUTH KOREA DISTRIBUTION TRANSFORMER MARKET SIZE ESTIMATES & FORECAST, BY TYPE, 2019-2035 (USD BILLIONS) \r\nTABLE
-
SOUTH KOREA DISTRIBUTION TRANSFORMER MARKET SIZE ESTIMATES & FORECAST, BY POWER RATING, 2019-2035 (USD BILLIONS) \r\nTABLE
-
SOUTH KOREA DISTRIBUTION TRANSFORMER MARKET SIZE ESTIMATES & FORECAST, BY COOLING METHOD, 2019-2035 (USD BILLIONS) \r\nTABLE
-
SOUTH KOREA DISTRIBUTION TRANSFORMER MARKET SIZE ESTIMATES & FORECAST, BY END USE, 2019-2035 (USD BILLIONS) \r\nTABLE
-
SOUTH KOREA DISTRIBUTION TRANSFORMER MARKET SIZE ESTIMATES & FORECAST, BY REGIONAL, 2019-2035 (USD BILLIONS) \r\nTABLE
-
MALAYSIA DISTRIBUTION TRANSFORMER MARKET SIZE ESTIMATES & FORECAST, BY TYPE, 2019-2035 (USD BILLIONS) \r\nTABLE
-
MALAYSIA DISTRIBUTION TRANSFORMER MARKET SIZE ESTIMATES & FORECAST, BY POWER RATING, 2019-2035 (USD BILLIONS) \r\nTABLE
-
MALAYSIA DISTRIBUTION TRANSFORMER MARKET SIZE ESTIMATES & FORECAST, BY COOLING METHOD, 2019-2035 (USD BILLIONS) \r\nTABLE
-
MALAYSIA DISTRIBUTION TRANSFORMER MARKET SIZE ESTIMATES & FORECAST, BY END USE, 2019-2035 (USD BILLIONS) \r\nTABLE
-
MALAYSIA DISTRIBUTION TRANSFORMER MARKET SIZE ESTIMATES & FORECAST, BY REGIONAL, 2019-2035 (USD BILLIONS) \r\nTABLE
-
THAILAND DISTRIBUTION TRANSFORMER MARKET SIZE ESTIMATES & FORECAST, BY TYPE, 2019-2035 (USD BILLIONS) \r\nTABLE
-
THAILAND DISTRIBUTION TRANSFORMER MARKET SIZE ESTIMATES & FORECAST, BY POWER RATING, 2019-2035 (USD BILLIONS) \r\nTABLE
-
THAILAND DISTRIBUTION TRANSFORMER MARKET SIZE ESTIMATES & FORECAST, BY COOLING METHOD, 2019-2035 (USD BILLIONS) \r\nTABLE
-
THAILAND DISTRIBUTION TRANSFORMER MARKET SIZE ESTIMATES & FORECAST, BY END USE, 2019-2035 (USD BILLIONS) \r\nTABLE
-
THAILAND DISTRIBUTION TRANSFORMER MARKET SIZE ESTIMATES & FORECAST, BY REGIONAL, 2019-2035 (USD BILLIONS) \r\nTABLE
-
INDONESIA DISTRIBUTION TRANSFORMER MARKET SIZE ESTIMATES & FORECAST, BY TYPE, 2019-2035 (USD BILLIONS) \r\nTABLE
-
INDONESIA DISTRIBUTION TRANSFORMER MARKET SIZE ESTIMATES & FORECAST, BY POWER RATING, 2019-2035 (USD BILLIONS) \r\nTABLE
-
INDONESIA DISTRIBUTION TRANSFORMER MARKET SIZE ESTIMATES & FORECAST, BY COOLING METHOD, 2019-2035 (USD BILLIONS) \r\nTABLE
-
INDONESIA DISTRIBUTION TRANSFORMER MARKET SIZE ESTIMATES & FORECAST, BY END USE, 2019-2035 (USD BILLIONS) \r\nTABLE
-
INDONESIA DISTRIBUTION TRANSFORMER MARKET SIZE ESTIMATES & FORECAST, BY REGIONAL, 2019-2035 (USD BILLIONS) \r\nTABLE
-
REST OF APAC DISTRIBUTION TRANSFORMER MARKET SIZE ESTIMATES & FORECAST, BY TYPE, 2019-2035 (USD BILLIONS) \r\nTABLE
-
REST OF APAC DISTRIBUTION TRANSFORMER MARKET SIZE ESTIMATES & FORECAST, BY POWER RATING, 2019-2035 (USD BILLIONS) \r\nTABLE
-
REST OF APAC DISTRIBUTION TRANSFORMER MARKET SIZE ESTIMATES & FORECAST, BY COOLING METHOD, 2019-2035 (USD BILLIONS) \r\nTABLE
-
REST OF APAC DISTRIBUTION TRANSFORMER MARKET SIZE ESTIMATES & FORECAST, BY END USE, 2019-2035 (USD BILLIONS) \r\nTABLE
-
REST OF APAC DISTRIBUTION TRANSFORMER MARKET SIZE ESTIMATES & FORECAST, BY REGIONAL, 2019-2035 (USD BILLIONS) \r\nTABLE
-
SOUTH AMERICA DISTRIBUTION TRANSFORMER MARKET SIZE ESTIMATES & FORECAST, BY TYPE, 2019-2035 (USD BILLIONS) \r\nTABLE
-
SOUTH AMERICA DISTRIBUTION TRANSFORMER MARKET SIZE ESTIMATES & FORECAST, BY POWER RATING, 2019-2035 (USD BILLIONS) \r\nTABLE
-
SOUTH AMERICA DISTRIBUTION TRANSFORMER MARKET SIZE ESTIMATES & FORECAST, BY COOLING METHOD, 2019-2035 (USD BILLIONS) \r\nTABLE
-
SOUTH AMERICA DISTRIBUTION TRANSFORMER MARKET SIZE ESTIMATES & FORECAST, BY END USE, 2019-2035 (USD BILLIONS) \r\nTABLE
-
SOUTH AMERICA DISTRIBUTION TRANSFORMER MARKET SIZE ESTIMATES & FORECAST, BY REGIONAL, 2019-2035 (USD BILLIONS) \r\nTABLE
-
BRAZIL DISTRIBUTION TRANSFORMER MARKET SIZE ESTIMATES & FORECAST, BY TYPE, 2019-2035 (USD BILLIONS) \r\nTABLE
-
BRAZIL DISTRIBUTION TRANSFORMER MARKET SIZE ESTIMATES & FORECAST, BY POWER RATING, 2019-2035 (USD BILLIONS) \r\nTABLE
-
BRAZIL DISTRIBUTION TRANSFORMER MARKET SIZE ESTIMATES & FORECAST, BY COOLING METHOD, 2019-2035 (USD BILLIONS) \r\nTABLE
-
BRAZIL DISTRIBUTION TRANSFORMER MARKET SIZE ESTIMATES & FORECAST, BY END USE, 2019-2035 (USD BILLIONS) \r\nTABLE
-
BRAZIL DISTRIBUTION TRANSFORMER MARKET SIZE ESTIMATES & FORECAST, BY REGIONAL, 2019-2035 (USD BILLIONS) \r\nTABLE
-
MEXICO DISTRIBUTION TRANSFORMER MARKET SIZE ESTIMATES & FORECAST, BY TYPE, 2019-2035 (USD BILLIONS) \r\nTABLE
-
MEXICO DISTRIBUTION TRANSFORMER MARKET SIZE ESTIMATES & FORECAST, BY POWER RATING, 2019-2035 (USD BILLIONS) \r\nTABLE
-
MEXICO DISTRIBUTION TRANSFORMER MARKET SIZE ESTIMATES & FORECAST, BY COOLING METHOD, 2019-2035 (USD BILLIONS) \r\nTABLE
-
MEXICO DISTRIBUTION TRANSFORMER MARKET SIZE ESTIMATES & FORECAST, BY END USE, 2019-2035 (USD BILLIONS) \r\nTABLE
-
MEXICO DISTRIBUTION TRANSFORMER MARKET SIZE ESTIMATES & FORECAST, BY REGIONAL, 2019-2035 (USD BILLIONS) \r\nTABLE
-
ARGENTINA DISTRIBUTION TRANSFORMER MARKET SIZE ESTIMATES & FORECAST, BY TYPE, 2019-2035 (USD BILLIONS) \r\nTABLE
-
ARGENTINA DISTRIBUTION TRANSFORMER MARKET SIZE ESTIMATES & FORECAST, BY POWER RATING, 2019-2035 (USD BILLIONS) \r\nTABLE
-
ARGENTINA DISTRIBUTION TRANSFORMER MARKET SIZE ESTIMATES & FORECAST, BY COOLING METHOD, 2019-2035 (USD BILLIONS) \r\nTABLE
-
ARGENTINA DISTRIBUTION TRANSFORMER MARKET SIZE ESTIMATES & FORECAST, BY END USE, 2019-2035 (USD BILLIONS) \r\nTABLE
-
ARGENTINA DISTRIBUTION TRANSFORMER MARKET SIZE ESTIMATES & FORECAST, BY REGIONAL, 2019-2035 (USD BILLIONS) \r\nTABLE
-
REST OF SOUTH AMERICA DISTRIBUTION TRANSFORMER MARKET SIZE ESTIMATES & FORECAST, BY TYPE, 2019-2035 (USD BILLIONS) \r\nTABLE
-
REST OF SOUTH AMERICA DISTRIBUTION TRANSFORMER MARKET SIZE ESTIMATES & FORECAST, BY POWER RATING, 2019-2035 (USD BILLIONS) \r\nTABLE
-
REST OF SOUTH AMERICA DISTRIBUTION TRANSFORMER MARKET SIZE ESTIMATES & FORECAST, BY COOLING METHOD, 2019-2035 (USD BILLIONS) \r\nTABLE
-
REST OF SOUTH AMERICA DISTRIBUTION TRANSFORMER MARKET SIZE ESTIMATES & FORECAST, BY END USE, 2019-2035 (USD BILLIONS) \r\nTABLE
-
REST OF SOUTH AMERICA DISTRIBUTION TRANSFORMER MARKET SIZE ESTIMATES & FORECAST, BY REGIONAL, 2019-2035 (USD BILLIONS) \r\nTABLE
-
MEA DISTRIBUTION TRANSFORMER MARKET SIZE ESTIMATES & FORECAST, BY TYPE, 2019-2035 (USD BILLIONS) \r\nTABLE
-
MEA DISTRIBUTION TRANSFORMER MARKET SIZE ESTIMATES & FORECAST, BY POWER RATING, 2019-2035 (USD BILLIONS) \r\nTABLE
-
MEA DISTRIBUTION TRANSFORMER MARKET SIZE ESTIMATES & FORECAST, BY COOLING METHOD, 2019-2035 (USD BILLIONS) \r\nTABLE
-
MEA DISTRIBUTION TRANSFORMER MARKET SIZE ESTIMATES & FORECAST, BY END USE, 2019-2035 (USD BILLIONS) \r\nTABLE
-
MEA DISTRIBUTION TRANSFORMER MARKET SIZE ESTIMATES & FORECAST, BY REGIONAL, 2019-2035 (USD BILLIONS) \r\nTABLE
-
GCC COUNTRIES DISTRIBUTION TRANSFORMER MARKET SIZE ESTIMATES & FORECAST, BY TYPE, 2019-2035 (USD BILLIONS) \r\nTABLE
-
GCC COUNTRIES DISTRIBUTION TRANSFORMER MARKET SIZE ESTIMATES & FORECAST, BY POWER RATING, 2019-2035 (USD BILLIONS) \r\nTABLE
-
GCC COUNTRIES DISTRIBUTION TRANSFORMER MARKET SIZE ESTIMATES & FORECAST, BY COOLING METHOD, 2019-2035 (USD BILLIONS) \r\nTABLE
-
GCC COUNTRIES DISTRIBUTION TRANSFORMER MARKET SIZE ESTIMATES & FORECAST, BY END USE, 2019-2035 (USD BILLIONS) \r\nTABLE
-
GCC COUNTRIES DISTRIBUTION TRANSFORMER MARKET SIZE ESTIMATES & FORECAST, BY REGIONAL, 2019-2035 (USD BILLIONS) \r\nTABLE
-
SOUTH AFRICA DISTRIBUTION TRANSFORMER MARKET SIZE ESTIMATES & FORECAST, BY TYPE, 2019-2035 (USD BILLIONS) \r\nTABLE
-
SOUTH AFRICA DISTRIBUTION TRANSFORMER MARKET SIZE ESTIMATES & FORECAST, BY POWER RATING, 2019-2035 (USD BILLIONS) \r\nTABLE
-
SOUTH AFRICA DISTRIBUTION TRANSFORMER MARKET SIZE ESTIMATES & FORECAST, BY COOLING METHOD, 2019-2035 (USD BILLIONS) \r\nTABLE
-
SOUTH AFRICA DISTRIBUTION TRANSFORMER MARKET SIZE ESTIMATES & FORECAST, BY END USE, 2019-2035 (USD BILLIONS) \r\nTABLE
-
SOUTH AFRICA DISTRIBUTION TRANSFORMER MARKET SIZE ESTIMATES & FORECAST, BY REGIONAL, 2019-2035 (USD BILLIONS) \r\nTABLE
-
REST OF MEA DISTRIBUTION TRANSFORMER MARKET SIZE ESTIMATES & FORECAST, BY TYPE, 2019-2035 (USD BILLIONS) \r\nTABLE
-
REST OF MEA DISTRIBUTION TRANSFORMER MARKET SIZE ESTIMATES & FORECAST, BY POWER RATING, 2019-2035 (USD BILLIONS) \r\nTABLE
-
REST OF MEA DISTRIBUTION TRANSFORMER MARKET SIZE ESTIMATES & FORECAST, BY COOLING METHOD, 2019-2035 (USD BILLIONS) \r\nTABLE
-
REST OF MEA DISTRIBUTION TRANSFORMER MARKET SIZE ESTIMATES & FORECAST, BY END USE, 2019-2035 (USD BILLIONS) \r\nTABLE
-
REST OF MEA DISTRIBUTION TRANSFORMER MARKET SIZE ESTIMATES & FORECAST, BY REGIONAL, 2019-2035 (USD BILLIONS) \r\nTABLE
-
PRODUCT LAUNCH/PRODUCT DEVELOPMENT/APPROVAL \r\nTABLE
-
ACQUISITION/PARTNERSHIP \r\n \r\n \r\n \r\n \r\n \r\n \r\n \r\n \r\n \r\n \r\n \r\n \r\n \r\n \r\n \r\n \r\n \r\n \r\n \r\n \r\n \r\n \r\n \r\n \r\n \r\n \r\n \r\n \r\n \r\nLIST OF FIGURES\r\n \r\nFIGURE
-
MARKET SYNOPSIS \r\nFIGURE
-
NORTH AMERICA DISTRIBUTION TRANSFORMER MARKET ANALYSIS \r\nFIGURE
-
US DISTRIBUTION TRANSFORMER MARKET ANALYSIS BY TYPE \r\nFIGURE
-
US DISTRIBUTION TRANSFORMER MARKET ANALYSIS BY POWER RATING \r\nFIGURE
-
US DISTRIBUTION TRANSFORMER MARKET ANALYSIS BY COOLING METHOD \r\nFIGURE
-
US DISTRIBUTION TRANSFORMER MARKET ANALYSIS BY END USE \r\nFIGURE
-
US DISTRIBUTION TRANSFORMER MARKET ANALYSIS BY REGIONAL \r\nFIGURE
-
CANADA DISTRIBUTION TRANSFORMER MARKET ANALYSIS BY TYPE \r\nFIGURE
-
CANADA DISTRIBUTION TRANSFORMER MARKET ANALYSIS BY POWER RATING \r\nFIGURE
-
CANADA DISTRIBUTION TRANSFORMER MARKET ANALYSIS BY COOLING METHOD \r\nFIGURE
-
CANADA DISTRIBUTION TRANSFORMER MARKET ANALYSIS BY END USE \r\nFIGURE
-
CANADA DISTRIBUTION TRANSFORMER MARKET ANALYSIS BY REGIONAL \r\nFIGURE
-
EUROPE DISTRIBUTION TRANSFORMER MARKET ANALYSIS \r\nFIGURE
-
GERMANY DISTRIBUTION TRANSFORMER MARKET ANALYSIS BY TYPE \r\nFIGURE
-
GERMANY DISTRIBUTION TRANSFORMER MARKET ANALYSIS BY POWER RATING \r\nFIGURE
-
GERMANY DISTRIBUTION TRANSFORMER MARKET ANALYSIS BY COOLING METHOD \r\nFIGURE
-
GERMANY DISTRIBUTION TRANSFORMER MARKET ANALYSIS BY END USE \r\nFIGURE
-
GERMANY DISTRIBUTION TRANSFORMER MARKET ANALYSIS BY REGIONAL \r\nFIGURE
-
UK DISTRIBUTION TRANSFORMER MARKET ANALYSIS BY TYPE \r\nFIGURE
-
UK DISTRIBUTION TRANSFORMER MARKET ANALYSIS BY POWER RATING \r\nFIGURE
-
UK DISTRIBUTION TRANSFORMER MARKET ANALYSIS BY COOLING METHOD \r\nFIGURE
-
UK DISTRIBUTION TRANSFORMER MARKET ANALYSIS BY END USE \r\nFIGURE
-
UK DISTRIBUTION TRANSFORMER MARKET ANALYSIS BY REGIONAL \r\nFIGURE
-
FRANCE DISTRIBUTION TRANSFORMER MARKET ANALYSIS BY TYPE \r\nFIGURE
-
FRANCE DISTRIBUTION TRANSFORMER MARKET ANALYSIS BY POWER RATING \r\nFIGURE
-
FRANCE DISTRIBUTION TRANSFORMER MARKET ANALYSIS BY COOLING METHOD \r\nFIGURE
-
FRANCE DISTRIBUTION TRANSFORMER MARKET ANALYSIS BY END USE \r\nFIGURE
-
FRANCE DISTRIBUTION TRANSFORMER MARKET ANALYSIS BY REGIONAL \r\nFIGURE
-
RUSSIA DISTRIBUTION TRANSFORMER MARKET ANALYSIS BY TYPE \r\nFIGURE
-
RUSSIA DISTRIBUTION TRANSFORMER MARKET ANALYSIS BY POWER RATING \r\nFIGURE
-
RUSSIA DISTRIBUTION TRANSFORMER MARKET ANALYSIS BY COOLING METHOD \r\nFIGURE
-
RUSSIA DISTRIBUTION TRANSFORMER MARKET ANALYSIS BY END USE \r\nFIGURE
-
RUSSIA DISTRIBUTION TRANSFORMER MARKET ANALYSIS BY REGIONAL \r\nFIGURE
-
ITALY DISTRIBUTION TRANSFORMER MARKET ANALYSIS BY TYPE \r\nFIGURE
-
ITALY DISTRIBUTION TRANSFORMER MARKET ANALYSIS BY POWER RATING \r\nFIGURE
-
ITALY DISTRIBUTION TRANSFORMER MARKET ANALYSIS BY COOLING METHOD \r\nFIGURE
-
ITALY DISTRIBUTION TRANSFORMER MARKET ANALYSIS BY END USE \r\nFIGURE
-
ITALY DISTRIBUTION TRANSFORMER MARKET ANALYSIS BY REGIONAL \r\nFIGURE
-
SPAIN DISTRIBUTION TRANSFORMER MARKET ANALYSIS BY TYPE \r\nFIGURE
-
SPAIN DISTRIBUTION TRANSFORMER MARKET ANALYSIS BY POWER RATING \r\nFIGURE
-
SPAIN DISTRIBUTION TRANSFORMER MARKET ANALYSIS BY COOLING METHOD \r\nFIGURE
-
SPAIN DISTRIBUTION TRANSFORMER MARKET ANALYSIS BY END USE \r\nFIGURE
-
SPAIN DISTRIBUTION TRANSFORMER MARKET ANALYSIS BY REGIONAL \r\nFIGURE
-
REST OF EUROPE DISTRIBUTION TRANSFORMER MARKET ANALYSIS BY TYPE \r\nFIGURE
-
REST OF EUROPE DISTRIBUTION TRANSFORMER MARKET ANALYSIS BY POWER RATING \r\nFIGURE
-
REST OF EUROPE DISTRIBUTION TRANSFORMER MARKET ANALYSIS BY COOLING METHOD \r\nFIGURE
-
REST OF EUROPE DISTRIBUTION TRANSFORMER MARKET ANALYSIS BY END USE \r\nFIGURE
-
REST OF EUROPE DISTRIBUTION TRANSFORMER MARKET ANALYSIS BY REGIONAL \r\nFIGURE
-
APAC DISTRIBUTION TRANSFORMER MARKET ANALYSIS \r\nFIGURE
-
CHINA DISTRIBUTION TRANSFORMER MARKET ANALYSIS BY TYPE \r\nFIGURE
-
CHINA DISTRIBUTION TRANSFORMER MARKET ANALYSIS BY POWER RATING \r\nFIGURE
-
CHINA DISTRIBUTION TRANSFORMER MARKET ANALYSIS BY COOLING METHOD \r\nFIGURE
-
CHINA DISTRIBUTION TRANSFORMER MARKET ANALYSIS BY END USE \r\nFIGURE
-
CHINA DISTRIBUTION TRANSFORMER MARKET ANALYSIS BY REGIONAL \r\nFIGURE
-
INDIA DISTRIBUTION TRANSFORMER MARKET ANALYSIS BY TYPE \r\nFIGURE
-
INDIA DISTRIBUTION TRANSFORMER MARKET ANALYSIS BY POWER RATING \r\nFIGURE
-
INDIA DISTRIBUTION TRANSFORMER MARKET ANALYSIS BY COOLING METHOD \r\nFIGURE
-
INDIA DISTRIBUTION TRANSFORMER MARKET ANALYSIS BY END USE \r\nFIGURE
-
INDIA DISTRIBUTION TRANSFORMER MARKET ANALYSIS BY REGIONAL \r\nFIGURE
-
JAPAN DISTRIBUTION TRANSFORMER MARKET ANALYSIS BY TYPE \r\nFIGURE
-
JAPAN DISTRIBUTION TRANSFORMER MARKET ANALYSIS BY POWER RATING \r\nFIGURE
-
JAPAN DISTRIBUTION TRANSFORMER MARKET ANALYSIS BY COOLING METHOD \r\nFIGURE
-
JAPAN DISTRIBUTION TRANSFORMER MARKET ANALYSIS BY END USE \r\nFIGURE
-
JAPAN DISTRIBUTION TRANSFORMER MARKET ANALYSIS BY REGIONAL \r\nFIGURE
-
SOUTH KOREA DISTRIBUTION TRANSFORMER MARKET ANALYSIS BY TYPE \r\nFIGURE
-
SOUTH KOREA DISTRIBUTION TRANSFORMER MARKET ANALYSIS BY POWER RATING \r\nFIGURE
-
SOUTH KOREA DISTRIBUTION TRANSFORMER MARKET ANALYSIS BY COOLING METHOD \r\nFIGURE
-
SOUTH KOREA DISTRIBUTION TRANSFORMER MARKET ANALYSIS BY END USE \r\nFIGURE
-
SOUTH KOREA DISTRIBUTION TRANSFORMER MARKET ANALYSIS BY REGIONAL \r\nFIGURE
-
MALAYSIA DISTRIBUTION TRANSFORMER MARKET ANALYSIS BY TYPE \r\nFIGURE
-
MALAYSIA DISTRIBUTION TRANSFORMER MARKET ANALYSIS BY POWER RATING \r\nFIGURE
-
MALAYSIA DISTRIBUTION TRANSFORMER MARKET ANALYSIS BY COOLING METHOD \r\nFIGURE
-
MALAYSIA DISTRIBUTION TRANSFORMER MARKET ANALYSIS BY END USE \r\nFIGURE
-
MALAYSIA DISTRIBUTION TRANSFORMER MARKET ANALYSIS BY REGIONAL \r\nFIGURE
-
THAILAND DISTRIBUTION TRANSFORMER MARKET ANALYSIS BY TYPE \r\nFIGURE
-
THAILAND DISTRIBUTION TRANSFORMER MARKET ANALYSIS BY POWER RATING \r\nFIGURE
-
THAILAND DISTRIBUTION TRANSFORMER MARKET ANALYSIS BY COOLING METHOD \r\nFIGURE
-
THAILAND DISTRIBUTION TRANSFORMER MARKET ANALYSIS BY END USE \r\nFIGURE
-
THAILAND DISTRIBUTION TRANSFORMER MARKET ANALYSIS BY REGIONAL \r\nFIGURE
-
INDONESIA DISTRIBUTION TRANSFORMER MARKET ANALYSIS BY TYPE \r\nFIGURE
-
INDONESIA DISTRIBUTION TRANSFORMER MARKET ANALYSIS BY POWER RATING \r\nFIGURE
-
INDONESIA DISTRIBUTION TRANSFORMER MARKET ANALYSIS BY COOLING METHOD \r\nFIGURE
-
INDONESIA DISTRIBUTION TRANSFORMER MARKET ANALYSIS BY END USE \r\nFIGURE
-
INDONESIA DISTRIBUTION TRANSFORMER MARKET ANALYSIS BY REGIONAL \r\nFIGURE
-
REST OF APAC DISTRIBUTION TRANSFORMER MARKET ANALYSIS BY TYPE \r\nFIGURE
-
REST OF APAC DISTRIBUTION TRANSFORMER MARKET ANALYSIS BY POWER RATING \r\nFIGURE
-
REST OF APAC DISTRIBUTION TRANSFORMER MARKET ANALYSIS BY COOLING METHOD \r\nFIGURE
-
REST OF APAC DISTRIBUTION TRANSFORMER MARKET ANALYSIS BY END USE \r\nFIGURE
-
REST OF APAC DISTRIBUTION TRANSFORMER MARKET ANALYSIS BY REGIONAL \r\nFIGURE
-
SOUTH AMERICA DISTRIBUTION TRANSFORMER MARKET ANALYSIS \r\nFIGURE
-
BRAZIL DISTRIBUTION TRANSFORMER MARKET ANALYSIS BY TYPE \r\nFIGURE
-
BRAZIL DISTRIBUTION TRANSFORMER MARKET ANALYSIS BY POWER RATING \r\nFIGURE
-
BRAZIL DISTRIBUTION TRANSFORMER MARKET ANALYSIS BY COOLING METHOD \r\nFIGURE
-
BRAZIL DISTRIBUTION TRANSFORMER MARKET ANALYSIS BY END USE \r\nFIGURE
-
BRAZIL DISTRIBUTION TRANSFORMER MARKET ANALYSIS BY REGIONAL \r\nFIGURE
-
MEXICO DISTRIBUTION TRANSFORMER MARKET ANALYSIS BY TYPE \r\nFIGURE
-
MEXICO DISTRIBUTION TRANSFORMER MARKET ANALYSIS BY POWER RATING \r\nFIGURE
-
MEXICO DISTRIBUTION TRANSFORMER MARKET ANALYSIS BY COOLING METHOD \r\nFIGURE
-
MEXICO DISTRIBUTION TRANSFORMER MARKET ANALYSIS BY END USE \r\nFIGURE
-
MEXICO DISTRIBUTION TRANSFORMER MARKET ANALYSIS BY REGIONAL \r\nFIGURE
-
ARGENTINA DISTRIBUTION TRANSFORMER MARKET ANALYSIS BY TYPE \r\nFIGURE
-
ARGENTINA DISTRIBUTION TRANSFORMER MARKET ANALYSIS BY POWER RATING \r\nFIGURE
-
ARGENTINA DISTRIBUTION TRANSFORMER MARKET ANALYSIS BY COOLING METHOD \r\nFIGURE
-
ARGENTINA DISTRIBUTION TRANSFORMER MARKET ANALYSIS BY END USE \r\nFIGURE
-
ARGENTINA DISTRIBUTION TRANSFORMER MARKET ANALYSIS BY REGIONAL \r\nFIGURE
-
REST OF SOUTH AMERICA DISTRIBUTION TRANSFORMER MARKET ANALYSIS BY TYPE \r\nFIGURE
-
REST OF SOUTH AMERICA DISTRIBUTION TRANSFORMER MARKET ANALYSIS BY POWER RATING \r\nFIGURE
-
REST OF SOUTH AMERICA DISTRIBUTION TRANSFORMER MARKET ANALYSIS BY COOLING METHOD \r\nFIGURE
-
REST OF SOUTH AMERICA DISTRIBUTION TRANSFORMER MARKET ANALYSIS BY END USE \r\nFIGURE
-
REST OF SOUTH AMERICA DISTRIBUTION TRANSFORMER MARKET ANALYSIS BY REGIONAL \r\nFIGURE
-
MEA DISTRIBUTION TRANSFORMER MARKET ANALYSIS \r\nFIGURE
-
GCC COUNTRIES DISTRIBUTION TRANSFORMER MARKET ANALYSIS BY TYPE \r\nFIGURE
-
GCC COUNTRIES DISTRIBUTION TRANSFORMER MARKET ANALYSIS BY POWER RATING \r\nFIGURE
-
GCC COUNTRIES DISTRIBUTION TRANSFORMER MARKET ANALYSIS BY COOLING METHOD \r\nFIGURE
-
GCC COUNTRIES DISTRIBUTION TRANSFORMER MARKET ANALYSIS BY END USE \r\nFIGURE
-
GCC COUNTRIES DISTRIBUTION TRANSFORMER MARKET ANALYSIS BY REGIONAL \r\nFIGURE
-
SOUTH AFRICA DISTRIBUTION TRANSFORMER MARKET ANALYSIS BY TYPE \r\nFIGURE
-
SOUTH AFRICA DISTRIBUTION TRANSFORMER MARKET ANALYSIS BY POWER RATING \r\nFIGURE
-
SOUTH AFRICA DISTRIBUTION TRANSFORMER MARKET ANALYSIS BY COOLING METHOD \r\nFIGURE
-
SOUTH AFRICA DISTRIBUTION TRANSFORMER MARKET ANALYSIS BY END USE \r\nFIGURE
-
SOUTH AFRICA DISTRIBUTION TRANSFORMER MARKET ANALYSIS BY REGIONAL \r\nFIGURE
-
REST OF MEA DISTRIBUTION TRANSFORMER MARKET ANALYSIS BY TYPE \r\nFIGURE
-
REST OF MEA DISTRIBUTION TRANSFORMER MARKET ANALYSIS BY POWER RATING \r\nFIGURE
-
REST OF MEA DISTRIBUTION TRANSFORMER MARKET ANALYSIS BY COOLING METHOD \r\nFIGURE
-
REST OF MEA DISTRIBUTION TRANSFORMER MARKET ANALYSIS BY END USE \r\nFIGURE
-
REST OF MEA DISTRIBUTION TRANSFORMER MARKET ANALYSIS BY REGIONAL \r\nFIGURE
-
KEY BUYING CRITERIA OF DISTRIBUTION TRANSFORMER MARKET \r\nFIGURE
-
RESEARCH PROCESS OF MRFR \r\nFIGURE
-
DRO ANALYSIS OF DISTRIBUTION TRANSFORMER MARKET \r\nFIGURE
-
DRIVERS IMPACT ANALYSIS: DISTRIBUTION TRANSFORMER MARKET \r\nFIGURE
-
RESTRAINTS IMPACT ANALYSIS: DISTRIBUTION TRANSFORMER MARKET \r\nFIGURE
-
SUPPLY / VALUE CHAIN: DISTRIBUTION TRANSFORMER MARKET \r\nFIGURE
-
DISTRIBUTION TRANSFORMER MARKET, BY TYPE, 2025 (% SHARE) \r\nFIGURE
-
DISTRIBUTION TRANSFORMER MARKET, BY TYPE, 2019 TO 2035 (USD Billions) \r\nFIGURE
-
DISTRIBUTION TRANSFORMER MARKET, BY POWER RATING, 2025 (% SHARE) \r\nFIGURE
-
DISTRIBUTION TRANSFORMER MARKET, BY POWER RATING, 2019 TO 2035 (USD Billions) \r\nFIGURE
-
DISTRIBUTION TRANSFORMER MARKET, BY COOLING METHOD, 2025 (% SHARE) \r\nFIGURE
-
DISTRIBUTION TRANSFORMER MARKET, BY COOLING METHOD, 2019 TO 2035 (USD Billions) \r\nFIGURE
-
DISTRIBUTION TRANSFORMER MARKET, BY END USE, 2025 (% SHARE) \r\nFIGURE
-
DISTRIBUTION TRANSFORMER MARKET, BY END USE, 2019 TO 2035 (USD Billions) \r\nFIGURE
-
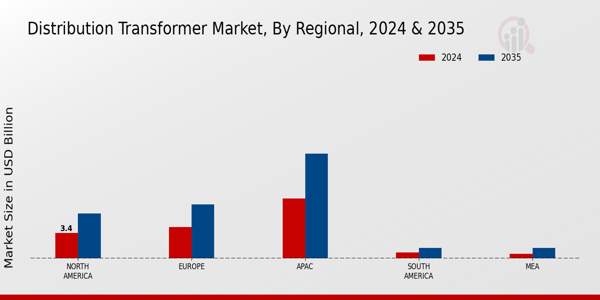
DISTRIBUTION TRANSFORMER MARKET, BY REGIONAL, 2025 (% SHARE) \r\nFIGURE
-
DISTRIBUTION TRANSFORMER MARKET, BY REGIONAL, 2019 TO 2035 (USD Billions) \r\nFIGURE
-
BENCHMARKING OF MAJOR COMPETITORS \r\n


Leave a Comment