2026 Distribution Transformers Market (2025 - 2035)

2026 Distribution Transformers Market Size, Share & Growth Analysis Report By Power Rating (Small, Medium, Large), By Cooling Type (Oil-Cooled, Air-Cooled), By Phase (Three-Phase, Single-Phase), By End-User (Power Utilities, Industrial, Commercial, Residential) and By Regional (North America, Europe, South America, Asia Pacific, Middle East and Africa) – Industry Growth & Forecast to 2035
ID: MRFR/EnP/1941-HCR
140 Pages
Priya Nagrale
Last Updated: July 10, 2026
2026 Distribution Transformers Market
Market Size
Forecast Period2025-2035
CAGR (2025-2035)8.45%
2025 Market SizeUSD 42.59 Billion
2035 Market SizeUSD 95.85 Billion
Key Players
Hitachi Energy
Siemens Energy
Schneider Electric
Eaton Corporation
GE Vernova
TBEA Co.
Opportunities
  • Ester-Fluid and Bio-Based Insulation Platforms
  • Smart Transformer Monitoring and Predictive Analytics
  • Emerging-Market Rural Electrification

Distribution Transformer Market Summary

The Distribution Transformer Market reached an estimated USD 42.59 Billion in 2025 and is projected to grow from USD 46.19 Billion in 2026 to USD 95.85 billion by 2035, registering a CAGR of 8.45% during the forecast period. Accelerated grid modernization programs — driven by aging infrastructure installed between the 1970s and 1990s — alongside the rapid expansion of renewable energy interconnections, are creating sustained demand for new transformer capacity across both developed and emerging economies[2].

A generational technology shift is underway. Utilities and industrial operators are progressively retiring legacy mineral-oil units in favor of ester-fluid and dry-type platforms that meet tightening eco-design regulations in the EU and energy-efficiency mandates from the U.S. Department of Energy [3]. The IEA estimates that global electricity networks require over USD 600 billion in annual investment through 2030 to keep pace with electrification targets, and distribution-level equipment absorbs a meaningful share of that capital [4].

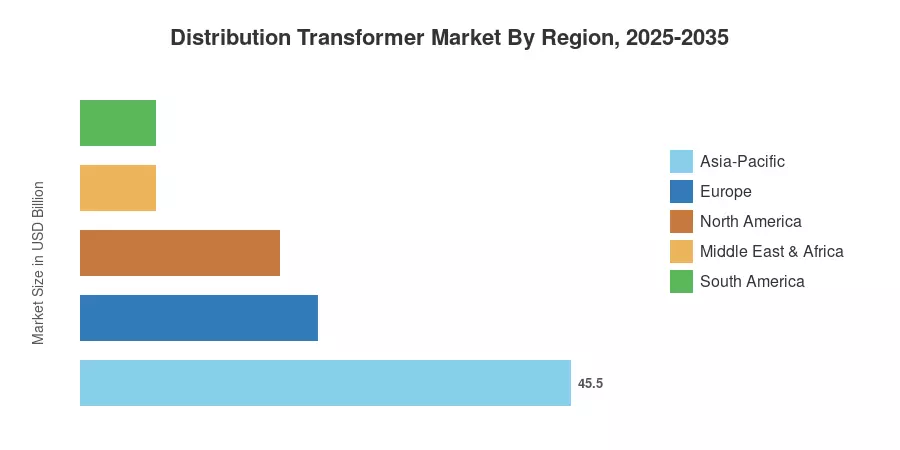
Asia-Pacific commands roughly 45.5% of the Distribution Transformer Market, anchored by large multiyear utility tenders in China and India. Europe holds the second-largest regional share at 22.0%, propelled by grid resilience mandates and offshore wind integration. North America, contributing 18.5%, is the region where data-center load growth and EV-charging corridor buildouts are reshaping neighborhood-level capacity planning most visibly. The Distribution Transformer Market outlook through 2035 remains structurally positive as electrification demand, decarbonization policy, and infrastructure renewal converge globally.


Key Report Takeaways

• By Power Rating

  • Small units (≤ 10 MVA) held a 62.1% revenue share in the Distribution Transformer Market in 2025, reflecting widespread residential and commercial deployment.
  • Medium units (10–100 MVA) are projected to advance at a 9.2% CAGR through 2035, driven by industrial and renewable-interconnection demand.

• By Cooling Type

  • Oil-cooled designs captured 68.5% of 2025 revenue, supported by cost advantages in rural and industrial applications.
  • Air-cooled configurations are forecast to grow at a 9.5% CAGR over 2026–2035 as fire-safety and indoor-installation requirements expand.

• By Phase

  • Three-phase transformers accounted for 76.2% of unit volume in 2025.
  • Single-phase units are expected to register a 9.4% CAGR through 2035, boosted by last-mile rural electrification programs.

• By End-User

  • Power utilities represented 52.1% of Distribution Transformer Market demand in 2025.
  • Residential applications are projected to advance at a 9.7% CAGR to 2035.

• By Region

  • Asia-Pacific captured a 45.5% share of the Distribution Transformer Market in 2025.
  • North America is projected to expand at a 7.9% CAGR through 2035.


Market Size and Forecast (2021–2035)

Market sizing combines bottom-up demand analysis — aggregating utility procurement data, industrial capex disclosures, and regulatory filings — with top-down cross-validation against macroeconomic power-consumption growth models. Historical figures (2021–2024) reflect reported financials and trade data; the 2025 base year is estimated from preliminary shipment volumes; and the 2026–2035 forecast applies the calibrated CAGR alongside scenario-adjusted demand multipliers for EV charging, data centers, and renewable integration[5].
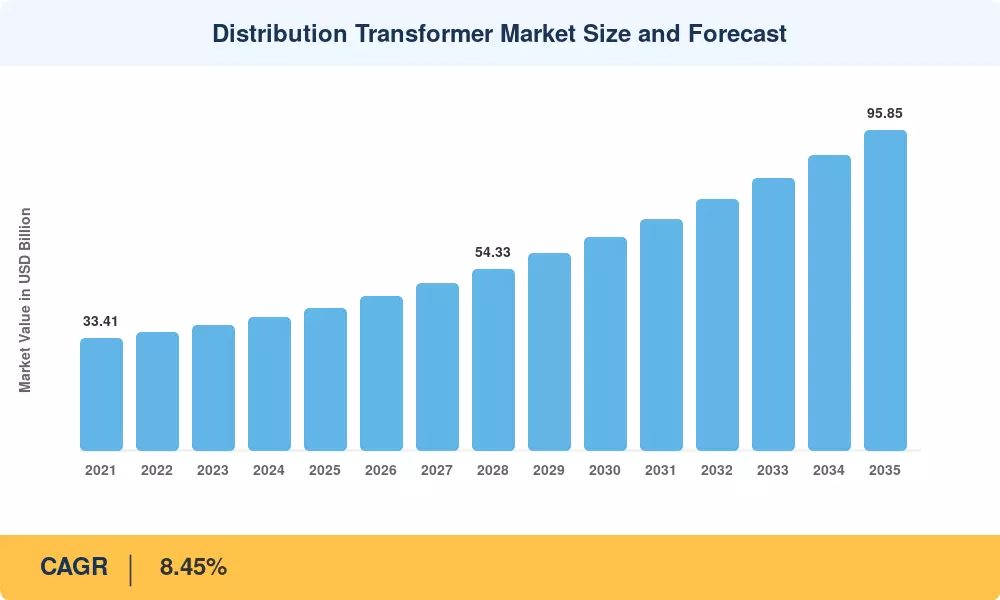
Distribution Transformer Market Size and Forecast
Our Impact
Enabled $4.3B Revenue Impact for Fortune 500 and Leading Multinationals
Partnering with 2000+ Global Organizations Each Year
30K+ Citations by Top-Tier Firms in the Industry

Driver Impact Analysis

Driver ~% Impact on CAGR Geographic Relevance Impact Timeline
Aging grid asset replacement 1.8–2.2 North America, Europe Short-term
Renewable energy interconnection 1.5–1.9 Global Medium-term
Data-center load growth 1.2–1.6 North America, Asia-Pacific Short-term
EV charging corridor expansion 0.9–1.3 North America, Europe Medium-term
Rural electrification programs 0.8–1.1 Asia-Pacific, Africa Long-term
Eco-design and efficiency mandates 0.5–0.8 Europe, North America Medium-term
Urbanization-driven load densification 0.4–0.7 Asia-Pacific, South America Long-term


Aging Grid Asset Replacement

Across North America and Western Europe, a substantial portion of the installed distribution transformer fleet dates from the 1970s through the 1990s. The U.S. DOE estimates that more than 70% of large power transformers and a comparable share of distribution units have exceeded 25 years of service life, pushing failure rates above historical baselines [2]. Utilities such as Duke Energy and National Grid have earmarked multibillion-dollar infrastructure replacement budgets through 2030, and the Distribution Transformer Market directly benefits from this replacement cycle as grid operators prioritize units with lower no-load losses and improved thermal management.

Renewable Energy Interconnection

According to IRENA, the yearly additions to the worldwide renewable pipeline approached 500 GW in 2023, and every solar farm or wind park needs a step-down transformation at the distribution level [4][16]. Because of this connection, the demand for distribution transformers is directly impacted by every percentage point increase in renewable energy-producing capacity. Tens of thousands of new distribution transformers are required for feeder-level voltage management and solar park evacuation in order to meet India's 500 GW non-fossil capacity goal by 2030 alone.


Data-Center Load Growth

Hyperscale and colocation data centers are concentrating megawatt-class loads in suburban and exurban clusters that strain existing distribution networks. BloombergNEF estimates that U.S. data-center electricity consumption could double by 2030, reaching 390 TWh annually [9]. Each campus-scale facility typically requires dedicated pad-mounted distribution transformer banks rated between 2.5 MVA and 10 MVA, linking data-center expansion directly to the Distribution Transformer Market growth trajectory.

EV Charging Corridor Expansion

The U.S. National Electric Vehicle Infrastructure (NEVI) program has allocated USD 7.5 billion to deploy 500,000 public chargers by 2030, each fast-charging station demanding 150–350 kW of dedicated distribution capacity [10]. Comparable programs in the EU (AFIR regulation) and China (NEV infrastructure mandates) multiply this effect globally, creating a sustained tailwind for the Distribution Transformer Market through the forecast period.


Restraints Impact Analysis

Restraint ~% Impact on CAGR Geographic Relevance Impact Timeline
Volatile copper and GOES prices –0.6 to –0.9 Global Short-term
Skilled-labor shortages –0.5 to –0.8 North America, Europe Medium-term
Lead-time elongation –0.4 to –0.7 Global Short-term
Regulatory fragmentation –0.3 to –0.5 Multi-regional Long-term
Grid-interconnection permitting delays –0.2 to –0.4 Europe, North America Medium-term


Volatile Copper and Grain-Oriented Electrical Steel Prices

Grain-oriented electrical steel (GOES) and copper combined make up 40–50% of the bill of materials for a distribution transformer. In 2024, the price of copper exceeded $10,000 per tonne, and the supply of GOES is still concentrated in a few South Korean and Japanese mills [6][18]. In the short term, these fluctuations in input costs slow the growth of the distribution transformer market by compressing manufacturer margins and delaying procurement decisions by cost-sensitive utilities.


Skilled-Labor Shortages

Transformer manufacturing relies on specialized winding technicians and insulation engineers — roles that face acute talent gaps in North America and Europe as an aging workforce retires. The U.S. Bureau of Labor Statistics projects a 12% shortfall in electrical-equipment manufacturing labor through 2030 [17]. Capacity expansion plans by major OEMs are constrained less by capital than by the time required to recruit, train, and certify production staff, creating a ceiling on how quickly the Distribution Transformer Market can respond to surging orders.

Lead-Time Elongation

Average lead times for medium-voltage distribution transformers stretched from 12–16 weeks pre-pandemic to 40–60 weeks by 2024, according to utility procurement surveys [18]. While backlogs have begun to normalize, the persistent order queue forces utilities to front-load purchasing and accept standardized designs rather than custom specifications, potentially compressing pricing power across the Distribution Transformer Market.


Distribution Transformer Market Opportunities

Ester-Fluid and Bio-Based Insulation Platforms

The shift from mineral oil to natural and synthetic ester fluids is being accelerated by stricter fire safety and environmental restrictions. In sensitive areas like hospitals, underground substations, and commercial basements, ester-based transformers are essential due to their greater biodegradability and higher fire points [3][14]. This change creates a premium-priced segment in the distribution transformer market that benefits OEMs that make early expenditures in R&D for alternative fluids.


Smart Transformer Monitoring and Predictive Analytics

Embedding IoT sensors for dissolved-gas analysis, thermal imaging, and load profiling transforms the distribution transformer from a passive asset into a data-generating node. Utilities piloting digital-twin platforms report 15–20% reductions in unplanned outage costs [13]. The convergence of sensing hardware and cloud analytics creates a recurring-revenue opportunity for OEMs willing to bundle monitoring subscriptions alongside hardware sales, expanding the addressable scope of the Distribution Transformer Market.

Emerging-Market Rural Electrification

Sub-Saharan Africa and South Asia together account for over 700 million people without reliable grid access, per World Bank estimates [15]. National electrification programs in Nigeria, Ethiopia, India, and Bangladesh prioritize last-mile distribution infrastructure, where single-phase transformers rated at 25–100 kVA serve as the critical link between medium-voltage feeders and household connections. This demand pocket supports sustained volume growth for the Distribution Transformer Market well into the 2030s.

Modular and Pre-Fabricated Substation Designs

On-site installation time is reduced by 30–40% with modular substations that incorporate distribution transformers, protection relays, and switchgear inside factory-assembled enclosures [12]. The speed-to-energize advantage is valued by mining, renewable energy, and data centre operators. This trend presents a platform-integration opportunity for OEMs that can provide turnkey systems as opposed to standalone components.


Amorphous-Core Adoption in Loss-Sensitive Grids

Amorphous metal cores reduce no-load losses by 60–70% compared with conventional CRGO cores, a benefit that translates into lifetime operating-cost savings exceeding the modest purchase-price premium within 3–5 years [12]. Regulatory incentives in Japan, India, and select U.S. states that reward low-loss equipment through performance-based rate structures are broadening the addressable opportunity for amorphous-core designs within the Distribution Transformer Market.


Distribution Transformer Market Future Outlook

Electrification Supercycle and Load Diversification

The convergence of building electrification, EV adoption, and heat-pump rollouts is restructuring load profiles at the distribution level. The IEA projects that global electricity demand will grow by over 80% through 2050, with distribution networks absorbing the incremental variability [4]. The Distribution Transformer Market stands at the center of this supercycle, as every new demand source — from residential heat pumps to commercial fast chargers — connects through low- and medium-voltage transformation.

Advanced Materials and Loss Reduction

Amorphous-metal cores, high-temperature superconducting windings, and nanocomposite insulation are transitioning from laboratory prototypes to early commercial deployment. Japan's NEDO programs and the U.S. ARPA-E REPAIR initiative have funded next-generation transformer designs targeting 50% reductions in total ownership cost over 30-year asset lives [12][20]. These material advances will gradually reshape competitive positioning in the Distribution Transformer Market, rewarding OEMs that can scale advanced manufacturing processes.

Grid-Edge Digitization and Autonomous Operations

Distribution transformers equipped with embedded sensors, edge-computing modules, and communication gateways are emerging as smart-grid nodes capable of real-time load balancing and fault isolation. EPRI research demonstrates that sensor-equipped transformers can extend asset life by 10–15% through optimized loading decisions [13]. As utility SCADA systems evolve toward distributed architectures, the intelligence embedded in each transformer becomes a competitive differentiator — and a recurring-revenue channel — within the Distribution Transformer Market.

ESG Reporting and Circular-Economy Design

Investor and regulatory pressure on ESG disclosure is driving utilities to evaluate distribution transformers on lifecycle carbon intensity, recyclability, and end-of-life fluid handling. The EU Taxonomy's substantial contribution criteria for electricity networks explicitly reference transformer efficiency classes [3][21]. OEMs that integrate cradle-to-cradle design principles and offer take-back programs for retired units will capture procurement preference from ESG-sensitive grid operators. This evolution expands the value proposition of the Distribution Transformer Market beyond first-cost competition.


Distribution Transformer Market Segmentation

By Power Rating

Segment Key Metric Primary Demand Driver
Small (≤ 10 MVA) 62.1% share (2025) Residential, commercial, solar rooftop
Medium (10–100 MVA) 9.2% CAGR (2026–2035) Industrial parks, renewable plants
Large (> 100 MVA) USD 3.41 Billion (2025) Utility substations, heavy industry


Small-rated distribution transformers below 10 MVA dominate the Distribution Transformer Market because they serve the largest installed base — residential neighborhoods, commercial buildings, and distributed solar installations. Utilities procure these units in high volumes under framework contracts, making manufacturing efficiency and logistics critical competitive factors. Medium-rated units between 10 MVA and 100 MVA represent the fastest-expanding power bracket as solar parks, wind farms, and industrial campuses demand higher-capacity step-down transformation closer to generation points. The large-unit segment above 100 MVA serves niche but high-value applications in heavy industry and primary substations.

By Cooling Type

Segment Key Metric Primary Demand Driver
Oil-Cooled 68.5% share (2025) Cost-competitive rural and industrial use
Air-Cooled 9.5% CAGR (2026–2035) Indoor, fire-sensitive, urban installations


Oil-cooled (liquid-immersed) designs continue to anchor the Distribution Transformer Market due to their established cost structure and proven thermal performance across a wide ratings spectrum. Air-cooled (dry-type) transformers, while carrying a price premium, are gaining share in urban, indoor, and environmentally sensitive installations where fire codes or contamination risks preclude liquid-filled equipment. The shift toward ester-based insulating fluids is blurring this traditional boundary, as ester-filled units offer fire-safety benefits approaching dry-type performance while retaining the thermal efficiency advantages of liquid immersion.

By Phase

Segment Key Metric Primary Demand Driver
Three-Phase 76.2% volume share (2025) Industrial, commercial, utility feeders
Single-Phase 9.4% CAGR (2026–2035) Rural electrification, residential last-mile


Three-phase configurations dominate utility and industrial procurement across the Distribution Transformer Market, as they deliver balanced power for motor loads and large commercial facilities. Single-phase units, prevalent in North American residential networks and rural electrification programs in South Asia and Africa, are growing faster from a smaller base as governments prioritize last-mile connectivity and household-level energy access.

By End-User

Segment Key Metric Primary Demand Driver
Power Utilities 52.1% share (2025) Grid expansion, asset replacement
Industrial 8.7% CAGR (2026–2035) Manufacturing, mining, process industries
Commercial USD 6.39 Billion (2025) Buildings, data centers, retail
Residential 9.7% CAGR (2026–2035) Housing growth, EV home charging


Power utilities remain the anchor buyer in the Distribution Transformer Market, procuring units for grid expansion, voltage regulation, and fleet replacement. Residential end-use is the fastest-growing segment as housing construction in emerging markets and EV home-charging adoption in developed markets drive transformer installations at the neighborhood level.


Regional Market Share Analysis

Region Key Metric Primary Investment Themes
Asia-Pacific 45.5% share (2025) Utility mega-tenders, rural electrification, solar evacuation
Europe 22.0% share (2025) Eco-design compliance, offshore wind integration
North America 18.5% share (2025) Asset replacement, data-center corridors, EV infrastructure
South America 7.0% share (2025) Urban load growth, mining electrification
Middle East & Africa 7.0% share (2025) Grid-access expansion, industrial diversification
Total 100%

The Distribution Transformer Market exhibits distinct regional dynamics shaped by electrification maturity, policy priorities, and industrial composition. Asia-Pacific dominates both by share and growth rate, while North America and Europe drive replacement-cycle and technology-upgrade spending.


North America

Country Key Metric Key Driver
United States 72.4% of regional share Grid replacement, NEVI program
Canada 15.8% of regional share Hydro grid upgrades, mining loads
Mexico 11.8% of regional share Manufacturing corridor electrification


The U.S. accounts for the lion's share of the North American Distribution Transformer Market revenue, buoyed by the Bipartisan Infrastructure Law's USD 65 billion allocation for power infrastructure and the DOE's 2024 efficiency standards for liquid-immersed and dry-type units [2][10]. Canada's demand is anchored by hydro-dominated provincial grids modernizing aging feeder networks, while Mexico benefits from nearshoring-driven industrial load growth along the northern manufacturing belt.

Europe

Country Key Metric Key Driver
Germany 8.6% CAGR (2026–2035) Energiewende, industrial decarbonization
United Kingdom 7.8% CAGR (2026–2035) Offshore wind grid landing points
France USD 2.14 Billion (2025) Nuclear fleet support, EV rollout
Italy 7.5% CAGR (2026–2035) Solar distribution integration
Spain USD 1.28 Billion (2025) Renewable capacity additions
Nordic Countries 8.1% CAGR (2026–2035) Electrification of heating and transport
Russia USD 0.96 Billion (2025) Grid reliability investments
Rest of Europe 7.4% CAGR (2026–2035) EU cohesion fund infrastructure


European demand for distribution transformers is shaped heavily by the EU's Eco-design Directive Lot 2 (Tier 2 effective 2027), which mandates maximum no-load and load losses for new units [3]. Germany's Energiewende creates an acute need for distribution-level capacity at solar and wind connection points, while the UK's offshore wind expansion requires coastal substations with salt-spray-rated equipment. Across the continent, the Distribution Transformer Market benefits from policy certainty around grid investment through the REPowerEU framework.

Asia-Pacific

Country Key Metric Key Driver
China 38.2% of regional share State Grid tenders, renewable integration
India 9.3% CAGR (2026–2035) Revamped Distribution Sector Scheme
Japan USD 2.87 Billion (2025) Amorphous-core fleet replacement
South Korea 7.9% CAGR (2026–2035) Smart-grid modernization
ASEAN 8.8% CAGR (2026–2035) Industrial electrification, urbanization
Rest of Asia-Pacific USD 1.52 Billion (2025) Rural grid extension


China's State Grid Corporation and China Southern Power Grid issue multiyear framework tenders covering hundreds of thousands of distribution transformers annually, making the country the single largest procurement market globally [11]. India's Revamped Distribution Sector Scheme (RDSS), backed by INR 3.04 trillion in central and state funding, targets loss reduction and metering upgrades that require widespread transformer replacement across all states [15]. Japan's early adoption of amorphous-core technology positions it as a quality-benchmark market, while ASEAN economies add transformer demand through rapid urbanization and manufacturing-base expansion. The Distribution Transformer Market in Asia-Pacific is expected to sustain the fastest regional CAGR through 2035.

South America

Country Key Metric Key Driver
Brazil 58.5% of regional share Urban distribution upgrades, agribusiness loads
Argentina 7.2% CAGR (2026–2035) Renewable-energy auctions
Rest of South America USD 0.72 Billion (2025) Mining electrification, grid access


Brazil's concession-based utility model channels investment into distribution upgrades in metropolitan areas struggling with load growth from air conditioning and EV adoption. Argentina's RenovAr auctions for wind and solar capacity pull transformer procurement along with generation buildout. Mining-intensive economies such as Chile and Peru sustain specialized demand for medium-power units in harsh-environment applications, contributing to the regional Distribution Transformer Market outlook.

Middle East & Africa

Country Key Metric Key Driver
Saudi Arabia 28.3% of regional share Vision 2030 megaprojects
UAE 7.6% CAGR (2026–2035) Smart-city infrastructure
South Africa USD 0.58 Billion (2025) Eskom grid rehabilitation
Egypt 8.0% CAGR (2026–2035) New Administrative Capital buildout
Rest of MEA 7.4% CAGR (2026–2035) Rural electrification, industrial zones


Saudi Arabia's NEOM and other Vision 2030 megaprojects require distribution-grade equipment built to extreme-temperature specifications, creating niche procurement opportunities for OEMs with desert-rated product lines. South Africa's Eskom rehabilitation program and Egypt's New Administrative Capital infrastructure drive the Distribution Transformer Market in Africa. Sub-Saharan grid-access initiatives backed by World Bank and AfDB financing add volume demand for cost-optimized single-phase units [15].


Distribution Transformer Market By Region, 2025-2035

Competitive Benchmarking

The Distribution Transformer Market exhibits moderate concentration, with the top five players accounting for an estimated 35–42% of global revenue. The Herfindahl-Hirschman Index falls in the low-to-moderate range, reflecting a competitive field where global OEMs coexist with regional specialists and state-backed manufacturers. Barriers to entry remain significant due to the capital intensity of winding equipment, long qualification cycles with utility buyers, and supply-chain access for grain-oriented electrical steel and insulation paper [6][17].

Company Est. Revenue Share Range Key Offerings for the Distribution Transformer Market Strategic Positioning
Hitachi Energy ~8–11% Oil-immersed, dry-type, ester-filled, digital monitoring Global full-portfolio leader with smart-grid integration
Siemens Energy ~7–10% GEAFOL dry-type, oil-immersed, green transformers European technology leader, eco-design pioneer
Schneider Electric ~5–8% Medium-voltage, pad-mounted, oil-immersed Solutions-integrated approach, strong in the commercial segment
Eaton Corporation ~4–7% Pad-mounted, submersible, specialty liquid-filled North American distribution-utility specialist
GE Vernova ~4–6% Prolec GE range, oil-immersed, amorphous-core Americas-focused, with a Mexico manufacturing hub
TBEA Co. ~4–6% Oil-immersed, dry-type, high-altitude designs Chinese market leader, Belt and Road exporter
CG Power and Industrial Solutions ~3–5% Oil-filled, dry-type, amorphous-core India-centric with a growing export footprint
Toshiba Energy Systems ~3–5% Amorphous-core, oil-immersed, compact designs Japan pioneer in amorphous technology
Hyosung Heavy Industries ~2–4% Oil-filled, gas-insulated, eco-friendly platforms Korean leader expanding into ASEAN markets
WEG S.A. ~2–4% Dry-type, oil-immersed, mining-rated units South American leader with global ambitions


Recent News & Developments


  • Siemens Energy (June 2024): Launched the Green Transformer initiative, committing to 100% ester-fluid insulation across its European distribution portfolio by 2028, aligning with EU Eco-design Tier 2 requirements [3].
  • U.S. Department of Energy (April 2024): Finalized updated energy-conservation standards for liquid-immersed and dry-type distribution transformers, effective January 2027, mandating 10–15% reductions in no-load losses [2].


  • TBEA Co. (November 2023): Won a State Grid Corporation framework contract valued at over USD 500 Million for distribution transformers across seven Chinese provinces through 2026 [11].
  • CG Power (August 2023): Signed a technology licensing agreement with Hitachi Energy to manufacture amorphous-core distribution transformers at its Nashik, India, facility, targeting the Indian government's RDSS program [15].
  • Schneider Electric (May 2023): Acquired a controlling stake in a Malaysian dry-type transformer manufacturer to strengthen ASEAN production capacity for the Distribution Transformer Market [23].


Distribution Transformer Market Report Scope

Parameter Detail
Market Scope Global Distribution Transformer Market by power rating, cooling type, phase, end-user, and geography
Study Period 2021–2035
CAGR (2026–2035) 8.45%
Market Size — 2025 USD 42.59 Billion
Market Size — 2035 USD 95.85 Billion
Fastest Growing Segment Residential end-use (9.7% CAGR)
Companies Profiled 10 (Hitachi Energy, Siemens Energy, Schneider Electric, Eaton, GE Vernova, TBEA, CG Power, Toshiba, Hyosung, WEG)
Valuation Currency USD Billion


FAQs

How do copper-versus-aluminum winding trade-offs affect procurement decisions?
Copper windings deliver superior conductivity and smaller coil sizes, while aluminum reduces material cost by 30–40% at the expense of greater volume. Most utilities default to copper above 1 MVA; below that rating, aluminum offers an acceptable cost-performance balance [6].
What factory acceptance tests should buyers require before shipment?
Buyers should mandate routine tests per IEC 60076 — including turns-ratio, impedance, no-load loss, and applied-voltage insulation checks. Type tests such as lightning-impulse and temperature-rise assessments are advisable for units above 5 MVA [14].
How do ester-fluid transformers compare with dry-type units on total cost of ownership?
Ester-filled units typically cost 10–15% less than equivalent dry-type designs while offering comparable fire-safety ratings (K-class fluids). They also allow higher overload capacity, reducing the need for oversized specifications [14].
What cybersecurity risks do sensor-equipped distribution transformers introduce?
Embedded monitoring gateways create network entry points that require IEC 62351 compliance, encrypted firmware updates, and segmented operational-technology networks. Utilities should include cybersecurity audit clauses in procurement contracts [13].
How are lead-time bottlenecks best managed in the current supply environment?
Procurers should consider multiyear blanket purchase orders, dual-sourcing across geographies, and acceptance of standardized designs over custom specifications to reduce queue times from 50+ weeks toward 20–30 weeks [18].
Which loss-evaluation formula yields the best lifecycle cost comparison?
The total-owning-cost (TOC) formula — purchase price plus capitalized no-load and load losses over the asset's expected life — is the industry standard. Loss-evaluation factors vary by utility but typically range from USD 4–9 per watt of no-load loss [2][12].
What role do distribution transformers play in microgrid architectures?
In islanded or grid-tied microgrids, distribution transformers manage voltage regulation between generation sources, battery storage, and local loads. Bidirectional power flow and variable renewable input require units rated for reverse-power and harmonic-rich operation [13].    
Author
Author
Author Profile
Priya Nagrale LinkedIn
Senior Research Analyst
With an experience of over five years in market research industry (Chemicals & Materials domain), I gather and analyze market data from diverse sources to produce results, which are then presented back to a client. Also, provide recommendations based on the findings. As a Senior Research Analyst, I perform quality checks (QC) for market estimations, QC for reports, and handle queries and work extensively on client customizations. Also, handle the responsibilities of client proposals, report planning, report finalization, and execution

Research Approach


Secondary Research

The secondary research process involved comprehensive analysis of regulatory databases, technical standards repositories, peer-reviewed engineering journals, and authoritative energy sector publications. Key sources included the US Department of Energy (DOE) Office of Electricity, Energy Information Administration (EIA), National Institute of Standards and Technology (NIST), International Electrotechnical Commission (IEC) standards database, Institute of Electrical and Electronics Engineers (IEEE) Xplore Digital Library, CIGRE (International Council on Large Electric Systems) technical brochures, International Energy Agency (IEA) World Energy Outlook, European Network of Transmission System Operators for Electricity (ENTSO-E), US Federal Energy Regulatory Commission (FERC), National Electrical Manufacturers Association (NEMA), Association of Edison Illuminating Companies (AEIC), Electric Power Research Institute (EPRI), and national utility regulatory commission reports from key markets. These sources were used to collect installation statistics, grid modernization expenditure data, technical efficiency studies, regulatory compliance frameworks, and market landscape analysis for oil-filled immersed transformers, dry-type cast resin units, and vacuum pressure impregnated technologies across <10 MVA, 10-25 MVA, 25-50 MVA, and >50 MVA power ratings.


Primary Research

To gather both qualitative and quantitative insights, supply-side and demand-side stakeholders were interviewed during the primary research phase. CEOs, VPs of engineering, product line directors, and regional sales heads from distribution transformer OEMs and component suppliers (such as insulation material suppliers, core steel suppliers, and bushing manufacturers) were examples of supply-side sources. Demand-side sources included independent power producers, commercial real estate developers, industrial facility operators, EPC contractors with substation infrastructure expertise, chief engineers, grid planning directors, procurement managers, and asset management executives from electric utilities. Primary research confirmed smart grid integration timelines, validated market segmentation across natural air, forced air, and water cooling methodologies, and collected information on utility capital expenditure cycles, oil-type versus dry-type transition dynamics, and adoption patterns of copper versus aluminum windings.

Primary Respondent Breakdown:

By Designation: C-level Primaries (32%), Director Level (30%), Others (38%)

By Region: North America (32%), Europe (30%), Asia-Pacific (28%), Rest of World (10%)


Market Size Estimation

Global market valuation was derived through revenue mapping and installation volume analysis. The methodology included:

Identification of 45+ key manufacturers across North America, Europe, Asia-Pacific, Latin America, and Middle East & Africa

Product mapping across oil-filled (mineral oil/silicone/ester), dry-type (cast resin/vacuum pressure impregnated), and vacuum chamber technologies

Capacity analysis across <10 MVA, 10-25 MVA, 25-50 MVA, and >50 MVA power rating segments

Analysis of reported and modeled annual revenues specific to distribution transformer portfolios, including aftermarket services and digital monitoring solutions

Coverage of manufacturers representing 70-75% of global market share in 2024

Extrapolation using bottom-up (installation units × average selling price by country, segmented by cooling method and end-use application) and top-down (manufacturer revenue validation against utility T&D capital expenditure reports) approaches to derive segment-specific valuations for industrial, commercial, residential, and utility verticals

Download Free Sample

Kindly complete the form below to receive a free sample of this Report

Download PDF ×

We do not share your information with anyone. However, we may send you emails based on your report interest from time to time. You may contact us at any time to opt-out.
















