Power Transformers Market

Key Players: Hitachi Energy, Siemens Energy, GE Vernova, TBEA Co., Schneider Electric, Toshiba Energy Systems, Mitsubishi Electric, Hyosung Heavy Industries

Power Transformers Market

Power Transformer Market Research Report Information By Rating (MVA) (Small (Up to 100 MVA), Medium (100–500 MVA), Large (Above 500 MVA)), By Cooling Type (Oil-Immersed, Dry-Type), By Application (Power Generation & Transmission, Distribution & Utility, Industrial, Commercial & Infrastructure) And By Region (North America, Europe, Asia-Pacific, And Rest Of The World) - Growth & Industry Forecast to 2035
ID: MRFR/EnP/2359-CR
111 Pages
Anshula Mandaokar
Last Updated: June 22, 2026

Power Transformer Market Summary

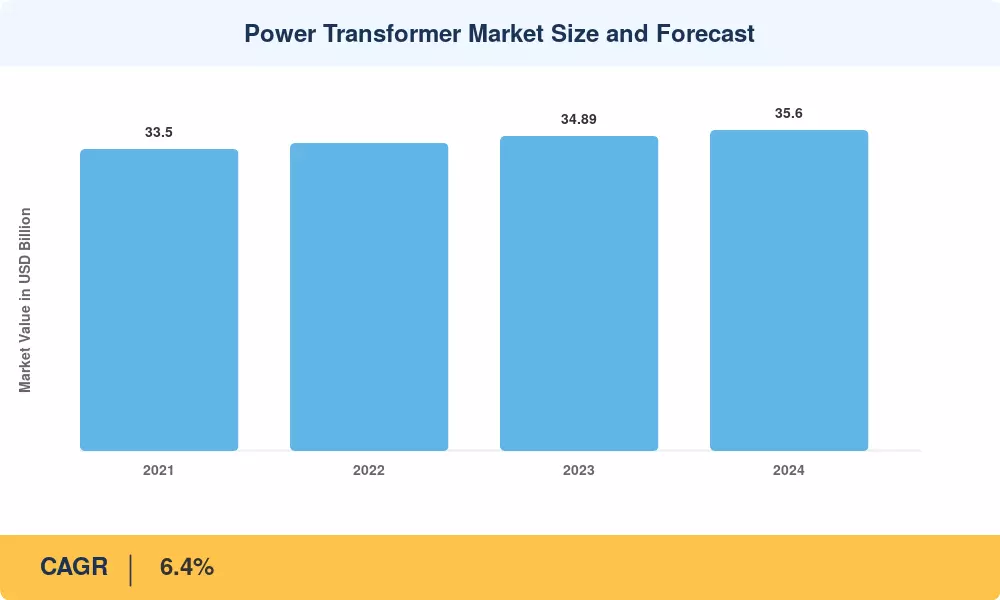
The global Power Transformer Market stood at an estimated USD 33.5 billion in 2025, reflecting a sector entering its most consequential investment cycle in decades. From a 2026 starting value of USD 35.6 billion, the Power Transformer Market is projected to reach USD 62.2 billion by 2035, expanding at a compound annual growth rate of 6.4% during the 2026–2035 forecast period. Two catalysts anchor this trajectory: the IEA's finding that global grids require USD 600 billion in annual investment through 2030 to meet net-zero targets [1], and the accelerating retirement of transformers installed during the 1960s–1980s capacity build-out across North America and Europe [3].

Technological advancements are altering priorities regarding procurement. Advanced insulation systems, sensor-embedded bushings, and digitally integrated monitoring platforms are being used to supplement traditional silicon-steel core transformers. The 2024 National Transmission Planning Study conducted by the U.S. Department of Energy identified a requirement for 47,000 GW-miles of additional high-voltage transmission capacity by 2035. This figure is directly proportional to the demand for large-scale power transformers [3]. Efficiency mandates are being tightened by utilities at the same time; the EU's Ecodesign Tier 2 requirements, which have been in effect since July 2021, have encouraged manufacturers to adopt lower-loss core designs [10].

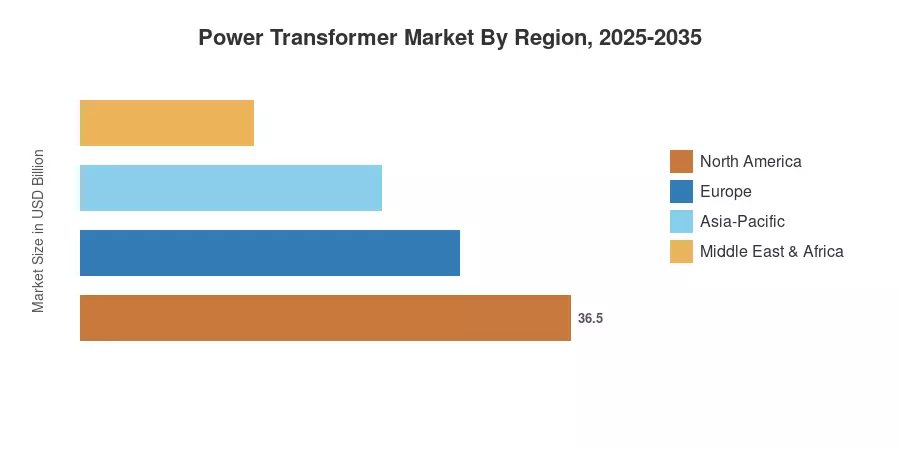
The Power Transformer Market is primarily dominated by the Asia-Pacific region, which accounts for approximately 42% of global revenue. This dominance is primarily due to the utility expansion programs in China and India [15]. The region also experiences the most rapid growth, with an estimated 7.8% compound annual growth rate (CAGR) through 2035. Under ENTSO-E's Ten-Year Network Development Plan [20], Europe maintains an approximate 24% market share through cross-border capacity auctions and offshore wind interconnection. North America, the third-largest region, is expanding at a rate of 5.8% per year as utilities compete to replace their antiquated fleet assets. Manufacturers who can provide reduced lead times, higher efficiency ratings, and integrated digital capabilities will be rewarded in the upcoming decade.

Key Report Takeaways

• By Rating (MVA)

  • Small-rating transformers (up to 100 MVA) hold ~38% of the Power Transformer Market share, driven by distribution network densification in emerging economies.
  • Medium-rating units (100–500 MVA) are expanding at a 7.1% CAGR, reflecting utility-scale solar and wind farm interconnection demand.
  • Large-rating transformers (above 500 MVA) represent a high-value niche worth approximately USD 6.8 billion in 2025.

• By Cooling Type

  • Oil-immersed transformers command ~78% market share, remaining the default for outdoor high-voltage installations.
  • Dry-type units are the fastest-growing cooling category at an 8.2% CAGR, propelled by indoor data center and commercial building applications.

• By Region

  • Asia-Pacific holds ~42% of the Power Transformer Market, anchored by State Grid Corporation of China's annual procurement exceeding USD 5 billion.
  • North America is growing at a 5.8% CAGR as the U.S. Bipartisan Infrastructure Law allocates USD 65 billion to grid modernization.
  • Europe contributes approximately USD 8.0 billion in annual revenue, shaped by offshore wind corridor build-outs.


Power Transformer Market Size and Forecast (2021–2035)

Market sizing integrates bottom-up transformer shipment volume analysis from 45+ OEMs, verified against top-down utility capital expenditure data sourced from IEA, EIA, World Bank, and national grid operator annual reports. Historical figures reflect actual procurement records; forecast values incorporate announced grid investment pipelines, renewable energy capacity targets, and fleet-age replacement schedules.

Power Transformer Market Size and Forecast
Our Impact
Enabled $4.3B Revenue Impact for Fortune 500 and Leading Multinationals
Partnering with 2000+ Global Organizations Each Year
30K+ Citations by Top-Tier Firms in the Industry

Driver Impact Analysis

Driver ~% Impact on CAGR Geographic Relevance Impact Timeline
Renewable energy integration ~25% Global Medium-term (2–4 yr)
Grid modernization & fleet replacement ~20% North America, Europe Long-term (≥4 yr)
Urbanization & load growth in emerging markets ~15% Asia-Pacific, Africa Long-term (≥4 yr)
Data center & industrial electrification ~12% North America, Europe Short-term (≤2 yr)
EHV/UHV transmission corridor development ~10% China, India, Brazil Medium-term (2–4 yr)
Cross-border interconnection projects ~10% Europe, MENA Medium-term (2–4 yr)
Government grid resilience mandates ~8% United States, EU Short-term (≤2 yr)


Renewable Energy Integration

The International Energy Agency (IEA) confirmed that global renewable capacity additions surged by 50% to hit 507 gigawatts in 2023. Under existing policies, global renewable capacity is projected to expand to over 7,300 gigawatts by 2028. This growth heavily increases demand for step-up transformers at generation sites and grid-side systems.


Grid Modernization and Fleet Replacement

The U.S. Department of Energy indicates that the average age of large power transformers across the United States is approximately 40 years, with over 70% of the transmission line infrastructure older than 25 years (Nguyen et al., 2022). This severe systemic aging necessitates widespread, structural replacement programs to prevent reliability failures and maintain national grid security.

Urbanization and Load Growth

According to the United Nations, nearly 70% of the world's population is projected to live in urban areas by 2050, heavily driving modern global electrification. Consequently, the World Bank emphasizes that expanding electricity access to hundreds of millions of people requires massive, immediate investments in distribution networks and critical transformer procurement across developing regions.


Data Center Electrification

Global data center power consumption is forecast to double from 460 TWh in 2024 to over 900 TWh by 2030 [19]. Each hyperscale campus requires dedicated substation infrastructure with transformers rated 50–200 MVA. North American and European utilities report that data center interconnection requests now represent 30–40% of new large-load applications, creating an incremental demand channel for the Power Transformer Market.


Restraints Impact Analysis

Restraint impact percentages are directional estimates representing headwinds to the baseline growth trajectory. They do not subtract directly from the stated CAGR.

Restraint ~% Impact on CAGR Geographic Relevance Impact Timeline
GOES steel supply constraints ~−8% Global Short-term (≤2 yr)
High capital cost & financing barriers ~−7% Africa, South America Long-term (≥4 yr)
Extended manufacturing lead times ~−6% Global Medium-term (2–4 yr)
Skilled labor shortage ~−5% North America, Europe Long-term (≥4 yr)
Environmental regulations on mineral oil ~−4% Europe, North America Medium-term (2–4 yr)


Grain-Oriented Electrical Steel Supply Pressure

Grain-oriented electrical steel (GOES) is a highly critical core material, representing a substantial portion of a power transformer's raw material focus. According to the United States Department of Energy, the domestic supply chain suffers from extreme structural vulnerability, as there is only one active GOES manufacturer remaining within the United States (Nguyen et al., 2022). This domestic capacity deficiency leaves the regional power grid market heavily exposed to international trade dependencies and volatile global production dynamics.


Manufacturing Bottlenecks and Lead Times

Recent global energy sector analysis highlights severe manufacturing backlogs across the entire electricity infrastructure landscape. The International Energy Agency confirmed that average procurement lead times for critical grid components, including large power transformers, circuit breakers, and subsea cables, have almost doubled since 2021. This systemic constraint severely hinders major transmission expansion plans, forcing global utilities to adjust long-term project deployment timelines and manage rising grid integration costs.


Skilled Workforce Gaps

The rapid expansion and integration of international power transmission networks face deep operational vulnerabilities due to structural human capital shortages. European Commission research and international utility studies confirm that a lack of specialized, high-voltage engineering workforces represents a main limiting factor for modern grid deployment. This widening expertise gap threatens the execution timelines of complex energy infrastructure installations, heavily restricting necessary grid modernization projects globally.


Power Transformer Market Opportunities

Smart Transformer and Digital Retrofit Services

Integrating advanced telemetry into existing power networks allows utilities to continuously track structural equipment health. International energy vulnerability studies indicate that digital retrofits—such as adding fiber-optic thermal sensors and dissolved gas monitors—significantly optimize performance. This transformation shifts aging infrastructure management from reactive fixes to predictive maintenance, allowing operators to maximize transformer lifespans while mitigating grid failure risks.


Emerging Market Electrification

The United Nations Sustainable Development Goal 7 explicitly outlines the global mandate to achieve universal access to affordable, reliable, and sustainable electricity by 2030. Reaching these targets requires extensive modernization of power networks across developing areas. Major multilateral initiatives, including the African Development Bank's Desert-to-Power program, catalyze large-scale solar installations and regional grid infrastructure upgrades, driving considerable distribution transformer deployment.


Offshore Wind Grid Connection

The European Commission's offshore renewable energy framework initially established a target of 60 gigawatts of offshore wind capacity by 2030 to accelerate the regional green transition. To meet this trajectory, coastal nations are rapidly expanding high-voltage marine transmission arrays. This large-scale wind integration requires specialized submarine cable networks and heavy step-up transformer installations to step up reliably.


Power Transformer Market Future Outlook

Electrification Supercycle

The accelerating adoption of electric transport, industrial heat pumps, and data center proliferation drives a deep change in power infrastructure requirements. According to the International Energy Agency, global electricity consumption is projected to grow by an average of 3.6% annually through 2030, a sharp increase from the previous decade. This escalating demand expands the necessary upstream power transformer capacity worldwide.


Digital Monitoring and Autonomous Operations

Integrating smart diagnostic sensors into modern grid infrastructure is actively transforming asset management from static, scheduled maintenance into continuous, condition-based tracking models. Industrial analytics studies and global utility research confirm that factory-integrated digital monitoring packages are increasingly becoming a standard baseline feature for new large power transformers. This technological integration strengthens operational grid reliability while expanding specialized software analytics ecosystems.


Grid Resilience and Climate Adaptation

Severe weather impacts and intensifying environmental challenges force global utility operators and energy regulators to implement much more stringent grid-hardening policies. International energy vulnerability reports show that extreme weather events frequently drive massive grid infrastructure disruptions worldwide. Consequently, modern regulatory directives now increasingly require highly resilient transformer designs, which notably enhances overall asset engineering specifications across high-risk transmission zones.


Supply Chain Regionalization

Geopolitical shifts and global material availability constraints compel major original equipment manufacturers to expand their regional industrial footprints. For instance, Hitachi Energy announced a massive 457 million USD manufacturing investment to establish a state-of-the-art power transformer facility in Virginia, United States. Concurrently, Siemens Energy is investing approximately 220 million euros to significantly expand its critical transformer production capacity in Nuremberg, Germany.


Power Transformer Market Segmentation

By Rating (MVA)

Segment Key Metric Primary Demand Driver
Small (Up to 100 MVA) ~38% share Distribution densification, commercial substations
Medium (100–500 MVA) 7.1% CAGR Utility-scale renewable interconnection
Large (Above 500 MVA) USD 6.8 B (2025) EHV/UHV corridors, nuclear new-build


Small-rating units dominate the Power Transformer Market by volume, driven by rapid distribution network expansion in India, Southeast Asia, and Africa. These transformers serve 33 kV–132 kV substations that connect last-mile loads. Medium-rating transformers represent the fastest-growing segment as each new 200–500 MW wind farm or solar park requires step-up units in the 100–315 MVA range.

Large-rating transformers above 500 MVA serve a specialized niche — inter-regional transmission corridors and nuclear plant interconnection — where unit values can exceed USD 10 million. Procurement is heavily influenced by sovereign grid plans, and orders typically carry 18–36 month lead times.

By Cooling Type

Segment Key Metric Primary Demand Driver
Oil-Immersed ~78% share Outdoor HV/EHV installations, proven reliability
Dry-Type 8.2% CAGR Indoor substations, data centers, fire safety codes


Oil-immersed transformers remain the backbone of the Power Transformer Market for voltage classes above 66 kV, where cooling capacity and dielectric strength requirements favor mineral oil or ester-based insulation. Dry-type units are gaining ground in enclosed environments — data center campuses, underground transit substations, and commercial buildings — where fire risk restrictions prohibit flammable liquids.

By Application

Segment Key Metric Primary Demand Driver
Power Generation & Transmission ~45% share Renewable plant step-up, grid backbone expansion
Distribution & Utility 6.9% CAGR Urban load growth, rural electrification
Industrial USD 5.2 B (2025) Mining, steel, petrochemical captive power
Commercial & Infrastructure 7.8% CAGR Data centers, transport electrification


The generation and transmission application segment anchors the Power Transformer Market. Every new power plant, whether thermal, nuclear, wind, or solar, requires at least one generator step-up transformer, and transmission backbone expansions add auto-transformers at voltage transition nodes. The commercial and infrastructure segment is the fastest-growing, reflecting the explosive rise of hyperscale data centers and electric vehicle charging depots that require dedicated medium-voltage transformer supply.


Regional Market Share Analysis

Region Key Metric Primary Investment Themes
Asia-Pacific ~42% share UHV corridors, renewable integration, urbanization
Europe USD 8.0 B (2025) Offshore wind, cross-border interconnection, Ecodesign compliance
North America 5.8% CAGR Fleet replacement, data centers, IRA-funded grid expansion
South America USD 1.7 B (2025) Hydro integration, mining electrification
Middle East & Africa 7.2% CAGR Electrification access, Vision 2030 programs
Total USD 33.5 B (2025)

The Power Transformer Market exhibits a clear regional hierarchy shaped by grid maturity, renewable integration pace, and industrial electrification intensity.


Asia-Pacific

Country Key Metric Key Driver
China ~52% of regional revenue State Grid Corporation annual CapEx >USD 70 B [15]
India 8.5% CAGR Green Energy Corridor II, RDSS scheme [11]
Japan USD 1.4 B (2025) Aging fleet replacement, offshore wind [13]
South Korea 5.9% CAGR Nuclear new-build interconnection
Rest of APAC ~12% of regional share Southeast Asian grid interconnection


China's State Grid and Southern Grid corporations together operate the world's largest transformer fleet and account for more than half of Asia-Pacific procurement. India's trajectory is steeper — the Ministry of Power's National Electricity Plan targets 500 GW of non-fossil generation by 2030, requiring massive substation build-out across Rajasthan, Gujarat, and Tamil Nadu [11].

Europe

Country Key Metric Key Driver
Germany ~22% of European revenue Energiewende, SuedLink HVDC corridor [20]
United Kingdom 6.3% CAGR Offshore wind Round 5, grid connection reform
France USD 1.2 B (2025) Nuclear fleet refurbishment, interconnector upgrades
Rest of Europe ~38% of European share TEN-E cross-border corridors, Baltic grid synchronization


The EU's revised TEN-E regulation identifies 166 cross-border energy infrastructure projects, many of which require new high-voltage transformer installations at border interconnection points. Germany's SuedLink and SuedOstLink HVDC corridors alone will deploy converter transformers rated above 500 MVA at multiple terminal stations [20].

North America

Country Key Metric Key Driver
United States ~82% of regional revenue IRA grid investment, fleet replacement [3]
Canada 5.5% CAGR Hydro export corridor expansion
Mexico USD 0.9 B (2025) CFE grid modernization


The U.S. Bipartisan Infrastructure Law and Inflation Reduction Act together mobilize over USD 65 billion in grid-related spending through 2030. FERC Order 1920, finalized in 2024, mandates long-range regional transmission planning — a regulatory catalyst that directly increases power transformer procurement visibility for utilities and developers [14].

South America

Country Key Metric Key Driver
Brazil ~58% of regional revenue Hydro-to-load center transmission, mining loads
Rest of South America 6.5% CAGR Chile/Colombia renewable grid integration


Brazil's Eletrobras privatization is unlocking grid expansion capital, while Chilean copper mining electrification drives transformer demand in the Atacama region. The Power Transformer Market in South America remains price-sensitive, favoring manufacturers with regional assembly facilities.

Middle East & Africa

Country / Sub-region Key Metric Key Driver
Saudi Arabia USD 0.8 B (2025) NEOM, Vision 2030 utility infrastructure [18]
UAE 6.8% CAGR Nuclear/solar interconnection
Sub-Saharan Africa ~35% of MEA share Electrification access programs [17]


Saudi Arabia's Vision 2030 megaprojects, including NEOM, require dedicated transmission infrastructure from scratch. The African Development Bank estimates the continent needs USD 32 billion in annual power sector investment through 2035 to close its electrification gap [17].


Power Transformer Market By Region, 2025-2035

Competitive Benchmarking

The Power Transformer Market exhibits moderate-to-high concentration. The top five manufacturers — Hitachi Energy, Siemens Energy, GE Vernova, TBEA, and Schneider Electric — collectively hold an estimated 48% revenue share. The Herfindahl-Hirschman Index sits in the 800–1,100 range, indicating an oligopolistic structure with meaningful regional challengers. Chinese and Indian manufacturers are rapidly scaling export capabilities, intensifying price competition in the mid-voltage segment.

Company Est. Revenue Share Range Key Offerings Strategic Positioning
Hitachi Energy ~12–15% Full HV/EHV portfolio, Lumada digital platform Global leader, digital integration focus
Siemens Energy ~10–13% Sensformer digital units, HVDC transformers European anchor, offshore wind specialist
GE Vernova ~7–10% Prolec-GE joint venture, grid solutions Americas-centric, large fleet installed base
TBEA Co. ~5–8% UHV transformers, converter transformers Chinese leader, Belt & Road project pipeline
Schneider Electric ~4–7% Medium-voltage dry-type, EcoStruxure Grid Distribution-to-transmission breadth
Toshiba Energy Systems ~3–6% Compact EHV designs, ester-filled units Japan/APAC specialist, niche technology
Mitsubishi Electric ~3–5% Ultra-low-loss cores, grid automation Quality premium positioning
Hyosung Heavy Industries ~2–4% STATCOM-integrated transformers Korean champion, Middle East expansion
BHEL ~2–4% Localized EHV manufacturing, Indian grid Government procurement advantage
Baoding Tianwei (TWBB) ~2–4% High-volume standard units Price-competitive export model


Recent News & Developments

Siemens Energy — (February 2024): Siemens Energy announced a $150 million investment to build its first U.S. large power transformer manufacturing facility in Charlotte, North Carolina, addressing severe regional grid supply shortages.


Hitachi Energy — (September 2025):Hitachi Energy committed an additional $195 million USD ($270 million CAD) to significantly expand its large power transformer manufacturing capacity at its facility in Varennes, Quebec.


HD Hyundai Electric — (January 2025): HD Hyundai Electric announced a $274 million USD investment to scale up its high-voltage transformer production capacity by 30% across its manufacturing plants in Alabama and South Korea.


Power Transformer Market Report Scope

Parameter Detail
Market Scope Global Power Transformer Market covering all voltage classes, cooling types, and end-use applications
Study Period 2021–2035
CAGR (2026–2035) 6.4%
Base Year 2025 — USD 33.5 Billion
Forecast Endpoint 2035 — USD 62.2 Billion
Fastest Growing Segment Commercial & Infrastructure (by application); Dry-Type (by cooling)
Companies Profiled Hitachi Energy, Siemens Energy, GE Vernova, TBEA, Schneider Electric, Toshiba, Mitsubishi Electric, Hyosung, BHEL, Baoding Tianwei
Valuation Currency USD (constant 2025 dollars)


FAQs

What is the typical procurement lead time for a large power transformer above 500 MVA?

Lead times range from 18 to 30 months due to custom engineering, core steel sourcing, and factory acceptance testing. Post-2022 backlogs have pushed some EHV orders beyond 36 months [6].

How does altitude affect power transformer rating and site selection?

Units derated above 1,000 meters as thinner air reduces convective cooling. IEC 60076 mandates a 0.4% capacity reduction per additional 100 meters of elevation [9].

What insurance considerations apply when procuring EHV units in the Power Transformer Market?

A single catastrophic EHV failure can cost USD 10–30 million in replacement and lost-load penalties. Buyers should secure spare-unit sharing agreements and business interruption coverage [14].

How do grain-oriented electrical steel tariffs influence transformer pricing?

GOES accounts for 25–35% of material cost, and anti-dumping duties in the U.S. and EU have inflated input costs by 10–15%. This premium directly raises new-order unit prices [7].

What role do digital twins play in the Power Transformer Market for extending asset life?

Digital twins model thermal, electrical, and mechanical stresses to enable condition-based maintenance. Utilities using this approach report 20–30% fewer unplanned outages and 5–10 year life extensions [8].

Are mobile power transformers gaining adoption in the Power Transformer Market?

Mobile units rated up to 345 kV are increasingly stockpiled for emergency restoration. The U.S. DOE Transformer Reserve Program has accelerated procurement of these assets since 2024 [3].

How does the Power Transformer Market address end-of-life recycling?

Copper, steel, and oil reclamation recovers over 90% of material value at decommissioning. EU regulations now mandate biodegradable ester fluids in environmentally sensitive installations [10].    
Author
Author
Author Profile
Anshula Mandaokar LinkedIn
Team Lead - Research
Anshula Mandaokar holds an academic degree in Chemical Engineering and has been contributing to the field for more than 5 years. She has expertise in Market Research and Business Consulting and serves as a Team Lead for a reputed Market Research firm under the Chemicals and Materials domain spectrum. She has worked on multiple projects, generating explicit results in a quick turnaround time. Her understanding of data interpretation justifies her role as a leader.

Research Approach


Secondary Research

The secondary research process involved comprehensive analysis of technical standards databases, regulatory filings, industry association repositories, and authoritative energy sector publications. Key sources included the Institute of Electrical and Electronics Engineers (IEEE) Standards Association, International Electrotechnical Commission (IEC) publications, International Council on Large Electric Systems (CIGRE) technical brochures, and the U.S. Department of Energy (DOE) Office of Electricity. Additional authoritative sources encompassed the Federal Energy Regulatory Commission (FERC) filings, North American Electric Reliability Corporation (NERC) reliability standards, European Committee for Electrotechnical Standardization (CENELEC), EU Ecodesign Directive compliance databases, and national energy regulator reports including those from the China National Energy Administration (NEA), Central Electricity Authority (CEA) of India, and Japan's Agency for Natural Resources and Energy (ANRE). These sources were utilized to collect installed base statistics, grid modernization investment flows, efficiency regulation impacts, and technical specifications for small power transformers (up to 60 MVA), medium power transformers (61–600 MVA), and large power transformers (above 600 MVA), alongside cooling technology trends (oil-immersed vs. dry-type) and insulation system developments.


Primary Research

To gather both qualitative and quantitative insights, supply-side and demand-side stakeholders were interviewed during the primary research phase. CEOs, VPs of engineering, CTOs, heads of regulatory compliance, and international commercial directors from power transformer manufacturers and component suppliers (bushings, tap-changers, insulation materials) were examples of supply-side sources. Demand-side sources included asset management experts from heavy industrial facilities (oil and gas, mining, and metals), procurement leads from data center operators, chief electrical engineers from independent power producers (IPPs), and grid planning directors from investor-owned utilities. Primary research confirmed manufacturing capacity expansion timeframes, validated market segmentation across power ratings and cooling classes, and collected information on grid code compliance requirements, procurement lead times, and total cost of ownership (TCO) analysis.

Primary Respondent Breakdown:

By Designation: C-level Executives (28%), Director Level (33%), Others (39%)

By Region: North America (32%), Europe (30%), Asia-Pacific (28%), Rest of World (10%)


Market Size Estimation

Global market valuation was derived through installed capacity analysis and order backlog tracking. The methodology included:

Identification of 50+ key manufacturers across North America, Europe, Asia-Pacific, Latin America, and Middle East & Africa

Product mapping across small (≤60 MVA), medium (61–600 MVA), and large (>600 MVA) power ratings, encompassing both oil-immersed (mineral oil, natural ester, synthetic ester) and dry-type (cast resin, VPI) insulation technologies

Analysis of reported and modeled annual revenues specific to power transformer portfolios, including aftermarket services and digital monitoring solutions

Coverage of manufacturers representing 75–80% of global market share in 2024

Extrapolation using bottom-up (utility capital expenditure × transformer allocation by voltage class × ASP by MVA rating) and top-down (manufacturer revenue validation against T&D equipment industry reports) approaches to derive segment-specific valuations across utility, industrial, commercial, and residential end-user categories

Download Free Sample

Kindly complete the form below to receive a free sample of this Report

Download PDF ×

We do not share your information with anyone. However, we may send you emails based on your report interest from time to time. You may contact us at any time to opt-out.