Segmentation Quick Reference
| Dimension | Sub-Segments | Dominant Segment | Fastest Growing Segment |
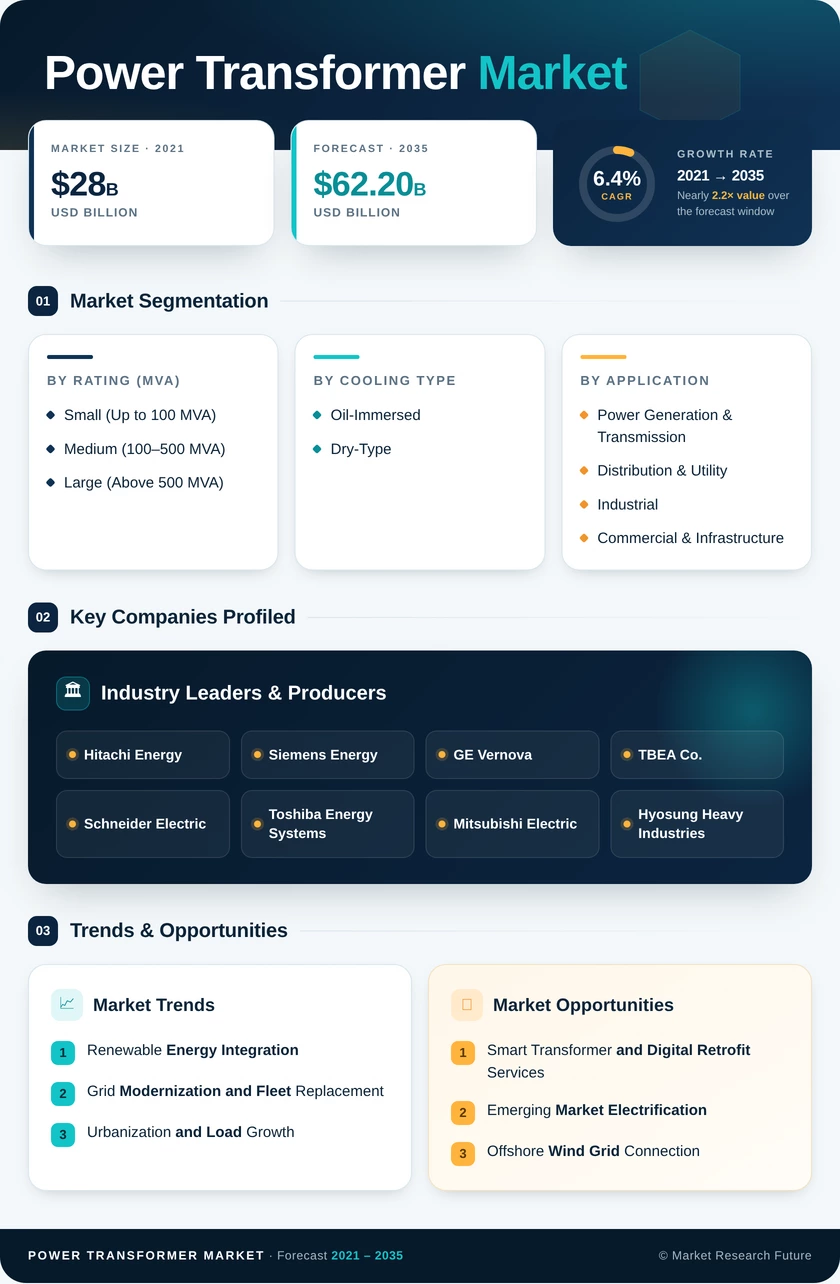
| By Rating (MVA) | Small (Up to 100 MVA), Medium (100–500 MVA), Large (Above 500 MVA) | Small (Up to 100 MVA) | Medium (100–500 MVA) |
| By Cooling Type | Oil-Immersed, Dry-Type | Oil-Immersed | Dry-Type |
| By Application | Power Generation & Transmission, Distribution & Utility, Industrial, Commercial & Infrastructure | Power Generation & Transmission | Commercial & Infrastructure |
| By Region | Asia-Pacific, Europe, North America, South America, Middle East & Africa | Asia-Pacific | Asia-Pacific |
Market Segmentation Overview
By Rating (MVA)
| Sub-Segment | Key Trend |
| Small (Up to 100 MVA) | Distribution network densification in emerging economies and rural electrification programs |
| Medium (100–500 MVA) | Utility-scale wind and solar plant interconnection; growing share of renewable step-up units |
| Large (Above 500 MVA) | UHV corridor expansion in China and India; nuclear new-build interconnection projects |
Small-rating transformers serve the highest-volume segment, deployed at 33 kV–132 kV substations connecting end-use loads. Medium-rating units are gaining share as renewable farms require dedicated step-up equipment in the 100–315 MVA range. Large units above 500 MVA are low-volume but high-value, procured for backbone transmission corridors.
By Cooling Type
| Sub-Segment | Key Trend |
| Oil-Immersed | Proven technology for outdoor HV/EHV; ester-fluid adoption for fire-sensitive sites |
| Dry-Type | Rapid growth in data centers, underground transit, and commercial buildings |
Oil-immersed designs dominate voltage classes above 66 kV due to superior dielectric and thermal performance. Dry-type transformers are carving out a fast-growing niche in enclosed environments where fire codes restrict flammable insulation fluids.
By Application
| Sub-Segment | Key Trend |
| Power Generation & Transmission | Generator step-up transformers, backbone auto-transformers, HVDC converter units |
| Distribution & Utility | Urban substation upgrades, smart grid integration, rural last-mile electrification |
| Industrial | Captive power for mining, steel, and petrochemical complexes |
| Commercial & Infrastructure | Hyperscale data center substations, EV charging depot transformers, airport/rail systems |
Power generation and transmission remains the largest application, anchored by every new power plant requiring generator step-up equipment. Commercial and infrastructure is the fastest-growing application, reflecting the data center construction boom and transport electrification wave that demand dedicated medium-voltage supply infrastructure.