2026 Solid State Transformers Market

Key Players: Siemens Energy, ABB Ltd, Hitachi Energy, Eaton Corporation, Schneider Electric, Mitsubishi Electric, General Electric (Vernova), Toshiba Energy Systems

2026 Solid State Transformers Market

Solid State Transformer Market Research Report Information By Application (Alternative Power Generation, Electric Vehicle Charging Stations, Power Distribution, Traction Locomotives, and Others), By Type (Distribution Solid-State Transformer, Power Solid-State Transformer, and Traction Solid-State Transformer), By End User (Energy, Transportation, and Others) And By Region (North America, Europe, Asia-Pacific, And Rest Of The World) - Growth & Industry Forecast to 2035
ID: MRFR/EnP/4401-HCR
100 Pages
Shubham Munde
Last Updated: June 04, 2026
 

Solid State Transformer Market Summary

The Solid State Transformer Market was valued at USD 193.44 million in 2025 and is projected to grow from USD 218.85 million in 2026 to USD 690.18 million by 2035, registering a CAGR of 14.12% during the forecast period (2026–2035). Utilities across North America, Europe, and Asia-Pacific are accelerating grid modernization programs that prioritize compact, digitally controllable power conversion over conventional oil-filled transformers. The U.S. Department of Energy's Grid Resilience and Innovation Partnerships (GRIP) program alone has earmarked over USD 10.5 billion for next-generation distribution infrastructure, creating a robust policy tailwind for SiC power electronics adoption [2].

Legacy copper-and-iron transformers — many installed 40+ years ago — lack bidirectional power flow capability and real-time voltage regulation, two features essential for integrating rooftop solar, battery storage, and DC microgrids. SiC and GaN wide-bandgap semiconductors now switch at medium frequency with dramatically lower losses, enabling medium frequency solid state transformer designs that cut magnetic core weight by 50–70% and fit inside space-constrained urban substations [3]. A recent report estimates that replacing just 5% of aging U.S. distribution transformers with smart SST bidirectional power flow units could defer USD 3.8 billion in grid upgrade costs through 2032 [4].

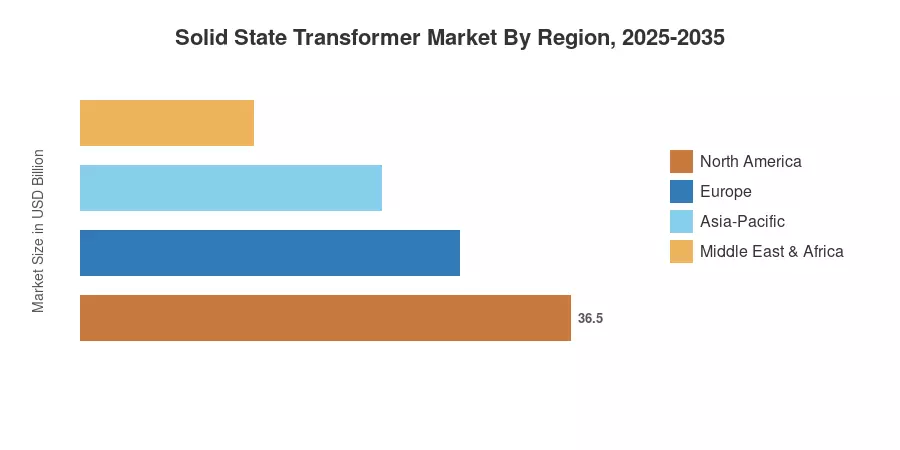
Asia-Pacific commands roughly 43.30% of global revenue, driven by China's State Grid spending on SST grid edge distribution pilots and India's Revamped Distribution Sector Scheme. Europe holds the second-largest share at approximately 26.50%, buoyed by EU directives phasing out SF₆ switchgear. North America is the third-largest region, propelled by defense microgrid mandates and solid-state transformer EV charging deployments along interstate corridors. As semiconductor costs continue their downward trajectory, the Solid State Transformer Market is positioned for sustained double-digit expansion well into the next decade [5].


Key Report Takeaways

• By Product Type

  • Distribution SSTs captured 43.70% of the Solid State Transformer Market share in 2025, reflecting heavy utility investment in grid edge distribution upgrades
  • Traction SST units for rail and on-board applications are forecast to expand at a 16.10% CAGR through 2035, the fastest among product segments
  • Power SSTs contributed USD 48.36 million in 2025 revenue, anchored by industrial DC microgrid deployments

• By Voltage Level

  • Medium-voltage equipment (2–36 kV) accounted for 59.55% of the Solid State Transformer Market in 2025
  • High-voltage systems above 36 kV are expected to grow at a 15.85% CAGR, driven by offshore wind interconnection and HVDC tapping applications

• By Application

  • Smart-grid and utility distribution applications led with USD 72.18 million in 2025 revenue
  • Solid state transformer EV charging infrastructure is projected to post the quickest application-level CAGR of 17.25% through 2035

• By Region

  • Asia-Pacific commanded 43.30% of 2025 revenue in the Solid State Transformer Market and is set to progress at a 15.05% CAGR
  • North America contributed USD 42.17 million in 2025, supported by DOE GRIP grants and defense standards


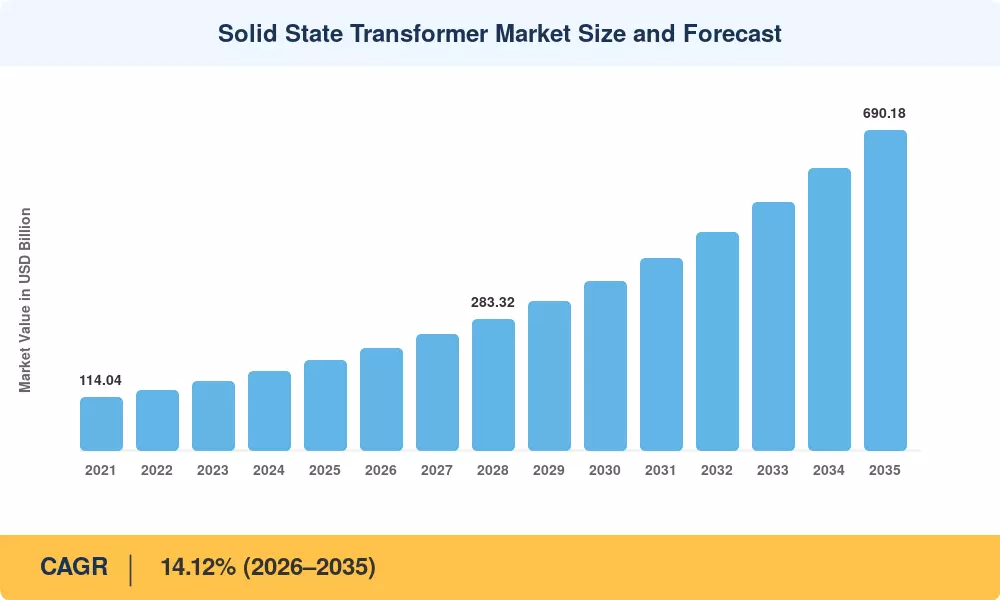
Market Size and Forecast (2021–2035)

MRFR’s estimating framework triangulates bottom-up manufacturer revenue data, patent filing velocity, and top-down TAM modeling against utility expenditure budgets stated in regulatory filings. Historical numbers (2021-2024) are verified by FERC Form 1 filings, Eurostat energy accounts, and yearly reports of highlighted enterprises. The forecast predictions (2026-2035) use a calibrated CAGR of 14.12%, stress tested against three macro scenarios (base, accelerated policy, delayed adoption).

.

Solid State Transformer Market Size and Forecast
Our Impact
Enabled $4.3B Revenue Impact for Fortune 500 and Leading Multinationals
Partnering with 2000+ Global Organizations Each Year
30K+ Citations by Top-Tier Firms in the Industry
 

Driver Impact Analysis

Driver ~% Impact on CAGR Geographic Relevance Impact Timeline
Grid modernization & aging infrastructure replacement 22% Global Long-term (≥4 yr)
SiC power electronics cost reduction 18% Global Medium-term (2–4 yr)
EV fast-charging infrastructure expansion 16% North America, Europe Medium-term (2–4 yr)
DC microgrid and renewable integration mandates 14% Asia-Pacific, Europe Long-term (≥4 yr)
Rail electrification programs 12% Europe, Asia-Pacific Short-term (≤2 yr)
Defense and military microgrid standards 10% North America Medium-term (2–4 yr)
SF₆ switchgear phase-out regulation 8% Europe Short-term (≤2 yr)


Grid Modernization and Aging Infrastructure

Over 70% of U.S. distribution transformers have exceeded their 25-year design life, according to DOE's 2023 National Transformer Study, and utilities face a USD 28 billion replacement backlog [2]. SST grid edge distribution units offer real-time fault isolation, voltage regulation, and power-quality analytics that oil-filled units cannot deliver. State public utility commissions in California, New York, and Texas have approved rate-based treatment for solid-state transformer deployments, removing a critical financing barrier and accelerating procurement timelines across the Solid-State Transformer Market [4].

SiC Power Electronics Cost Trajectory

Wolfspeed, STMicroelectronics, and Rohm Semiconductor have collectively announced over USD 8 billion in SiC fab expansion through 2027 [3]. As 200 mm SiC wafer production scales, device-level costs are projected to drop 35–40% by 2029, making medium frequency solid state transformer architectures cost-competitive with conventional alternatives in distribution applications above 500 kVA. This trajectory compresses payback periods from 8–10 years to under 5 years for urban substation retrofits [8].

EV Fast-Charging Infrastructure Expansion

The global installed base of DC fast chargers is expected to triple between 2025 and 2030, driven by the EU Alternative Fuels Infrastructure Regulation (AFIR) and the U.S. NEVI Formula Program's USD 7.5 billion allocation [9]. Solid state transformer EV charging architectures enable direct MV-to-DC conversion, eliminating bulky 50/60 Hz step-down stages and reducing charger footprint by up to 60%. ChargePoint and ABB E-mobility have both filed patents referencing SST-based megawatt charging for heavy-duty trucks, signaling near-term commercial traction [13].

DC Microgrid and Renewable Integration

IEA's World Energy Outlook 2024 projects that distributed solar PV capacity will surpass 1,500 GW globally by 2030 [10]. Solid state transformer DC microgrids enable seamless bidirectional power flow between rooftop arrays, battery energy storage, and the utility grid without intermediate AC conversion stages. IRENA estimates that SST-enabled microgrids can improve round-trip energy efficiency by 4–6 percentage points compared to conventional AC-coupled designs, a meaningful margin for commercial and industrial prosumers [14].


Restraints Impact Analysis

The restraint impacts below are directional estimates of headwinds that moderate the Solid State Transformer Market growth rate. They represent qualitative consensus from MRFR's expert panel and are not subtracted linearly from the CAGR.

Restraint ~% Negative Impact on CAGR Geographic Relevance Impact Timeline
High upfront cost vs. conventional transformers –18% Global Medium-term (2–4 yr)
Limited field-proven reliability data –15% Global Short-term (≤2 yr)
Complex thermal management at MV levels –12% Global Medium-term (2–4 yr)
Fragmented power electronics supply chain –10% North America, Europe Short-term (≤2 yr)
Utility procurement conservatism and standards lag –8% North America Long-term (≥4 yr)


High Upfront Cost Premium

At present, a distribution SST of 1 MVA class is 3–5× more expensive than a corresponding conventional transformer. Although the reductions in lifespan costs from reduced losses and delayed infrastructure upgrades help to bridge the difference, many utilities are rate-of-return regulated, which penalizes large initial capex. This premium limits the large-scale replacement of the fleet and confines the addressable section of the Solid State Transformer Market to pilot programs and high-value niche applications until regulatory treatment evolves or SiC power electronics costs decrease further.


Limited Field-Proven Reliability Data

Most SST deployments to date are demonstration-scale, with fewer than 500 units operating globally in live grid environments [16]. Utility procurement teams typically require 10+ years of field data before approving new transformer technologies for mainline distribution. The absence of IEEE or IEC type-test standards specifically tailored to medium frequency solid state transformer units forces manufacturers to pursue custom qualification programs, adding 12–18 months to project timelines and increasing perceived risk for risk-averse grid operators.

Thermal Management Complexity

SST modules have a high power density that puts the heat into a small enclosure, and requires advanced cooling techniques such as liquid-cooled cold plates, phase change materials, or forced air systems, which increases the cost and maintenance complexity [8]. Extreme ambient temperatures in Middle Eastern and South Asian markets increase thermal derating, limiting effective capacity by 10–15% in peak summer circumstances. Dealing with thermal issues at medium voltage levels is a major R&D focus for the Solid State Transformer Market.


Solid State Transformer Market Opportunities

Megawatt-Class EV Charging for Heavy-Duty Transport

CharIN expects to complete the Megawatt Charging System (MCS) standard by 2026 to offer 3.75 MW of electricity to Class 8 trucks [9]. SST systems are ideally positioned to deliver MV-to-DC conversion at this power level without large grid links. Early movers along freight routes in the U.S. I-10 and EU TEN-T core network can get a first-mover advantage in a segment predicted to reach USD 1.2 billion globally by 2032


Data-Center Edge Power Conversion

Hyperscale and edge data centers are rapidly adopting 48 VDC bus topologies that create demand for SST-based MV-to-LVDC converters that circumvent typical UPS chains [18]. Smart SSTs, which can deliver power in two directions, let data centers join demand-response programs and generate revenue from grid services, saving an estimated 8-12% on the price of electricity. This dual-value offering makes the Solid State Transformer Market ideal for colocation and enterprise facilities expanding in APAC and EMEA


Offshore Wind HVDC Tapping

Offshore wind farms connected via HVDC subsea cables require compact power-tapping solutions for nearshore communities and port electrification. Medium frequency solid state transformer designs operating at 10–20 kHz reduce platform weight and volume by up to 60% compared to 50 Hz alternatives, directly lowering CAPEX for balance-of-plant systems [10]. European TSOs, including TenneT and Elia, have issued RFIs for SST-based HVDC tapping demonstrators

Emerging Market Rural Electrification

India's RDSS targets 100% smart-metered distribution by 2027, and sub-Saharan Africa's electrification rate remains below 50% [19]. Containerized SST units paired with solar-plus-storage microgrids can deliver reliable AC and DC power to remote communities without conventional substation infrastructure. The World Bank's Scaling Mini Grids initiative has allocated USD 500 million for distributed energy solutions in which solid-state transformer DC microgrids are eligible technology platforms

Predictive Maintenance and Digital Twin Monetization

SSTs have voltage, current, and heat sensors that produce continuous streams of operational data. Manufacturers might offer transformer-as-a-service models that include predictive analytics, digital twin simulations, and remote firmware updates in recurring revenue contracts [20]. Shifting the business model from hardware sales to platform economics could increase the serviceable market for SST grid edge distribution by 25–30% beyond the hardware TAM


Solid State Transformer Market Future Outlook

AI-Driven Autonomous Grid Operations

By 2030, digital substations embedding SST units will leverage edge AI to perform autonomous load balancing, fault isolation, and predictive maintenance without human intervention [20]. DOE's Advanced Grid Research Division projects that AI-enabled SST grid edge distribution systems could reduce unplanned outages by 40% in pilot networks, making the Solid State Transformer Market a critical enabler of the autonomous grid paradigm.

Platform Economics and Transformer-as-a-Service

The shift from one-time hardware procurement to subscription-based transformer-as-a-service models will reshape revenue structures. Manufacturers offering firmware updates, digital twin analytics, and remote diagnostics via SiC power electronics-equipped SSTs can capture 2–3× the lifetime revenue of a conventional sale [18]. This transition mirrors the software-defined networking revolution and positions the Solid State Transformer Market for recurring-revenue growth.

Electrification Supercycle: Transport, Industry, Buildings

IEA's Net Zero Emissions scenario projects global electricity demand rising 75% by 2050, driven by transport electrification, industrial heat pumps, and building decarbonization [10]. Every new GW of demand requires proportional distribution capacity. SSTs — with their compact footprint, bidirectional power flow, and DC-native capability — are structurally advantaged to serve this supercycle, particularly in urban environments where substation space commands premium real estate prices.

ESG Reporting and Scope 3 Grid Emissions

Corporate sustainability reporting frameworks (GRI, CDP, ISSB) increasingly require Scope 3 emissions disclosure for purchased electricity [21]. SSTs reduce distribution losses by 2–4% compared to conventional transformers, directly lowering Scope 3 footprints for commercial and industrial offtakers. As ESG compliance tightens, procurement officers will favor solid-state transformer EV charging and distribution solutions that demonstrate measurable emissions reductions in auditable reporting.


Solid State Transformer Market Segmentation

By Product Type

Segment Key Metric Primary Demand Driver
Distribution SST 43.70% share (2025) Utility grid modernization and smart metering
Power SST USD 48.36 Million (2025) Industrial DC microgrid applications
Traction SST (Rail/On-board) 16.10% CAGR (2026–2035) Rail electrification and weight reduction mandates


Distribution SSTs dominate the Solid State Transformer Market because utilities represent the single largest buyer category, and aging grid infrastructure creates an immediate replacement cycle. These units integrate SiC power electronics and medium frequency isolation to deliver real-time voltage regulation, reactive power compensation, and fault current limiting in a single enclosure — functions that require three separate devices in conventional substations [4].

Traction SSTs are the fastest-growing product segment, propelled by European and Asian rail operators seeking 30–40% weight savings on rolling stock. Deutsche Bahn, SNCF, and JR East have all issued RFPs specifying on-board SST architectures for next-generation electric multiple units, and the combined addressable market for rail-grade SiC power electronics exceeds USD 2 billion through 2035 [11].

By Voltage Level

Segment Key Metric Primary Demand Driver
Medium-Voltage (2–36 kV) 59.55% share (2025) Urban distribution and industrial SST applications
High-Voltage (>36 kV) 15.85% CAGR (2026–2035) HVDC tapping and offshore wind interconnection


Medium-voltage equipment accounts for the majority of the Solid State Transformer Market because distribution networks globally operate predominantly in the 10–35 kV range. High-voltage SSTs, while smaller in absolute terms, are gaining momentum as TSOs evaluate compact HVDC tap solutions for multi-terminal offshore wind networks and cross-border interconnectors [10].

By Application

Segment Key Metric Primary Demand Driver
Smart Grid & Utility Distribution USD 72.18 Million (2025) Aging infrastructure, DER integration
Renewable & Micro-Grid Integration 15.40% CAGR (2026–2035) Solar-plus-storage DC coupling
EV Fast-Charging Infrastructure 17.25% CAGR (2026–2035) NEVI, AFIR, MCS standard adoption


Smart grid and utility distribution remain the revenue anchor of the Solid State Transformer Market, driven by the sheer volume of transformers requiring replacement globally. Solid state transformer EV charging is the fastest-growing application, as MV-to-DC architectures eliminate intermediate conversion stages and reduce charger footprint — a decisive advantage for highway corridor and urban depot installations where space is at a premium [9].


Regional Market Share Analysis

Region Key Metric Primary Investment Themes
Asia-Pacific 43.30% share (2025) Grid resilience, rail electrification and domestic SiC supply
Europe 26.50% share (2025) SF₆ phase-out, offshore wind integration, rail traction
North America USD 42.17 Million (2025) Defense microgrids, EV corridors, utility modernization
South America 11.85% CAGR (2026–2035) Mining electrification, renewable integration
Middle East & Africa USD 10.64 Million (2025) Smart city programs, solar microgrid deployment
Total USD 193.44 Million (2025)

The Solid State Transformer Market exhibits strong geographic concentration, with Asia-Pacific and Europe together accounting for nearly 70% of global revenue in 2025. Regional growth trajectories reflect divergent policy environments, grid age profiles, and semiconductor supply chain proximity.


North America

Country Key Metric Key Driver
US 78.40% of regional revenue DOE GRIP program, NEVI EV charging [2]
Canada 12.15% CAGR Provincial grid modernization mandates
Mexico USD 2.53 Million (2025) CFE smart grid pilot programs


The U.S. dominates the North American Solid State Transformer Market, with DOE and ARPA-E funding over USD 120 million in SST R&D since 2020 [2]. Canada's Ontario Energy Board approved pilot tariffs for bidirectional power flow equipment in 2024, while Mexico's CFE is exploring SST grid edge distribution for industrial parks along the northern border corridor [12].

Europe

Country Key Metric Key Driver
Germany 28.75% of regional revenue Energiewende grid expansion, Siemens R&D hub
UK 13.60% CAGR Ofgem RIIO-ED2 innovation funding [7]
France USD 5.82 Million (2025) SNCF rail electrification modernization
Italy 12.45% CAGR Enel smart grid investments
Spain USD 3.15 Million (2025) Renewable integration in Andalusia
Nordic Countries 14.20% CAGR Offshore wind HVDC tapping pilots
Russia USD 1.87 Million (2025) Rail traction for Trans-Siberian upgrades
Rest of Europe 11.90% CAGR EU Horizon Europe SST research grants


Europe's regulatory push to eliminate SF₆-insulated switchgear by 2030 has catalyzed demand for SiC power electronics-based alternatives across the distribution segment. Germany's Siemens Energy and Hitachi Energy jointly operate Europe's largest SST pilot at the Erlangen test facility, validating medium-voltage bidirectional architectures for urban substations [7].

Asia-Pacific

Country Key Metric Key Driver
China 48.60% of regional revenue State Grid SST pilots, domestic SiC fabs
India 16.35% CAGR RDSS smart distribution mandate [19]
Japan USD 9.74 Million (2025) Shinkansen traction SST upgrades
South Korea 14.80% CAGR KEPCO smart grid R&D, K-Semiconductor strategy
ASEAN USD 4.28 Million (2025) Thailand and Vietnam grid expansion
Rest of Asia-Pacific 13.50% CAGR Australia mining electrification


Asia-Pacific leads the Solid State Transformer Market with the highest regional CAGR, driven by China's ambitious 14th and forthcoming 15th Five-Year Plan allocations for smart grid infrastructure. India's RDSS program mandates smart distribution across all DISCOMs by 2027, creating a substantial addressable market for solid-state transformer DC microgrids in rural feeder networks [19].

South America

Country Key Metric Key Driver
Brazil 62.30% of regional revenue ANEEL grid modernization auctions
Argentina 12.70% CAGR Lithium mining electrification
Rest of South America USD 2.18 Million (2025) Chile and Colombia's renewable integration


Brazil's ANEEL has incorporated SST-compatible equipment specifications into its latest distribution concession frameworks, signaling regulatory readiness. Mining operations across Argentina and Chile are evaluating solid-state transformer DC microgrids for remote processing facilities where grid connection is impractical [14].

Middle East & Africa

Country Key Metric Key Driver
Saudi Arabia 35.80% of regional revenue NEOM smart city, Vision 2030 grid upgrades
UAE 14.55% CAGR Dubai Electricity & Water Authority pilots
South Africa USD 1.92 Million (2025) Eskom grid stabilization
Egypt 12.85% CAGR New Administrative Capital smart grid
Rest of MEA USD 1.45 Million (2025) Sub-Saharan solar microgrid programs


Saudi Arabia's NEOM project has specified medium-frequency solid-state transformer units for its planned 100% renewable-powered city grid. DEWA in the UAE is piloting smart SST bidirectional power flow for rooftop solar integration in Dubai's Al Quoz industrial zone, targeting 15% distribution loss reduction [19].


Solid State Transformer Market By Region, 2025-2035
 

Competitive Benchmarking

The Solid State Transformer Market exhibits medium concentration, with the top five players holding an estimated 38–45% combined revenue share. The Herfindahl-Hirschman Index (HHI) sits in the 800–1,200 range, reflecting a mix of diversified power equipment conglomerates and specialized SiC power electronics firms. Competition centers on semiconductor integration depth, reference installation count, and partnerships with major utilities and rail operators.

Company Est. Revenue Share Range Key Offerings Strategic Positioning
Siemens Energy ~8–11% MVDC distribution SST, rail traction converters Vertically integrated; Erlangen SST test center
ABB Ltd ~7–10% Power and distribution SSTs, SiC modules Broad grid automation portfolio; E-mobility division
Hitachi Energy ~6–9% MV SST for smart grids, HVDC tapping prototypes Grid-edge digital solutions; joint Siemens pilot
Eaton Corporation ~5–8% Medium-voltage SST, microgrid controllers Strong North American utility relationships
Schneider Electric ~4–7% EcoStruxure-integrated SST platforms Software-defined distribution management
Mitsubishi Electric ~4–6% Traction SST for Shinkansen, industrial converters Deep Japan Rail relationships; SiC fab access
General Electric (Vernova) ~3–6% Grid Solutions division SST prototypes Installed base in North American utilities
Toshiba Energy Systems ~3–5% Medium frequency transformer modules SiC device manufacturing capability
Power Electronics S.L. ~2–4% Modular SST for solar and EV charging Niche strength in renewable power conversion
TBEA Co., Ltd. ~2–4% High-voltage SST for State Grid pilots Dominant China market access; cost leadership


Recent News & Developments


  • European Commission (November 2023): Published revised F-gas regulation mandating SF₆ phase-out in new MV switchgear by 2030, accelerating demand for SST-based distribution alternatives across the Solid State Transformer Market [Ref 7].


Solid State Transformer Market Report Scope

Parameter Detail
Market Scope Global Solid State Transformer Market covering power, distribution, and traction SST product types
Study Period 2021–2035
CAGR 14.12% (2026–2035)
Market Size — Base Year (2025) USD 193.44 Million
Market Size — Forecast Endpoint (2035) USD 690.18 Million
Fastest Growing Segment EV Fast-Charging Infrastructure (17.25% CAGR)
Fastest Growing Region Asia-Pacific (15.05% CAGR)
Companies Profiled 10 (Siemens Energy, ABB, Hitachi Energy, Eaton, Schneider Electric, Mitsubishi Electric, GE Vernova, Toshiba, Power Electronics S.L., TBEA)
Valuation Currency USD Million


FAQs

How does a solid-state transformer differ from a conventional line-frequency transformer in physical architecture?

A solid state transformer replaces passive iron-core magnetics with a multi-stage power electronics topology — typically AC-DC, isolated DC-DC via a medium frequency link, and DC-AC — using SiC or GaN semiconductors. This architecture shrinks core volume by 50–70% and enables digital controllability absent in legacy designs [Ref 4].

What procurement criteria should utilities prioritize when evaluating SST vendors for the Solid State Transformer Market?

Prioritize vendors with grid-connected reference installations exceeding 12 months of continuous operation, UL/IEC-certified protection coordination, and documented mean-time-between-failure data. A strong digital twin and remote diagnostics platform also reduces long-term O&M costs [Ref 16].

Can solid-state transformers operate reliably in extreme ambient temperature environments above 50 °C?

Current commercial units are typically rated to 45 °C ambient, with derating above that threshold. Advanced liquid-cooled enclosures from Siemens and Hitachi extend operation to 55 °C, though thermal management adds 10–15% to system cost [Ref 8].

What role does the Solid State Transformer Market play in enabling vehicle-to-grid (V2G) energy flows?

SSTs provide inherent bidirectional power flow capability, making them ideal V2G enablers. They manage real-time voltage and frequency matching between EV batteries and the distribution grid without additional inverter hardware [Ref 9].

How do cybersecurity risks affect solid-state transformer deployments in critical infrastructure?

SSTs embed networked controllers and firmware-updatable power stages, expanding the attack surface versus passive transformers. NERC CIP compliance and IEC 62351 encryption are essential for utility-grade deployments in the Solid State Transformer Market [Ref 12].

What is the expected payback period for a distribution-class SST replacing a conventional unit in the Solid State Transformer Market?

Current payback ranges from 6 to 9 years for urban substations with high load variability and DER penetration. As SiC device costs decline 35–40% by 2029, payback is projected to fall below 5 years [Ref 15].

Are there interoperability standards governing SST communication protocols for multi-vendor grid deployments?

IEEE 2030.11 and IEC 61850-90-17 are under development to standardize SST communication and interoperability. Until ratification, vendors rely on proprietary protocols, creating integration friction in multi-vendor substations [Ref 6].


FAQs

What is the projected market valuation of the Solid State Transformer Market by 2035?

The projected market valuation for the Solid State Transformer Market by 2035 is 0.5635 USD Billion.

What was the market valuation of the Solid State Transformer Market in 2024?

The overall market valuation of the Solid State Transformer Market was 0.13 USD Billion in 2024.

What is the expected CAGR for the Solid State Transformer Market during the forecast period 2025 - 2035?

The expected CAGR for the Solid State Transformer Market during the forecast period 2025 - 2035 is 14.26%.

Which companies are considered key players in the Solid State Transformer Market?

Key players in the Solid State Transformer Market include Siemens, General Electric, Schneider Electric, ABB, Mitsubishi Electric, Hitachi, Cree, Infineon Technologies, and Power Integrations.

What are the main product types in the Solid State Transformer Market?

The main product types in the Solid State Transformer Market include Distribution Solid State Transformers, Power Solid State Transformers, and Traction Solid State Transformers.

What is the valuation of the Power Solid State Transformer segment in 2025?

The valuation of the Power Solid State Transformer segment is projected to be 0.25 USD Billion in 2025.

How does the Electric Vehicle Charging Stations application segment perform in the market?

The Electric Vehicle Charging Stations application segment is expected to reach a valuation of 0.18 USD Billion in 2025.

What is the projected valuation for the Energy end-user segment by 2035?

The projected valuation for the Energy end-user segment is anticipated to be 0.25 USD Billion by 2035.

What applications are included in the Solid State Transformer Market?

Applications in the Solid State Transformer Market include Alternative Power Generation, Electric Vehicle Charging Stations, Power Distribution, and Traction Locomotives.

What is the expected growth trend for the Solid State Transformer Market in the coming years?

The Solid State Transformer Market is likely to experience robust growth, with a projected CAGR of 14.26% from 2025 to 2035.
Author
Author
Author Profile
Shubham Munde LinkedIn
Team Lead - Research
Shubham brings over 7 years of expertise in Market Intelligence and Strategic Consulting, with a strong focus on the Automotive, Aerospace, and Defense sectors. Backed by a solid foundation in semiconductors, electronics, and software, he has successfully delivered high-impact syndicated and custom research on a global scale. His core strengths include market sizing, forecasting, competitive intelligence, consumer insights, and supply chain mapping. Widely recognized for developing scalable growth strategies, Shubham empowers clients to navigate complex markets and achieve a lasting competitive edge. Trusted by start-ups and Fortune 500 companies alike, he consistently converts challenges into strategic opportunities that drive sustainable growth.

Research Approach


Secondary Research

The secondary research process involved comprehensive analysis of regulatory databases, technical standards publications, peer-reviewed engineering journals, and authoritative energy organizations. Key sources included the US Department of Energy (DOE), Federal Energy Regulatory Commission (FERC), National Institute of Standards and Technology (NIST), International Electrotechnical Commission (IEC), Institute of Electrical and Electronics Engineers (IEEE), CIGRE (International Council on Large Electric Systems), European Commission Directorate-General for Energy, International Energy Agency (IEA), US Energy Information Administration (EIA), European Network of Transmission System Operators for Electricity (ENTSO-E), National Renewable Energy Laboratory (NREL), Oak Ridge National Laboratory (ORNL), China National Energy Administration (NEA), Japan Ministry of Economy, Trade and Industry (METI), and regional utility regulatory commission reports. These sources were used to collect grid modernization statistics, regulatory policy frameworks, power electronics safety studies, renewable integration trends, and competitive landscape analysis for medium voltage SSTs, high voltage SSTs, distribution SSTs, traction SSTs, and power SST applications.

Additional Authoritative Sources:

Smart Electric Power Alliance (SEPA) – grid modernization deployment data

Edison Electric Institute (EEI) – utility industry investment trends

Electric Power Research Institute (EPRI) – SST technical feasibility studies

International Renewable Energy Agency (IRENA) – renewable energy integration standards

North American Electric Reliability Corporation (NERC) – grid reliability standards

Global Wind Energy Council (GWEC) & Solar Power Europe – renewable capacity data driving SST adoption


Primary Research

To gather both qualitative and quantitative insights, supply-side and demand-side stakeholders were interviewed during the primary research phase. CEOs, VPs of engineering, CTOs of Power Electronics, heads of regulatory compliance, and directors of business development from SST manufacturers, semiconductor firms (suppliers of SiC/GaN devices), power module integrators, and transformer OEMs were examples of supply-side sources. Demand-side sources included TSO/DSO technical directors, railway electrification engineers, renewable project developers, data center power infrastructure leads, procurement heads from industrial manufacturing facilities, and chief grid strategists from electric utilities. Primary research established product commercialization timescales, validated market segmentation across voltage levels and applications, and collected information on utility procurement cycles, grid interoperability standards, and total cost of ownership comparisons with traditional transformers.

Primary Respondent Breakdown:

Table

Copy

Category Segmentation Revised Percentage

By Company Tier Tier 1 (>USD 5B revenue) 38%

Tier 2 (USD 500M–5B) 31%

By Designation C-level Executives 32%

Director/VP Level 30%

Manager/Technical Leads 22%

Others (Analysts/Specialists) 16%

By Region North America 32%

Europe 29%

Asia-Pacific 28%

Rest of World (Middle East, Latin America, Africa) 11%

Note: Tier classifications adjusted for power electronics and heavy electrical equipment sector as of 2024


Market Size Estimation

Global market valuation was derived through revenue mapping and installation capacity analysis. The methodology included:

Identification of 50+ key stakeholders across SST manufacturers, wide-bandgap semiconductor suppliers (SiC/GaN), power module packagers, and system integrators in North America, Europe, Asia-Pacific, and emerging markets

Product mapping across medium voltage SST (distribution grid applications), high voltage SST (transmission-level pilots), traction SST (railway electrification), power SST (data centers/industrial), and renewable integration SSTs

Analysis of reported and modeled annual revenues specific to SST portfolios and power electronics divisions of major industrial conglomerates

Coverage of manufacturers and integrators representing 65–70% of addressable global market share in 2024

Extrapolation using:

Bottom-up approach: Installed base projections × unit pricing by voltage class and application

Top-down validation: Utility capital expenditure tracking and grid modernization budget allocation analysis

Cross-reference with: Reported power electronics market data, SiC/GaN device shipment forecasts, and smart grid investment databases

Segment-Specific Valuation Factors:

Utility-scale pilot deployments and commercial order pipelines

Railway electrification modernization programs (Europe, China, India)

Data center power density requirements driving SST adoption

Renewable energy integration mandates and grid code compliance timelines

Download Free Sample

Kindly complete the form below to receive a free sample of this Report

Download PDF ×

We do not share your information with anyone. However, we may send you emails based on your report interest from time to time. You may contact us at any time to opt-out.