-
MARKET 13
-
GLOBAL NON-DESTRUCTIVE INSPECTION
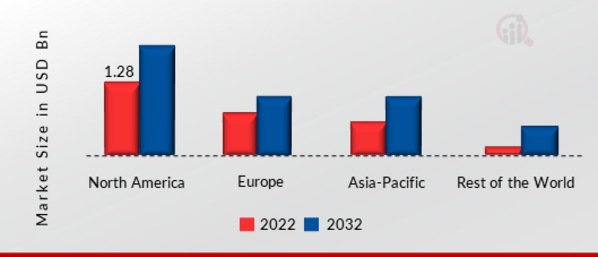
- GLOBAL NON-DESTRUCTIVE INSPECTION EQUIPMENT
-
EQUIPMENT MARKET BY REGION 13
-
MARKET, BY REGION, 2024 VS 2032 (USD MILLION) 13
-
GLOBAL NON-DESTRUCTIVE
-
INSPECTION EQUIPMENT MARKET, BY REGION, 2024-2032 (USD MILLION) 14
-
NORTH
- NORTH AMERICA: NON-DESTRUCTIVE INSPECTION EQUIPMENT MARKET,
- NORTH AMERICA: NON-DESTRUCTIVE
-
AMERICA 15
-
BY COUNTRY, 2024-2032
-
(USD MILLION) 16
-
INSPECTION EQUIPMENT MARKET, BY INDUSTRY VERTICAL,
-
16
-
INDUSTRY VERTICAL, 2024-2032
-
(USD MILLION) 17
-
1.2.6
-
US 17
-
US NON-DESTRUCTIVE INSPECTION EQUIPMENT MARKET, BY
-
CANADA 17
-
CANADA NON-DESTRUCTIVE INSPECTION EQUIPMENT MARKET, BY INDUSTRY VERTICAL, 2024-2032
-
(USD MILLION) 17
-
MEXICO 18
-
MEXICO NON-DESTRUCTIVE INSPECTION
-
EQUIPMENT MARKET, BY INDUSTRY VERTICAL, 2024-2032
-
(USD MILLION) 18
-
1.3
-
EUROPE 19
-
EUROPE: NON-DESTRUCTIVE INSPECTION EQUIPMENT MARKET, BY COUNTRY,
-
EUROPE: NON-DESTRUCTIVE INSPECTION EQUIPMENT
-
MARKET, BY INDUSTRY VERTICAL, 2024-2032
-
(USD MILLION) 20
-
22
-
(USD MILLION) 22
-
GERMANY
-
GERMANY NON-DESTRUCTIVE INSPECTION EQUIPMENT MARKET, BY INDUSTRY VERTICAL,
-
FRANCE 22
-
FRANCE NON-DESTRUCTIVE
-
INSPECTION EQUIPMENT MARKET, BY INDUSTRY VERTICAL, 2024-2032
-
(USD MILLION)
-
22
-
INDUSTRY VERTICAL, 2024-2032
-
(USD MILLION) 23
-
1.3.10
-
UK 23
-
UK NON-DESTRUCTIVE INSPECTION EQUIPMENT MARKET, BY
-
RUSSIA 23
-
RUSSIA NON-DESTRUCTIVE INSPECTION EQUIPMENT MARKET, BY INDUSTRY VERTICAL, 2024-2032
-
(USD MILLION) 23
-
ITALY 24
-
ITALY NON-DESTRUCTIVE INSPECTION
-
EQUIPMENT MARKET, BY INDUSTRY VERTICAL, 2024-2032
-
(USD MILLION) 24
-
1.3.13
-
REST OF EUROPE 24
-
REST OF EUROPE NON-DESTRUCTIVE INSPECTION EQUIPMENT
-
MARKET, BY INDUSTRY VERTICAL,
-
ASIA-PACIFIC
- ASIA-PACIFIC: NON-DESTRUCTIVE INSPECTION EQUIPMENT MARKET, BY COUNTRY,
- ASIA-PACIFIC: NON-DESTRUCTIVE INSPECTION
-
26
-
(USD MILLION) 27
-
EQUIPMENT MARKET, BY INDUSTRY VERTICAL,
-
1.4.3
-
CHINA 28
-
VERTICAL, 2024-2032
-
(USD MILLION) 28
-
CHINA NON-DESTRUCTIVE INSPECTION EQUIPMENT MARKET, BY INDUSTRY
-
JAPAN 29
-
JAPAN NON-DESTRUCTIVE
-
INSPECTION EQUIPMENT MARKET, BY INDUSTRY VERTICAL, 2024-2032
-
(USD MILLION)
-
29
-
SOUTH KOREA 29
-
SOUTH KOREA NON-DESTRUCTIVE INSPECTION EQUIPMENT
-
MARKET, BY INDUSTRY VERTICAL,
-
(USD MILLION) 30
-
INDIA 30
-
INDIA NON-DESTRUCTIVE INSPECTION EQUIPMENT MARKET, BY INDUSTRY VERTICAL,
-
SOUTHEAST ASIA 30
-
SOUTHEAST
-
ASIA NON-DESTRUCTIVE INSPECTION EQUIPMENT MARKET, BY INDUSTRY VERTICAL,
-
(USD MILLION) 30
-
REST OF ASIA-PACIFIC 31
-
REST OF ASIA-PACIFIC
-
NON-DESTRUCTIVE INSPECTION EQUIPMENT MARKET, BY INDUSTRY VERTICAL,
-
(USD MILLION) 31
-
SOUTH AMERICA 32
- SOUTH AMERICA: NON-DESTRUCTIVE
-
INSPECTION EQUIPMENT MARKET, BY COUNTRY, 2024-2032
-
(USD MILLION) 33
-
1.5.2
-
SOUTH AMERICA: NON-DESTRUCTIVE INSPECTION EQUIPMENT MARKET, BY INDUSTRY VERTICAL,
-
BRAZIL 34
-
BRAZIL NON-DESTRUCTIVE
-
INSPECTION EQUIPMENT MARKET, BY INDUSTRY VERTICAL, 2024-2032
-
(USD MILLION)
-
34
-
ARGENTINA 34
-
ARGENTINA NON-DESTRUCTIVE INSPECTION EQUIPMENT
-
MARKET, BY INDUSTRY VERTICAL, 2024-2032
-
(USD MILLION) 34
-
35
-
VERTICAL, 2024-2032
-
(USD MILLION) 35
-
VERTICAL,
-
COUNTRY, 2024-2032
-
(USD MILLION) 38
-
COLUMBIA
-
COLUMBIA NON-DESTRUCTIVE INSPECTION EQUIPMENT MARKET, BY INDUSTRY
-
REST OF SOUTH AMERICA 35
-
REST OF SOUTH AMERICA NON-DESTRUCTIVE INSPECTION EQUIPMENT MARKET, BY INDUSTRY
-
MIDDLE EAST & AFRICA 37
- MIDDLE EAST & AFRICA: NON-DESTRUCTIVE INSPECTION EQUIPMENT MARKET, BY
- MIDDLE EAST & AFRICA: NON-DESTRUCTIVE
-
INSPECTION EQUIPMENT MARKET, BY INDUSTRY VERTICAL,
-
38
-
SAUDI ARABIA 39
-
SAUDI ARABIA NON-DESTRUCTIVE INSPECTION
-
EQUIPMENT MARKET, BY INDUSTRY VERTICAL, 2024-2032
-
(USD MILLION) 39
-
1.6.5
-
UAE 39
-
(USD MILLION) 40
-
UAE NON-DESTRUCTIVE INSPECTION EQUIPMENT MARKET, BY INDUSTRY VERTICAL,
-
EGYPT 40
-
EGYPT NON-DESTRUCTIVE
-
INSPECTION EQUIPMENT MARKET, BY INDUSTRY VERTICAL, 2024-2032
-
(USD MILLION)
-
40
-
NIGERIA 41
-
NIGERIA NON-DESTRUCTIVE INSPECTION EQUIPMENT
-
MARKET, BY INDUSTRY VERTICAL, 2024-2032
-
(USD MILLION) 41
-
AFRICA 41
-
BY INDUSTRY VERTICAL,
-
EAST & AFRICA 42
-
INSPECTION EQUIPMENT MARKET,
-
BY INDUSTRY VERTICAL, 2024-2032 (USD MILLION)
-
42
-
1.7.4
-
SOUTH AMERICA 46
-
OF THE MARKET 47
-
SAFETY REGULATIONS 48
-
INFRASTRUCTURE 48
-
-
49
-
IMPACT ANALYSIS 49
-
INDUSTRY 49
-
& LACK OF AWARENESS 50
-
TESTING (PAUT) METHOD 50
-
CHAIN ANALYSIS 51
-
51
-
FIVE FORCES MODEL 52
-
POWER OF SUPPLIERS 53
-
POWER OF BUYERS 53
-
SOUTH
-
SOUTH AFRICA NON-DESTRUCTIVE INSPECTION EQUIPMENT MARKET,
-
REST OF MIDDLE
-
REST OF MIDDLE EAST & AFRICA NON-DESTRUCTIVE
-
QUALITATIVE INFORMATION ON LARGE FLUCTUATION BY COUNTRY/REGION 43
- NORTH AMERICA 43
- EUROPE 44
- ASIA-PACIFIC 45
- MIDDLE EAST & AFRICA 46
-
VARIABLE FACTORS
- INTRODUCTION 47
- DRIVERS 48
- DRIVER IMPACT ANALYSIS 48
- RESTRAINTS
- RESTRAINT
- OPPORTUNITIES 49
- CHALLENGES 50
- TRENDS 50
- VALUE /SUPPLY
- PORTER’S
-
CUSTOMER 54
-
2.1
-
GLOBAL NON-DESTRUCTIVE INSPECTION EQUIPMENT MARKET BY INDUSTRY/APPLICATION 54
-
BY INDUSTRY/APPLICATION,
-
& TRANSPORTATION 55
-
& FORECAST, BY REGION, 2024-2032
-
(USD MILLION) 55
-
& DEFENSE 56
-
BY REGION, 2024-2032 (USD MILLION) 56
-
OVERVIEW 54
-
GLOBAL NON-DESTRUCTIVE INSPECTION EQUIPMENT MARKET,
-
RAILWAYS
-
RAILWAYS & TRASPORTATION: MARKET ESTIMATES
-
AEROSPACE
-
AEROSPACE & DEFENSE: MARKET ESTIMATES & FORECAST,
-
OIL & GAS 56
-
OIL
-
& GAS: MARKET ESTIMATES & FORECAST, BY REGION, 2024-2032 (USD MILLION) 56
-
& FORECAST, BY REGION, 2024-2032 (USD MILLION) 57
-
-
57
-
(USD MILLION) 57
-
FORECAST, BY REGION, 2024-2032 (USD MILLION) 58
-
POWER & ENERGY 57
-
POWER & ENERGY: MARKET ESTIMATES
-
HEALTHCARE
-
HEALTHCARE: MARKET ESTIMATES & FORECAST, BY REGION, 2024-2032
-
OTHERS 58
-
OTHERS: MARKET ESTIMATES &
-
NON-DESTRUCTIVE INSPECTION
-
EQUIPMENT MARKET, BY CUSTOMER ANALYSIS 58
-
KEY BUYING FACTORS 59
- SERVICE AND SUPPORT 59
- INSPECTION METHOD 60
- ELECTRICAL POWER & PART SIZE 60
- BUYING COST 60
- DRONE TECHNOLOGY 61
-
2.3.1
-
INTRODUCTION 59
-
2.3.6
-
NDT CODES AND STANDARDS 61
-
COMPETITION 62
-
KEY COMPANY PROFILLING 62
- PROMAG TECHNOLOGIES DEVELOPMENT LIMITED
- OKONDT GROUP 63
- LABQUIP (IRELAND) LIMITED
- MFE INSPECTION SOLUTIONS
- TWI LTD 67
- STANLAY 68
- NEXXIS 69
- NON-DESTRUCTIVE TESTING (NDT) PRODUCTS LIMITED 70
- BAKER HUGHES COMPANY 71
- OLYMPUS CORPORATION 74
- ZETEC, INC. 77
-
62
-
3.1.1.3
-
PRODUCTS OFFERED 62
-
OFFERED 63
-
64
-
3.1.3.3
-
PRODUCTS OFFERED 64
-
65
-
3.1.4.3
-
PRODUCTS OFFERED 65
-
3.1.5.1
-
COMPANY OVERVIEW 67
-
67
-
68
-
3.1.6.4
-
KEY DEVELOPMENTS 68
-
3.1.7.2
-
FINANCIAL OVERVIEW 69
-
69
-
OVERVIEW 70
-
OVERVIEW 71
-
73
-
3.1.10.2
-
FINANCIAL OVERVIEW 75
-
76
-
-
OVERVIEW 77
-
MARKET SHARE ANALYSIS (% SHARE) 2021 79
-
KEY SUCCESS FACTORS TO MEET
-
KEY BUYING FACTORS 80
-
-
LIST OF TABLES
-
GLOBAL NON-DESTRUCTIVE
-
INSPECTION EQUIPMENT MARKET, BY REGION, 2024-2032 (USD MILLION) 14
-
TABLE 2
-
NORTH AMERICA NON-DESTRUCTIVE INSPECTION EQUIPMENT MARKET, BY COUNTRY, 2024-2032
-
(USD MILLION) 16
-
NORTH AMERICA NON-DESTRUCTIVE INSPECTION EQUIPMENT
-
MARKET, BY INDUSTRY VERTICAL, 2024-2032
-
(USD MILLION) 16
-
US NON-DESTRUCTIVE
-
INSPECTION EQUIPMENT MARKET, BY INDUSTRY VERTICAL, 2024-2032 (USD MILLION) 17
-
CANADA NON-DESTRUCTIVE INSPECTION EQUIPMENT MARKET, BY INDUSTRY VERTICAL,
-
MEXICO NON-DESTRUCTIVE INSPECTION EQUIPMENT
-
MARKET, BY INDUSTRY VERTICAL, 2024-2032 (USD MILLION) 18
-
EUROPE NON-DESTRUCTIVE
-
INSPECTION EQUIPMENT MARKET, BY COUNTRY, 2024-2032 (USD MILLION) 20
-
TABLE 8
-
EUROPE NON-DESTRUCTIVE INSPECTION EQUIPMENT MARKET, BY INDUSTRY VERTICAL, 2024-2032
-
(USD MILLION) 20
-
GERMANY NON-DESTRUCTIVE INSPECTION EQUIPMENT MARKET,
-
BY INDUSTRY VERTICAL, 2024-2032 (USD MILLION) 22
-
FRANCE NON-DESTRUCTIVE
-
INSPECTION EQUIPMENT MARKET, BY INDUSTRY VERTICAL, 2024-2032 (USD MILLION) 22
-
UK NON-DESTRUCTIVE INSPECTION EQUIPMENT MARKET, BY INDUSTRY VERTICAL,
-
RUSSIA NON-DESTRUCTIVE INSPECTION EQUIPMENT
-
MARKET, BY INDUSTRY VERTICAL, 2024-2032 (USD MILLION) 23
-
ITALY NON-DESTRUCTIVE
-
INSPECTION EQUIPMENT MARKET, BY INDUSTRY VERTICAL, 2024-2032 (USD MILLION) 24
-
REST OF EUROPE NON-DESTRUCTIVE INSPECTION EQUIPMENT MARKET, BY INDUSTRY
-
VERTICAL, 2024-2032 (USD MILLION) 24
-
ASIA-PACIFIC NON-DESTRUCTIVE
-
INSPECTION EQUIPMENT MARKET, BY COUNTRY, 2024-2032 (USD MILLION) 27
-
TABLE 16
-
ASIA-PACIFIC NON-DESTRUCTIVE INSPECTION EQUIPMENT MARKET, BY INDUSTRY VERTICAL,
-
CHINA NON-DESTRUCTIVE INSPECTION EQUIPMENT
-
MARKET, BY INDUSTRY VERTICAL, 2024-2032 (USD MILLION) 28
-
JAPAN NON-DESTRUCTIVE
-
INSPECTION EQUIPMENT MARKET, BY INDUSTRY VERTICAL, 2024-2032 (USD MILLION) 29
-
SOUTH KOREA NON-DESTRUCTIVE INSPECTION EQUIPMENT MARKET, BY INDUSTRY
-
VERTICAL, 2024-2032 (USD MILLION) 29
-
INDIA NON-DESTRUCTIVE INSPECTION
-
EQUIPMENT MARKET, BY INDUSTRY VERTICAL, 2024-2032 (USD MILLION) 30
-
TABLE 21
-
SOUTHEAST ASIA NON-DESTRUCTIVE INSPECTION EQUIPMENT MARKET, BY INDUSTRY VERTICAL,
-
(USD MILLION) 30
-
REST OF ASIA-PACIFIC NON-DESTRUCTIVE
-
INSPECTION EQUIPMENT MARKET, BY INDUSTRY VERTICAL, 2024-2032
-
(USD MILLION)
-
31
-
SOUTH AMERICA NON-DESTRUCTIVE INSPECTION EQUIPMENT MARKET, BY COUNTRY,
-
SOUTH AMERICA NON-DESTRUCTIVE INSPECTION
-
EQUIPMENT MARKET, BY INDUSTRY VERTICAL, 2024-2032 (USD MILLION) 33
-
TABLE 25
-
BRAZIL NON-DESTRUCTIVE INSPECTION EQUIPMENT MARKET, BY INDUSTRY VERTICAL, 2024-2032
-
(USD MILLION) 34
-
ARGENTINA NON-DESTRUCTIVE INSPECTION EQUIPMENT MARKET,
-
BY INDUSTRY VERTICAL, 2024-2032 (USD MILLION) 34
-
COLUMBIA NON-DESTRUCTIVE
-
INSPECTION EQUIPMENT MARKET, BY INDUSTRY VERTICAL, 2024-2032 (USD MILLION) 35
-
REST OF SOUTH AMERICA NON-DESTRUCTIVE INSPECTION EQUIPMENT MARKET, BY
-
INDUSTRY VERTICAL, 2024-2032
-
(USD MILLION) 35
-
MIDDLE EAST &
-
AFRICA NON-DESTRUCTIVE INSPECTION EQUIPMENT MARKET, BY COUNTRY, 2024-2032 (USD MILLION)
-
38
-
MIDDLE EAST & AFRICA NON-DESTRUCTIVE INSPECTION EQUIPMENT MARKET,
-
BY INDUSTRY VERTICAL, 2024-2032
-
(USD MILLION) 38
-
SAUDI ARABIA
-
NON-DESTRUCTIVE INSPECTION EQUIPMENT MARKET, BY INDUSTRY VERTICAL, 2024-2032 (USD
-
MILLION) 39
-
UAE NON-DESTRUCTIVE INSPECTION EQUIPMENT MARKET, BY INDUSTRY
-
VERTICAL, 2024-2032 (USD MILLION) 40
-
EGYPT NON-DESTRUCTIVE INSPECTION
-
EQUIPMENT MARKET, BY INDUSTRY VERTICAL, 2024-2032 (USD MILLION) 40
-
TABLE 34
-
NIGERIA NON-DESTRUCTIVE INSPECTION EQUIPMENT MARKET, BY INDUSTRY VERTICAL, 2024-2032
-
(USD MILLION) 41
-
SOUTH AFRICA NON-DESTRUCTIVE INSPECTION EQUIPMENT
-
MARKET, BY INDUSTRY VERTICAL, 2024-2032 (USD MILLION) 41
-
REST OF MIDDLE
-
EAST & AFRICA NON-DESTRUCTIVE INSPECTION EQUIPMENT MARKET, BY INDUSTRY VERTICAL,
-
RAILWAYS & TRASPORTATION MARKET ESTIMATES
-
& FORECAST, BY REGION, 2024-2032 (USD MILLION) 55
-
AEROSPACE &
-
DEFENSE MARKET ESTIMATES & FORECAST, BY REGION, 2024-2032 (USD MILLION) 56
-
OIL & GAS MARKET ESTIMATES & FORECAST, BY REGION, 2024-2032 (USD
-
MILLION) 56
-
POWER & ENERGY MARKET ESTIMATES & FORECAST, BY
-
REGION, 2024-2032 (USD MILLION) 57
-
HEALTHCARE MARKET ESTIMATES &
-
FORECAST, BY REGION, 2024-2032 (USD MILLION) 57
-
OTHERS MARKET ESTIMATES
-
& FORECAST, BY REGION, 2024-2032 (USD MILLION) 58
-
PROMAG TECHNOLOGIES
-
DEVELOPMENT LIMITED: PRODUCTS OFFERED 62
-
OKONDT GROUP: PRODUCTS OFFERED
-
63
-
LABQUIP (IRELAND) LIMITED: PRODUCTS OFFERED 64
-
MFE
-
INSPECTION SOLUTIONS: PRODUCTS OFFERED 65
-
TWI LTD: PRODUCTS OFFERED
-
67
-
STANLAY: PRODUCTS OFFERED 68
-
NEXXIS: PRODUCTS OFFERED
-
69
-
NON-DESTRUCTIVE TESTING (NDT) PRODUCTS LIMITED: PRODUCTS OFFERED
-
70
-
BAKER HUGHES COMPANY: PRODUCTS OFFERED 72
-
OLYMPUS
-
CORPORATION: PRODUCTS OFFERED 75
-
OLYMPUS CORPORATION: KEY DEVELOPMENTS
-
76
-
ZETEC, INC.: PRODUCTS OFFERED 77
-
ZETEC, INC.: KEY
-
DEVELOPMENTS 78
-
-
LIST OF FIGURES
-
GLOBAL NON-DESTRUCTIVE
-
INSPECTION EQUIPMENT MARKET, BY REGION, 2021 (% SHARE) 13
-
GLOBAL NON-DESTRUCTIVE
-
INSPECTION EQUIPMENT MARKET, BY REGION, 2024 VS 2032 (USD MILLION) 13
-
FIGURE
-
NORTH AMERICA NON-DESTRUCTIVE INSPECTION EQUIPMENT MARKET, BY COUNTRY, 2021 (%
-
SHARE) 15
-
AMERICA NON-DESTRUCTIVE INSPECTION EQUIPMENT MARKET, BY
-
COUNTRY, 2024 VS 2032 (USD MILLION) 15
-
NORTH AMERICA NON-DESTRUCTIVE
-
INSPECTION EQUIPMENT MARKET, BY INDUSTRY VERTICAL, 2024 VS 2032
-
(USD MILLION)
-
16
-
EUROPE NON-DESTRUCTIVE INSPECTION EQUIPMENT MARKET, BY COUNTRY,
-
EUROPE NON-DESTRUCTIVE INSPECTION EQUIPMENT MARKET,
-
BY COUNTRY, 2024 VS 2032 (USD MILLION) 19
-
EUROPE NON-DESTRUCTIVE INSPECTION
-
EQUIPMENT MARKET, BY INDUSTRY VERTICAL, 2024 VS 2032 (USD MILLION) 21
-
FIGURE
-
ASIA-PACIFIC NON-DESTRUCTIVE INSPECTION EQUIPMENT MARKET, BY COUNTRY, 2021 (%
-
SHARE) 26
-
ASIA-PACIFIC NON-DESTRUCTIVE INSPECTION EQUIPMENT MARKET,
-
BY COUNTRY, 2024 VS 2032 (USD MILLION) 26
-
ASIA-PACIFIC NON-DESTRUCTIVE
-
INSPECTION EQUIPMENT MARKET, BY INDUSTRY VERTICAL, 2024 VS 2032 (USD MILLION) 27
-
SOUTH AMERICA NON-DESTRUCTIVE INSPECTION EQUIPMENT MARKET, BY COUNTRY,
-
SOUTH AMERICA NON-DESTRUCTIVE INSPECTION EQUIPMENT
-
MARKET, BY COUNTRY, 2024 VS 2032 (USD MILLION) 32
-
SOUTH AMERICA NON-DESTRUCTIVE
-
INSPECTION EQUIPMENT MARKET, BY INDUSTRY VERTICAL, 2024 VS 2032
-
(USD MILLION)
-
33
-
MIDDLE EAST & AFRICA NON-DESTRUCTIVE INSPECTION EQUIPMENT
-
MARKET, BY COUNTRY, 2021 (% SHARE) 37
-
MIDDLE EAST & AFRICA NON-DESTRUCTIVE
-
INSPECTION EQUIPMENT MARKET, BY COUNTRY, 2024 VS 2032 (USD MILLION) 37
-
FIGURE
-
MIDDLE EAST & AFRICA NON-DESTRUCTIVE INSPECTION EQUIPMENT MARKET, BY INDUSTRY
-
VERTICAL, 2024 VS 2032
-
(USD MILLION) 38
-
MARKET DYNAMICS OVERVIEW
-
47
-
DRIVER IMPACT ANALYSIS 48
-
RESTRAINT IMPACT ANALYSIS
-
49
-
VALUE/SUPPLY CHAIN ANALYSIS 51
-
PORTER’S FIVE
-
FORCES MODEL: NON-DESTRUCTIVE INSPECTION EQUIPMENT MARKET 52
-
GLOBAL
-
NON-DESTRUCTIVE INSPECTION EQUIPMENT MARKET, BY INDUSTRY/APPLICATION, 2021 (% SHARE)
-
54
-
GLOBAL NON-DESTRUCTIVE INSPECTION EQUIPMENT MARKET, BY INDUSTRY/APPLICATION,
-
GLOBAL NON-DESTRUCTIVE INSPECTION EQUIPMENT
-
MARKET, BY CUSTOMER ANALYSIS, 2021 (% SHARE) 58
-
BAKER HUGHES COMPANY:
-
FINANCIAL OVERVIEW SNAPSHOT 71
-
BAKER HUGHES COMPANY: SWOT ANALYSIS
-
73
-
OLYMPUS CORPORATION: FINANCIAL OVERVIEW SNAPSHOT 75
-
FIGURE
-
OLYMPUS CORPORATION: SWOT ANALYSIS 76
-
MAJOR MANUFACTURER MARKET
-
SHARE ANALYSIS (%), 2021 79


Leave a Comment