• Cat-intel
  • MedIntelliX
  • Resources
  • About Us
  • Hero Background
    English
    Chinese
    French
    Japanese
    Korean
    German
    Spanish

    Silver Market Size

    ID: MRFR/CnM/6530-HCR
    111 Pages
    Chitranshi Jaiswal
    October 2025

    Silver Market Research Report By Application (Jewelry, Electronics, Coins and Medals, Photography, Industrial Manufacturing), By End Use Industry (Consumer Goods, Automotive, Medical, Solar Energy, Telecommunications), By Form (Bars, Coins, Powder, Foil, Wire), By Purity (Sterling Silver, Fine Silver, Coin Silver) and By Regional (North America, Europe, South America, Asia Pacific, Middle East ...

    Share:
    Download PDF ×

    We do not share your information with anyone. However, we may send you emails based on your report interest from time to time. You may contact us at any time to opt-out.

    Silver Market Infographic
    $ 4,950.0
    $ 5,950.0
    $ 7,250.0

    Silver Size

    Silver Market Growth Projections and Opportunities

    The silver market is influenced by various factors that shape its dynamics and determine its performance. These market factors encompass a wide range of economic, geopolitical, and industrial variables that collectively impact the supply, demand, and price of silver. One of the primary market factors affecting the silver market is industrial demand. Silver is widely used in various industrial applications, including electronics, solar panels, and medical devices. Therefore, fluctuations in industrial production and technological advancements can significantly influence the demand for silver. For instance, increased adoption of renewable energy technologies like solar panels can drive up the demand for silver due to its use in photovoltaic cells. Silver (Ag) is a white, soft, and lustrous transition metal with atomic number 47. This metal possesses the highest thermal and electrical conductivity as compared to other metals. In addition, it exhibits high reflectivity, malleability, and ductility. It is harder than other precious metals and is obtained either from the earth’s crust as an alloy with gold and other metals, or from minerals, e.g., chlorargyrite. In many cases, silver is produced as a byproduct of gold, zinc, copper, and lead refining. It is one of the precious metals and finds application in jewelry, silverware, and photographic films, among others. Unlike other precious metals, silver is easily oxidized to form an oxide layer on silverware and jewelry. In addition to industrial demand, investor sentiment plays a crucial role in the silver market. Silver is considered both a precious metal and a commodity, making it a popular choice for investors seeking safe-haven assets or portfolio diversification. Economic indicators, geopolitical tensions, and monetary policies can influence investor sentiment towards silver as a store of value. For example, during times of economic uncertainty or inflationary pressures, investors may flock to silver as a hedge against currency depreciation and financial instability, leading to increased demand and higher prices. Moreover, the supply dynamics of silver also impact its market performance. Silver is primarily mined as a by-product of base metal mining, such as copper, lead, and zinc. Therefore, fluctuations in base metal prices and mining activity can affect the supply of silver. Additionally, geopolitical factors, environmental regulations, and labor disputes in major silver-producing countries can disrupt supply chains and constrain silver production. Furthermore, recycling and scrap supply contribute to the overall availability of silver in the market, with recycling rates influenced by factors like silver prices and technological advancements in recycling processes. Furthermore, currency movements and inflationary pressures influence the price of silver in global markets. As silver is traded in US dollars, fluctuations in the value of the dollar relative to other currencies can impact the affordability and attractiveness of silver for international buyers. Moreover, inflationary pressures erode the purchasing power of fiat currencies, leading investors to seek alternative stores of value like silver and gold. Therefore, expectations regarding future inflation rates and central bank policies can influence investor demand for silver as an inflation hedge. Additionally, macroeconomic factors such as global economic growth and trade dynamics play a significant role in shaping the silver market. Economic expansions tend to drive up industrial demand for silver, particularly in sectors like electronics and automotive manufacturing. Conversely, economic downturns or trade tensions can dampen industrial activity and reduce the demand for silver. Moreover, changes in trade policies and tariffs can disrupt global supply chains and impact the flow of silver-containing products across borders, affecting both demand and supply dynamics in the silver market.

    Silver Market Size Graph

    Market Summary

    As per Market Research Future Analysis, the Global Silver Market was valued at 20.45 USD Billion in 2023 and is projected to grow to 30 USD Billion by 2035, with a CAGR of 3.24% from 2025 to 2035. Key drivers include rising demand in electronics, renewable energy applications, and increased investment in precious metals. The market is characterized by diverse applications across jewelry, electronics, and industrial manufacturing, reflecting silver's versatility and cultural significance.

    Key Market Trends & Highlights

    The Global Silver Market is witnessing transformative trends driven by technological advancements and sustainability.

    • The Electronics sector is expected to account for approximately 25% of total silver demand by 2030. The Jewelry Application is projected to grow from 7.0 USD Billion in 2024 to 10.0 USD Billion by 2035. Investment demand for silver products increased by 10% year-on-year, highlighting its appeal as a hedge against inflation. North America is expected to lead the market with a valuation of 8.0 USD Billion in 2024, growing to 11.5 USD Billion by 2035.

    Market Size & Forecast

    2023 Market Size USD 20.45 Billion
    2024 Market Size USD 21.11 Billion
    2035 Market Size USD 30 Billion
    CAGR (2025-2035) 3.24%
    Largest Regional Market Share in 2024 North America.

    Major Players

    <p>Key Companies include Stillwater Mining, Hecla Mining, Great Panther Mining, Endeavour Silver, Wheaton Precious Metals, Pan American Silver, Silvercorp Metals, Coeur Mining, and First Majestic Silver.</p>

    Market Trends

    The worldwide silver market has a lot of potential for growth, including the possibility of expanding silver recycling programs.

    As people become more mindful of sustainability, recycling silver from electronic trash is a good way to fulfil increased demand while having less of an effect on the environment. Also, as disposable incomes rise and cultural significance stays strong, silver used for jewellery and investment is growing in developing economies. Recently, there has been much interest in silver as a way to protect against inflation and economic instability. As the economy becomes worse, more and more investors are turning to precious metals, like silver, as a secure place to put their money.

    This tendency is part of a bigger change in how people invest. With currencies changing and inflation rising, more people are seeking real assets.

    The  Silver Market is changing because of a mix of industrial demand, opportunities that concentrate on sustainability, and changing investment habits.


    <p>The global silver market appears to be experiencing a resurgence in demand, driven by increasing industrial applications and a growing interest in sustainable investment options.</p>

    U.S. Geological Survey

    Silver Market Market Drivers

    Market Trends and Charts

    Technological Advancements

    Technological advancements are poised to reshape the Global Silver Market Industry in various ways. Innovations in extraction and refining processes enhance the efficiency of silver production, potentially lowering costs and increasing supply. Moreover, advancements in applications such as nanotechnology and medical devices are expanding the scope of silver's utility. For example, silver nanoparticles are increasingly used in wound dressings due to their antibacterial properties. As these technologies continue to develop, they may contribute to a more robust market, with projections indicating a growth trajectory that could see the Global Silver Market reach 30 USD Billion by 2035.

    Increasing Industrial Demand

    The Global Silver Market Industry experiences a notable surge in industrial demand, driven by silver's unique properties such as high conductivity and reflectivity. Industries such as electronics, solar energy, and automotive increasingly utilize silver in their manufacturing processes. For instance, the solar panel industry relies heavily on silver for its photovoltaic cells, which are essential for converting sunlight into electricity. This growing industrial application is projected to contribute significantly to the market's expansion, with the Global Silver Market expected to reach 21.1 USD Billion in 2024. As industries continue to innovate and expand, the demand for silver is likely to increase, further solidifying its role in the global economy.

    Investment Demand Fluctuations

    Investment demand plays a crucial role in shaping the Global Silver Market Industry. Investors often turn to silver as a hedge against inflation and economic uncertainty. The appeal of silver as a tangible asset is particularly pronounced during periods of market volatility. In 2024, the market is anticipated to reach 21.1 USD Billion, reflecting a growing interest among investors. Furthermore, as financial markets evolve, the potential for silver to serve as a safe haven investment may drive demand even higher. This trend suggests that fluctuations in investment demand could significantly impact the overall dynamics of the Global Silver Market.

    Growing Demand in Renewable Energy

    The Global Silver Market Industry is significantly influenced by the growing demand for renewable energy solutions. Silver's critical role in solar energy technologies, particularly in photovoltaic cells, positions it as a key component in the transition to sustainable energy sources. As governments and organizations worldwide commit to reducing carbon emissions, the demand for solar panels is expected to rise. This trend is likely to bolster the silver market, with projections indicating a compound annual growth rate of 3.25% from 2025 to 2035. The increasing focus on renewable energy could thus serve as a vital driver for the Global Silver Market.

    Regulatory and Environmental Factors

    Regulatory and environmental factors are increasingly shaping the Global Silver Market Industry. Stricter regulations regarding mining practices and environmental sustainability are prompting companies to adopt more responsible sourcing and production methods. This shift may lead to increased operational costs but could also enhance the market's long-term viability. Governments are implementing policies to promote sustainable mining practices, which may influence supply dynamics. As the industry adapts to these regulations, the Global Silver Market is likely to experience shifts in production and pricing, reflecting the growing emphasis on environmental stewardship.

    Market Segment Insights

    Silver Market Application Insights

    <p>The Application segment of the &nbsp;Silver Market plays a crucial role in driving the overall market dynamics and contributes significantly to its valuation. In 2024, this market is expected to be valued at around 21.11 USD Billion, showcasing a robust foundation for growth. The segment is comprised of several key applications, namely Jewelry, Electronics, Coins and Medals, Photography, and Industrial Manufacturing, each contributing distinctively to the market's overall performance. Notably, the Jewelry application dominates this segment, valued at 7.0 USD Billion in 2024, owing to the timeless appeal of silver in high-end fashion and personal adornments.</p>

    <p>Furthermore, Jewelry is projected to grow to a remarkable 10.0 USD Billion by 2035, indicating a strong consumer preference for silver in ornamental designs.In addition to Jewelry, the Electronics sector stands as another critical pillar, valued at 6.0 USD Billion in 2024. Silver's exceptional electrical conductivity makes it indispensable in the production of various electronic components and devices. This application is anticipated to see continued growth, reaching approximately 8.5 USD Billion in 2035, driven by increasing demand for advanced electronic systems and consumer electronics.</p>

    <p>The Coins and Medals category, valued at 4.0 USD Billion initially, reflects the significance of silver in collectibles, commemorative items, and investments, with an expected rise to 5.5 USD Billion by 2035. This segment remains popular among investors and collectors, thus reinforcing its importance in the overall market structure.The Photography segment, while smaller, reflects silver's historical significance, holding a value of 2.5 USD Billion in 2024. This application's relevance is driven by the revival of traditional photography methods, which have sparked an interest in silver-based products like film and developing solutions.</p>

    Silver Market End Use Industry Insights

    <p>The &nbsp;Silver Market, particularly in the End Use Industry, has shown a robust valuation, reaching approximately 21.11 USD Billion in 2024. This segment includes various applications which are pivotal in driving market growth. The Consumer Goods sector significantly utilizes silver in jewelry and electronics due to its excellent conductivity and antimicrobial properties. Meanwhile, the Automotive industry leverages silver in various components, including electrical connections and batteries, enhancing efficiency and performance.</p>

    <p>The Medical sector relies heavily on silver for its bactericidal properties, making it vital in wound care and medical devices.Moreover, the Solar Energy segment stands out as silver plays a critical role in enhancing photovoltaic cells' efficiency, contributing to the renewable energy drive. In Telecommunications, silver is essential in connectors and circuits, ensuring reliable communication. The steady demand across these industries suggests a healthy growth trajectory for the &nbsp;Silver Market, with optimistic trends emphasizing innovation and sustainability, thereby solidifying silver's role across diverse applications.</p>

    <p>As industries evolve, the &nbsp;Silver Market statistics highlight the increasing integration of silver, underscoring opportunities for future expansion.</p>

    Silver Market Form Insights

    <p>The &nbsp;Silver Market, particularly in the Form segment, plays a crucial role in the overall industry dynamics. By 2024, this segment is expected to contribute significantly to the estimated market value of 21.11 billion USD. The diverse offerings within this segment include Bars, Coins, Powder, Foil, and Wire, each serving distinct purposes across various industries.</p>

    <p>Bars are often favored for investment purposes due to their purity and ease of storage, while Coins hold appeal for both collectors and investors alike, reflecting the cultural significance and historical value of silver.The Powder form is integral to the electronics and chemical industries, demonstrating silver's versatility. Foil and Wire are vital in sectors such as jewelry and electrical applications, emphasizing their importance in production. As the market evolves, trends such as increased demand for eco-friendly products and technological advancements in production processes are expected to drive the growth in this segment.</p>

    <p>Overall, the &nbsp;Silver Market segmentation reflects the broad utility and enduring value of silver, positioning it as a key asset in various sectors.</p>

    Silver Market Purity Insights

    <p>The &nbsp;Silver Market, particularly within the Purity segment, showcases significant diversity and opportunity. In 2024, this market was valued at approximately 21.11 billion USD and is projected to grow as consumer preferences evolve. The market's segmentation includes notable categories such as Sterling Silver, Fine Silver, and Coin Silver. Sterling Silver is widely favored due to its durability and aesthetic appeal, making it a popular choice in jewelry and tableware. Fine Silver, known for its 99.9% purity, is often sought after for investment and craftsmanship.Coin Silver, traditionally used in coinage, has historical significance and remains valued among collectors.</p>

    <p>The shift towards sustainable and ethically sourced materials is influencing purchasing patterns, presenting opportunities for growth within the &nbsp;Silver Market. Increasing demand in sectors like electronics and solar energy also contributes to market dynamics. &nbsp;Silver Market statistics indicate a steady interest from investors and manufacturers, fostering a competitive landscape that encourages innovation and product differentiation.Overall, the Purity segment continues to play a crucial role in the broader &nbsp;Silver Market revenue stream, illustrating its importance in various applications.</p>

    Get more detailed insights about Silver Market Research Report - Global Forecast Till 2035

    Regional Insights

    The Regional segment of the  Silver Market is diverse, showcasing significant ownership across various geographies. In 2024, North America leads with a market valuation of 6.8 USD Billion, expected to grow to 9.4 USD Billion by 2035, reflecting its majority holding in the market. Europe follows with a valuation of 5.25 USD Billion in 2024 and is projected to reach 7.0 USD Billion, underlining its critical role in the  Silver Market industry.

    The Asia Pacific region exhibits substantial growth potential, starting at 5.3 USD Billion in 2024 and anticipated to escalate to 8.4 USD Billion, driven by industrial demand and technological advancements.South America stands at 2.5 USD Billion in 2024, growing to 3.4 USD Billion, which demonstrates opportunities in mining and sustainable practices. Lastly, the Middle East and Africa, with a market size of 1.26 USD Billion in 2024, expected to rise to 1.8 USD Billion, while smaller, highlights emerging investment opportunities in the region.

    Overall, each region presents unique dynamics and growth drivers, significantly contributing to the  Silver Market revenue, influenced by factors such as industrial applications, jewelry demand, and investment trends.

    Silver Market Regional

    Source: Primary Research, Secondary Research, Market Research Future Database and Analyst Review

    Key Players and Competitive Insights

    The  Silver Market presents a complex landscape characterized by various players, each vying for a significant foothold in the industry. The competition is driven by factors such as demand in industrial applications, investment interests, and jewelry consumption, alongside the fluctuating prices linked to broader economic conditions. Geographical distribution of production, technological advancements in mining processes, and sustainability efforts also significantly shape competitive dynamics. Key market players are not only focusing on extraction but are also strengthening their market positions through strategic partnerships, mergers, and acquisitions, enhancing their capabilities to meet diverse consumer needs.

    Understanding these insights provides clarity on the overall trends shaping the competitive environment.Fortuna Silver Mines has established itself as a prominent player within the  Silver Market, leveraging its operational expertise and production capabilities. The company focuses on acquiring and developing silver mines with a strong emphasis on sustainable practices. Fortuna Silver Mines operates in various regions, producing high-quality silver along with other metals such as gold and base metals. Their commitment to responsible mining and efficient resource management has bolstered their reputation, enabling them to withstand market volatility.

    The company’s robust pipeline of projects and ongoing exploration initiatives signify its potential for growth in the silver sector, reinforcing its strong competitive position.

    Key Companies in the Silver Market market include

    Industry Developments

    • Q2 2024: Silver miner M&A heats up as growth comes into focus Vizsla Silver acquired the producing Santa Fe Mine in western Mexico, expanding its land position along the Sinaloa Silver Belt. Dolly Varden Silver entered a definitive agreement to acquire MTB Metals’ interests in four properties totaling over 20,000 hectares in the Golden Triangle, B.C.[1]
    • Q2 2024: Silver miner M&A heats up as growth comes into focus Dolly Varden Silver announced the acquisition of Hecla’s Kinskuch property and a deal to acquire Strikepoint’s interest in the Porter Project, further consolidating its position in the Golden Triangle region of British Columbia.[1]
    • Q2 2024: Silver miner M&A heats up as growth comes into focus Vizsla Silver signed an agreement to acquire the past-producing La Garra-Metates district in March 2024 and the San Enrique prospect in April 2024, strengthening its portfolio in western Mexico.[1]
    • Q2 2025: Pan American Silver Announces Agreement to Acquire MAG Silver Corp. Pan American Silver announced an agreement to acquire MAG Silver Corp., adding strategic interest in the tier-one Juanicipio silver mine and strengthening its portfolio of high-margin silver assets.[4]
    • Q1 2025: Acquisition | GATOS SILVER INC | 16th January 2025 First Majestic Silver Corp. entered into an agreement to acquire all issued and outstanding shares of Gatos Silver Inc., with the transaction expected to close on January 16, 2025, following shareholder approval.[5]
    • Q2 2025: First Majestic Silver Corp.: Leveraging Acquisitions and Exploration to Outperform in 2025 First Majestic Silver Corp. completed the acquisition of the Los Gatos Silver Mine in late 2024, which contributed 2.4 million silver equivalent ounces in Q2 2025 and marked the mine’s first zinc and lead shipments.[3]
    • Q3 2025: Completion of Silver Acquisition & Appointment of New Managing Director Rapid Critical Metals completed the acquisition of Silver Metal Group's subsidiaries and appointed Byron Miles as Managing Director, effective July 24, 2025.[2]

    Future Outlook

    Silver Market Future Outlook

    <p>The Global Silver Market is projected to grow at a 3.25% CAGR from 2024 to 2035, driven by industrial demand, renewable energy applications, and investment trends.</p>

    New opportunities lie in:

    • <p>Expand silver recycling initiatives to meet rising demand sustainably. Invest in silver-based technologies for renewable energy solutions. Develop innovative silver applications in electronics and healthcare sectors.</p>

    <p>By 2035, the Global Silver Market is expected to solidify its position as a key player in various industries.</p>

    Market Segmentation

    Silver Market Form Outlook

    • Bars
    • Coins
    • Powder
    • Foil
    • Wire

    Silver Market Purity Outlook

    • Sterling Silver
    • Fine Silver
    • Coin Silver

    Silver Market Regional Outlook

    • North America
    • Europe
    • South America
    • Asia Pacific
    • Middle East and Africa

    Silver Market Application Outlook

    • Jewelry
    • Electronics
    • Coins and Medals
    • Photography
    • Industrial Manufacturing

    Silver Market End Use Industry Outlook

    • Consumer Goods
    • Automotive
    • Medical
    • Solar Energy
    • Telecommunications

    Report Scope

    Report Attribute/MetricDetails
    Market Size 202320.45(USD Billion)
    Market Size 202421.11(USD Billion)
    Market Size 203530.0(USD Billion)
    Compound Annual Growth Rate (CAGR)3.25% (2025 - 2035)
    Report CoverageRevenue Forecast, Competitive Landscape, Growth Factors, and Trends
    Base Year2024
    Market Forecast Period2025 - 2035
    Historical Data2019 - 2024
    Market Forecast UnitsUSD Billion
    Key Companies ProfiledFortuna Silver Mines, Silvercorp Metals, Hecla Mining, Coeur Mining, First Majestic Silver, Pan American Silver, MAG Silver, Great Panther Mining, Endeavour Silver,
    Segments CoveredApplication, End Use Industry, Form, Purity, Regional
    Key Market OpportunitiesRising demand for solar panels, Increased industrial applications, Growth in jewelry demand, Investment in silver bullion, Sustainable mining practices advancement
    Key Market DynamicsInvestment demand fluctuations, Industrial applications growth, Mining production variations, Currency value changes, Technological innovations impact
    Countries CoveredNorth America, Europe, APAC, South America, MEA

    Market Highlights

    Author

    Chitranshi Jaiswal
    Research Analyst Level I

    She holds an experience of about 6+ years in market research and business consulting, working under the spectrum of information communication technology, telecommunications and semiconductor domains. aarti conceptualizes and implements a scalable business strategy and provides strategic leadership to the clients. her expertise lies in market estimation, competitive intelligence, pipeline analysis, customer assessment, etc.

    Leave a Comment

    Latest Comments

    John Doe
    john@example.com

    This is a great article! Really helped me understand the topic better.

    Posted on July 23, 2025, 10:15 AM
    Jane Smith
    jane@domain.com

    Thanks for sharing this. I’ve bookmarked it for later reference.

    Posted on July 22, 2025, 7:45 PM

    FAQs

    What is the expected market size of the Silver Market in 2024?

    The Silver Market is expected to be valued at 21.11 USD billion in 2024.

    What will the Silver Market be valued at by 2035?

    By 2035, the Silver Market is projected to reach a value of 30.0 USD billion.

    What is the anticipated CAGR for the Silver Market from 2025 to 2035?

    The expected CAGR for the Silver Market from 2025 to 2035 is 3.25%.

    Which region is expected to dominate the Silver Market by 2035?

    North America is expected to dominate the Silver Market with a valuation of 9.4 USD billion by 2035.

    What market value will the Jewelry segment of the Silver Market hold in 2035?

    The Jewelry segment is projected to be valued at 10.0 USD billion in 2035.

    What is the forecasted market size for the Electronics application in the Silver Market by 2035?

    The Electronics application is expected to reach a market size of 8.5 USD billion by 2035.

    Who are the key players in the Silver Market?

    Major players in the market include Fortuna Silver Mines, Hecla Mining, Coeur Mining, and Pan American Silver.

    What is the expected market value of the Industrial Manufacturing segment in 2035?

    The Industrial Manufacturing segment is projected to hold a market value of 2.5 USD billion in 2035.

    How much will the South American market be valued at in 2035?

    The South American market is expected to be valued at 3.4 USD billion by 2035.

    What challenges could impact the growth of the Silver Market?

    Challenges such as fluctuating silver prices and geopolitical tensions may impact the growth of the Silver Market.

    1. --- "Table of Contents
    2. Executive Summary 
      1. Market Overview 
      2. Key Findings 
      3. Market Segmentation 
      4. Competitive Landscape 
      5. Challenges and Opportunities 
      6. Future Outlook
    3. Market Introduction 
      1. Definition 
      2. Scope of the Study 
        1. Research Objective 
        2. Assumption 
        3. Limitations 
    4. Research Methodology 
      1. Overview 
      2. Data Mining 
      3. Secondary Research 
      4. Primary Research 
        1. Primary Interviews and Information Gathering Process 
        2. Breakdown of Primary Respondents 
      5. Forecasting Model 
      6. Market Size Estimation 
        1. Bottom-up Approach 
        2. Top-Down Approach 
      7. Data Triangulation 
      8. Validation
    5. MARKET DYNAMICS 
      1. Overview 
      2. Drivers 
      3. Restraints 
      4. Opportunities 
    6. MARKET FACTOR ANALYSIS 
      1. Value chain Analysis 
      2. Porter's Five Forces Analysis 
        1. Bargaining Power of Suppliers 
        2. Bargaining Power of Buyers 
        3. Threat of New Entrants 
        4. Threat of Substitutes 
        5. Intensity of Rivalry 
      3. COVID-19 Impact Analysis 
        1. Market Impact Analysis 
        2. Regional Impact 
        3. Opportunity and Threat Analysis
    7. SILVER MARKET, BY APPLICATION (USD BILLION) 
      1. Jewelry 
      2. Electronics 
      3. Coins and Medals 
      4. Photography 
      5. Industrial Manufacturing 
    8. SILVER MARKET, BY END USE INDUSTRY (USD BILLION) 
      1. Consumer Goods 
      2. Automotive 
      3. Medical 
      4. Solar Energy 
      5. Telecommunications 
    9. SILVER MARKET, BY FORM (USD BILLION) 
      1. Bars 
      2. Coins 
      3. Powder 
      4. Foil 
      5. Wire 
    10. SILVER MARKET, BY PURITY (USD BILLION) 
      1. Sterling Silver 
      2. Fine Silver 
      3. Coin Silver 
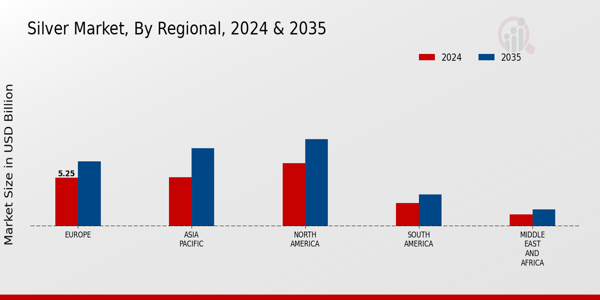
    11. SILVER MARKET, BY REGIONAL (USD BILLION) 
      1. North America 
        1. US 
        2. Canada 
      2. Europe 
        1. Germany 
        2. UK 
        3. France 
        4. Russia 
        5. Italy 
        6. Spain 
        7. Rest of Europe 
      3. APAC 
        1. China 
        2. India 
        3. Japan 
        4. South Korea 
        5. Malaysia 
        6. Thailand 
        7. Indonesia 
        8. Rest of APAC 
      4. South America 
        1. Brazil 
        2. Mexico 
        3. Argentina 
        4. Rest of South America 
      5. MEA 
        1. GCC Countries 
        2. South Africa 
        3. Rest of MEA
    12. Competitive Landscape 
      1. Overview 
      2. Competitive Analysis 
      3. Market share Analysis 
      4. Major Growth Strategy in the Silver Market 
      5. Competitive Benchmarking 
      6. Leading Players in Terms of Number of Developments in the Silver Market 
      7. Key developments and growth strategies 
        1. New Product Launch/Service Deployment 
        2. Merger & Acquisitions 
        3. Joint Ventures 
      8. Major Players Financial Matrix 
        1. Sales and Operating Income 
        2. Major Players R&D Expenditure. 2023 
    13. COMPANY PROFILES 
      1. Fortuna Silver Mines 
        1. Financial Overview 
        2. Products Offered 
        3. Key Developments 
        4. SWOT Analysis 
        5. Key Strategies 
      2. Torex Gold Resources 
        1. Financial Overview 
        2. Products Offered 
        3. Key Developments 
        4. SWOT Analysis 
        5. Key Strategies 
      3. Silvercorp Metals 
        1. Financial Overview 
        2. Products Offered 
        3. Key Developments 
        4. SWOT Analysis 
        5. Key Strategies 
      4. Eastmain Resources 
        1. Financial Overview 
        2. Products Offered 
        3. Key Developments 
        4. SWOT Analysis 
        5. Key Strategies 
      5. Hecla Mining 
        1. Financial Overview 
        2. Products Offered 
        3. Key Developments 
        4. SWOT Analysis 
        5. Key Strategies 
      6. Coeur Mining 
        1. Financial Overview 
        2. Products Offered 
        3. Key Developments 
        4. SWOT Analysis 
        5. Key Strategies 
      7. First Majestic Silver 
        1. Financial Overview 
        2. Products Offered 
        3. Key Developments 
        4. SWOT Analysis 
        5. Key Strategies 
      8. Pan American Silver 
        1. Financial Overview 
        2. Products Offered 
        3. Key Developments 
        4. SWOT Analysis 
        5. Key Strategies 
      9. Wheaton Precious Metals 
        1. Financial Overview 
        2. Products Offered 
        3. Key Developments 
        4. SWOT Analysis 
        5. Key Strategies 
      10. MAG Silver 
        1. Financial Overview 
        2. Products Offered 
        3. Key Developments 
        4. SWOT Analysis 
        5. Key Strategies 
      11. Great Panther Mining 
        1. Financial Overview 
        2. Products Offered 
        3. Key Developments 
        4. SWOT Analysis 
        5. Key Strategies 
      12. Silver Wheaton 
        1. Financial Overview 
        2. Products Offered 
        3. Key Developments 
        4. SWOT Analysis 
        5. Key Strategies 
      13. Endeavour Silver 
        1. Financial Overview 
        2. Products Offered 
        3. Key Developments 
        4. SWOT Analysis 
        5. Key Strategies 
      14. Sierra Metals 
        1. Financial Overview 
        2. Products Offered 
        3. Key Developments 
        4. SWOT Analysis 
        5. Key Strategies 
      15. Agnico Eagle Mines 
        1. Financial Overview 
        2. Products Offered 
        3. Key Developments 
        4. SWOT Analysis 
        5. Key Strategies 
    14. APPENDIX 
      1. References 
      2. Related Reports 
    15. List of Tables and Figures
      1. LIST OF TABLES
      2. TABLE 1. LIST OF ASSUMPTIONS 
      3. TABLE 2. NORTH AMERICA SILVER MARKET SIZE ESTIMATES & FORECAST, BY APPLICATION, 2019-2035 (USD BILLIONS) 
      4. TABLE 3. NORTH AMERICA SILVER MARKET SIZE ESTIMATES & FORECAST, BY END USE INDUSTRY, 2019-2035 (USD BILLIONS) 
      5. TABLE 4. NORTH AMERICA SILVER MARKET SIZE ESTIMATES & FORECAST, BY FORM, 2019-2035 (USD BILLIONS) 
      6. TABLE 5. NORTH AMERICA SILVER MARKET SIZE ESTIMATES & FORECAST, BY PURITY, 2019-2035 (USD BILLIONS) 
      7. TABLE 6. NORTH AMERICA SILVER MARKET SIZE ESTIMATES & FORECAST, BY REGIONAL, 2019-2035 (USD BILLIONS) 
      8. TABLE 7. US SILVER MARKET SIZE ESTIMATES & FORECAST, BY APPLICATION, 2019-2035 (USD BILLIONS) 
      9. TABLE 8. US SILVER MARKET SIZE ESTIMATES & FORECAST, BY END USE INDUSTRY, 2019-2035 (USD BILLIONS) 
      10. TABLE 9. US SILVER MARKET SIZE ESTIMATES & FORECAST, BY FORM, 2019-2035 (USD BILLIONS) 
      11. TABLE 10. US SILVER MARKET SIZE ESTIMATES & FORECAST, BY PURITY, 2019-2035 (USD BILLIONS) 
      12. TABLE 11. US SILVER MARKET SIZE ESTIMATES & FORECAST, BY REGIONAL, 2019-2035 (USD BILLIONS) 
      13. TABLE 12. CANADA SILVER MARKET SIZE ESTIMATES & FORECAST, BY APPLICATION, 2019-2035 (USD BILLIONS) 
      14. TABLE 13. CANADA SILVER MARKET SIZE ESTIMATES & FORECAST, BY END USE INDUSTRY, 2019-2035 (USD BILLIONS) 
      15. TABLE 14. CANADA SILVER MARKET SIZE ESTIMATES & FORECAST, BY FORM, 2019-2035 (USD BILLIONS) 
      16. TABLE 15. CANADA SILVER MARKET SIZE ESTIMATES & FORECAST, BY PURITY, 2019-2035 (USD BILLIONS) 
      17. TABLE 16. CANADA SILVER MARKET SIZE ESTIMATES & FORECAST, BY REGIONAL, 2019-2035 (USD BILLIONS) 
      18. TABLE 17. EUROPE SILVER MARKET SIZE ESTIMATES & FORECAST, BY APPLICATION, 2019-2035 (USD BILLIONS) 
      19. TABLE 18. EUROPE SILVER MARKET SIZE ESTIMATES & FORECAST, BY END USE INDUSTRY, 2019-2035 (USD BILLIONS) 
      20. TABLE 19. EUROPE SILVER MARKET SIZE ESTIMATES & FORECAST, BY FORM, 2019-2035 (USD BILLIONS) 
      21. TABLE 20. EUROPE SILVER MARKET SIZE ESTIMATES & FORECAST, BY PURITY, 2019-2035 (USD BILLIONS) 
      22. TABLE 21. EUROPE SILVER MARKET SIZE ESTIMATES & FORECAST, BY REGIONAL, 2019-2035 (USD BILLIONS) 
      23. TABLE 22. GERMANY SILVER MARKET SIZE ESTIMATES & FORECAST, BY APPLICATION, 2019-2035 (USD BILLIONS) 
      24. TABLE 23. GERMANY SILVER MARKET SIZE ESTIMATES & FORECAST, BY END USE INDUSTRY, 2019-2035 (USD BILLIONS) 
      25. TABLE 24. GERMANY SILVER MARKET SIZE ESTIMATES & FORECAST, BY FORM, 2019-2035 (USD BILLIONS) 
      26. TABLE 25. GERMANY SILVER MARKET SIZE ESTIMATES & FORECAST, BY PURITY, 2019-2035 (USD BILLIONS) 
      27. TABLE 26. GERMANY SILVER MARKET SIZE ESTIMATES & FORECAST, BY REGIONAL, 2019-2035 (USD BILLIONS) 
      28. TABLE 27. UK SILVER MARKET SIZE ESTIMATES & FORECAST, BY APPLICATION, 2019-2035 (USD BILLIONS) 
      29. TABLE 28. UK SILVER MARKET SIZE ESTIMATES & FORECAST, BY END USE INDUSTRY, 2019-2035 (USD BILLIONS) 
      30. TABLE 29. UK SILVER MARKET SIZE ESTIMATES & FORECAST, BY FORM, 2019-2035 (USD BILLIONS) 
      31. TABLE 30. UK SILVER MARKET SIZE ESTIMATES & FORECAST, BY PURITY, 2019-2035 (USD BILLIONS) 
      32. TABLE 31. UK SILVER MARKET SIZE ESTIMATES & FORECAST, BY REGIONAL, 2019-2035 (USD BILLIONS) 
      33. TABLE 32. FRANCE SILVER MARKET SIZE ESTIMATES & FORECAST, BY APPLICATION, 2019-2035 (USD BILLIONS) 
      34. TABLE 33. FRANCE SILVER MARKET SIZE ESTIMATES & FORECAST, BY END USE INDUSTRY, 2019-2035 (USD BILLIONS) 
      35. TABLE 34. FRANCE SILVER MARKET SIZE ESTIMATES & FORECAST, BY FORM, 2019-2035 (USD BILLIONS) 
      36. TABLE 35. FRANCE SILVER MARKET SIZE ESTIMATES & FORECAST, BY PURITY, 2019-2035 (USD BILLIONS) 
      37. TABLE 36. FRANCE SILVER MARKET SIZE ESTIMATES & FORECAST, BY REGIONAL, 2019-2035 (USD BILLIONS) 
      38. TABLE 37. RUSSIA SILVER MARKET SIZE ESTIMATES & FORECAST, BY APPLICATION, 2019-2035 (USD BILLIONS) 
      39. TABLE 38. RUSSIA SILVER MARKET SIZE ESTIMATES & FORECAST, BY END USE INDUSTRY, 2019-2035 (USD BILLIONS) 
      40. TABLE 39. RUSSIA SILVER MARKET SIZE ESTIMATES & FORECAST, BY FORM, 2019-2035 (USD BILLIONS) 
      41. TABLE 40. RUSSIA SILVER MARKET SIZE ESTIMATES & FORECAST, BY PURITY, 2019-2035 (USD BILLIONS) 
      42. TABLE 41. RUSSIA SILVER MARKET SIZE ESTIMATES & FORECAST, BY REGIONAL, 2019-2035 (USD BILLIONS) 
      43. TABLE 42. ITALY SILVER MARKET SIZE ESTIMATES & FORECAST, BY APPLICATION, 2019-2035 (USD BILLIONS) 
      44. TABLE 43. ITALY SILVER MARKET SIZE ESTIMATES & FORECAST, BY END USE INDUSTRY, 2019-2035 (USD BILLIONS) 
      45. TABLE 44. ITALY SILVER MARKET SIZE ESTIMATES & FORECAST, BY FORM, 2019-2035 (USD BILLIONS) 
      46. TABLE 45. ITALY SILVER MARKET SIZE ESTIMATES & FORECAST, BY PURITY, 2019-2035 (USD BILLIONS) 
      47. TABLE 46. ITALY SILVER MARKET SIZE ESTIMATES & FORECAST, BY REGIONAL, 2019-2035 (USD BILLIONS) 
      48. TABLE 47. SPAIN SILVER MARKET SIZE ESTIMATES & FORECAST, BY APPLICATION, 2019-2035 (USD BILLIONS) 
      49. TABLE 48. SPAIN SILVER MARKET SIZE ESTIMATES & FORECAST, BY END USE INDUSTRY, 2019-2035 (USD BILLIONS) 
      50. TABLE 49. SPAIN SILVER MARKET SIZE ESTIMATES & FORECAST, BY FORM, 2019-2035 (USD BILLIONS) 
      51. TABLE 50. SPAIN SILVER MARKET SIZE ESTIMATES & FORECAST, BY PURITY, 2019-2035 (USD BILLIONS) 
      52. TABLE 51. SPAIN SILVER MARKET SIZE ESTIMATES & FORECAST, BY REGIONAL, 2019-2035 (USD BILLIONS) 
      53. TABLE 52. REST OF EUROPE SILVER MARKET SIZE ESTIMATES & FORECAST, BY APPLICATION, 2019-2035 (USD BILLIONS) 
      54. TABLE 53. REST OF EUROPE SILVER MARKET SIZE ESTIMATES & FORECAST, BY END USE INDUSTRY, 2019-2035 (USD BILLIONS) 
      55. TABLE 54. REST OF EUROPE SILVER MARKET SIZE ESTIMATES & FORECAST, BY FORM, 2019-2035 (USD BILLIONS) 
      56. TABLE 55. REST OF EUROPE SILVER MARKET SIZE ESTIMATES & FORECAST, BY PURITY, 2019-2035 (USD BILLIONS) 
      57. TABLE 56. REST OF EUROPE SILVER MARKET SIZE ESTIMATES & FORECAST, BY REGIONAL, 2019-2035 (USD BILLIONS) 
      58. TABLE 57. APAC SILVER MARKET SIZE ESTIMATES & FORECAST, BY APPLICATION, 2019-2035 (USD BILLIONS) 
      59. TABLE 58. APAC SILVER MARKET SIZE ESTIMATES & FORECAST, BY END USE INDUSTRY, 2019-2035 (USD BILLIONS) 
      60. TABLE 59. APAC SILVER MARKET SIZE ESTIMATES & FORECAST, BY FORM, 2019-2035 (USD BILLIONS) 
      61. TABLE 60. APAC SILVER MARKET SIZE ESTIMATES & FORECAST, BY PURITY, 2019-2035 (USD BILLIONS) 
      62. TABLE 61. APAC SILVER MARKET SIZE ESTIMATES & FORECAST, BY REGIONAL, 2019-2035 (USD BILLIONS) 
      63. TABLE 62. CHINA SILVER MARKET SIZE ESTIMATES & FORECAST, BY APPLICATION, 2019-2035 (USD BILLIONS) 
      64. TABLE 63. CHINA SILVER MARKET SIZE ESTIMATES & FORECAST, BY END USE INDUSTRY, 2019-2035 (USD BILLIONS) 
      65. TABLE 64. CHINA SILVER MARKET SIZE ESTIMATES & FORECAST, BY FORM, 2019-2035 (USD BILLIONS) 
      66. TABLE 65. CHINA SILVER MARKET SIZE ESTIMATES & FORECAST, BY PURITY, 2019-2035 (USD BILLIONS) 
      67. TABLE 66. CHINA SILVER MARKET SIZE ESTIMATES & FORECAST, BY REGIONAL, 2019-2035 (USD BILLIONS) 
      68. TABLE 67. INDIA SILVER MARKET SIZE ESTIMATES & FORECAST, BY APPLICATION, 2019-2035 (USD BILLIONS) 
      69. TABLE 68. INDIA SILVER MARKET SIZE ESTIMATES & FORECAST, BY END USE INDUSTRY, 2019-2035 (USD BILLIONS) 
      70. TABLE 69. INDIA SILVER MARKET SIZE ESTIMATES & FORECAST, BY FORM, 2019-2035 (USD BILLIONS) 
      71. TABLE 70. INDIA SILVER MARKET SIZE ESTIMATES & FORECAST, BY PURITY, 2019-2035 (USD BILLIONS) 
      72. TABLE 71. INDIA SILVER MARKET SIZE ESTIMATES & FORECAST, BY REGIONAL, 2019-2035 (USD BILLIONS) 
      73. TABLE 72. JAPAN SILVER MARKET SIZE ESTIMATES & FORECAST, BY APPLICATION, 2019-2035 (USD BILLIONS) 
      74. TABLE 73. JAPAN SILVER MARKET SIZE ESTIMATES & FORECAST, BY END USE INDUSTRY, 2019-2035 (USD BILLIONS) 
      75. TABLE 74. JAPAN SILVER MARKET SIZE ESTIMATES & FORECAST, BY FORM, 2019-2035 (USD BILLIONS) 
      76. TABLE 75. JAPAN SILVER MARKET SIZE ESTIMATES & FORECAST, BY PURITY, 2019-2035 (USD BILLIONS) 
      77. TABLE 76. JAPAN SILVER MARKET SIZE ESTIMATES & FORECAST, BY REGIONAL, 2019-2035 (USD BILLIONS) 
      78. TABLE 77. SOUTH KOREA SILVER MARKET SIZE ESTIMATES & FORECAST, BY APPLICATION, 2019-2035 (USD BILLIONS) 
      79. TABLE 78. SOUTH KOREA SILVER MARKET SIZE ESTIMATES & FORECAST, BY END USE INDUSTRY, 2019-2035 (USD BILLIONS) 
      80. TABLE 79. SOUTH KOREA SILVER MARKET SIZE ESTIMATES & FORECAST, BY FORM, 2019-2035 (USD BILLIONS) 
      81. TABLE 80. SOUTH KOREA SILVER MARKET SIZE ESTIMATES & FORECAST, BY PURITY, 2019-2035 (USD BILLIONS) 
      82. TABLE 81. SOUTH KOREA SILVER MARKET SIZE ESTIMATES & FORECAST, BY REGIONAL, 2019-2035 (USD BILLIONS) 
      83. TABLE 82. MALAYSIA SILVER MARKET SIZE ESTIMATES & FORECAST, BY APPLICATION, 2019-2035 (USD BILLIONS) 
      84. TABLE 83. MALAYSIA SILVER MARKET SIZE ESTIMATES & FORECAST, BY END USE INDUSTRY, 2019-2035 (USD BILLIONS) 
      85. TABLE 84. MALAYSIA SILVER MARKET SIZE ESTIMATES & FORECAST, BY FORM, 2019-2035 (USD BILLIONS) 
      86. TABLE 85. MALAYSIA SILVER MARKET SIZE ESTIMATES & FORECAST, BY PURITY, 2019-2035 (USD BILLIONS) 
      87. TABLE 86. MALAYSIA SILVER MARKET SIZE ESTIMATES & FORECAST, BY REGIONAL, 2019-2035 (USD BILLIONS) 
      88. TABLE 87. THAILAND SILVER MARKET SIZE ESTIMATES & FORECAST, BY APPLICATION, 2019-2035 (USD BILLIONS) 
      89. TABLE 88. THAILAND SILVER MARKET SIZE ESTIMATES & FORECAST, BY END USE INDUSTRY, 2019-2035 (USD BILLIONS) 
      90. TABLE 89. THAILAND SILVER MARKET SIZE ESTIMATES & FORECAST, BY FORM, 2019-2035 (USD BILLIONS) 
      91. TABLE 90. THAILAND SILVER MARKET SIZE ESTIMATES & FORECAST, BY PURITY, 2019-2035 (USD BILLIONS) 
      92. TABLE 91. THAILAND SILVER MARKET SIZE ESTIMATES & FORECAST, BY REGIONAL, 2019-2035 (USD BILLIONS) 
      93. TABLE 92. INDONESIA SILVER MARKET SIZE ESTIMATES & FORECAST, BY APPLICATION, 2019-2035 (USD BILLIONS) 
      94. TABLE 93. INDONESIA SILVER MARKET SIZE ESTIMATES & FORECAST, BY END USE INDUSTRY, 2019-2035 (USD BILLIONS) 
      95. TABLE 94. INDONESIA SILVER MARKET SIZE ESTIMATES & FORECAST, BY FORM, 2019-2035 (USD BILLIONS) 
      96. TABLE 95. INDONESIA SILVER MARKET SIZE ESTIMATES & FORECAST, BY PURITY, 2019-2035 (USD BILLIONS) 
      97. TABLE 96. INDONESIA SILVER MARKET SIZE ESTIMATES & FORECAST, BY REGIONAL, 2019-2035 (USD BILLIONS) 
      98. TABLE 97. REST OF APAC SILVER MARKET SIZE ESTIMATES & FORECAST, BY APPLICATION, 2019-2035 (USD BILLIONS) 
      99. TABLE 98. REST OF APAC SILVER MARKET SIZE ESTIMATES & FORECAST, BY END USE INDUSTRY, 2019-2035 (USD BILLIONS) 
      100. TABLE 99. REST OF APAC SILVER MARKET SIZE ESTIMATES & FORECAST, BY FORM, 2019-2035 (USD BILLIONS) 
      101. TABLE 100. REST OF APAC SILVER MARKET SIZE ESTIMATES & FORECAST, BY PURITY, 2019-2035 (USD BILLIONS) 
      102. TABLE 101. REST OF APAC SILVER MARKET SIZE ESTIMATES & FORECAST, BY REGIONAL, 2019-2035 (USD BILLIONS) 
      103. TABLE 102. SOUTH AMERICA SILVER MARKET SIZE ESTIMATES & FORECAST, BY APPLICATION, 2019-2035 (USD BILLIONS) 
      104. TABLE 103. SOUTH AMERICA SILVER MARKET SIZE ESTIMATES & FORECAST, BY END USE INDUSTRY, 2019-2035 (USD BILLIONS) 
      105. TABLE 104. SOUTH AMERICA SILVER MARKET SIZE ESTIMATES & FORECAST, BY FORM, 2019-2035 (USD BILLIONS) 
      106. TABLE 105. SOUTH AMERICA SILVER MARKET SIZE ESTIMATES & FORECAST, BY PURITY, 2019-2035 (USD BILLIONS) 
      107. TABLE 106. SOUTH AMERICA SILVER MARKET SIZE ESTIMATES & FORECAST, BY REGIONAL, 2019-2035 (USD BILLIONS) 
      108. TABLE 107. BRAZIL SILVER MARKET SIZE ESTIMATES & FORECAST, BY APPLICATION, 2019-2035 (USD BILLIONS) 
      109. TABLE 108. BRAZIL SILVER MARKET SIZE ESTIMATES & FORECAST, BY END USE INDUSTRY, 2019-2035 (USD BILLIONS) 
      110. TABLE 109. BRAZIL SILVER MARKET SIZE ESTIMATES & FORECAST, BY FORM, 2019-2035 (USD BILLIONS) 
      111. TABLE 110. BRAZIL SILVER MARKET SIZE ESTIMATES & FORECAST, BY PURITY, 2019-2035 (USD BILLIONS) 
      112. TABLE 111. BRAZIL SILVER MARKET SIZE ESTIMATES & FORECAST, BY REGIONAL, 2019-2035 (USD BILLIONS) 
      113. TABLE 112. MEXICO SILVER MARKET SIZE ESTIMATES & FORECAST, BY APPLICATION, 2019-2035 (USD BILLIONS) 
      114. TABLE 113. MEXICO SILVER MARKET SIZE ESTIMATES & FORECAST, BY END USE INDUSTRY, 2019-2035 (USD BILLIONS) 
      115. TABLE 114. MEXICO SILVER MARKET SIZE ESTIMATES & FORECAST, BY FORM, 2019-2035 (USD BILLIONS) 
      116. TABLE 115. MEXICO SILVER MARKET SIZE ESTIMATES & FORECAST, BY PURITY, 2019-2035 (USD BILLIONS) 
      117. TABLE 116. MEXICO SILVER MARKET SIZE ESTIMATES & FORECAST, BY REGIONAL, 2019-2035 (USD BILLIONS) 
      118. TABLE 117. ARGENTINA SILVER MARKET SIZE ESTIMATES & FORECAST, BY APPLICATION, 2019-2035 (USD BILLIONS) 
      119. TABLE 118. ARGENTINA SILVER MARKET SIZE ESTIMATES & FORECAST, BY END USE INDUSTRY, 2019-2035 (USD BILLIONS) 
      120. TABLE 119. ARGENTINA SILVER MARKET SIZE ESTIMATES & FORECAST, BY FORM, 2019-2035 (USD BILLIONS) 
      121. TABLE 120. ARGENTINA SILVER MARKET SIZE ESTIMATES & FORECAST, BY PURITY, 2019-2035 (USD BILLIONS) 
      122. TABLE 121. ARGENTINA SILVER MARKET SIZE ESTIMATES & FORECAST, BY REGIONAL, 2019-2035 (USD BILLIONS) 
      123. TABLE 122. REST OF SOUTH AMERICA SILVER MARKET SIZE ESTIMATES & FORECAST, BY APPLICATION, 2019-2035 (USD BILLIONS) 
      124. TABLE 123. REST OF SOUTH AMERICA SILVER MARKET SIZE ESTIMATES & FORECAST, BY END USE INDUSTRY, 2019-2035 (USD BILLIONS) 
      125. TABLE 124. REST OF SOUTH AMERICA SILVER MARKET SIZE ESTIMATES & FORECAST, BY FORM, 2019-2035 (USD BILLIONS) 
      126. TABLE 125. REST OF SOUTH AMERICA SILVER MARKET SIZE ESTIMATES & FORECAST, BY PURITY, 2019-2035 (USD BILLIONS) 
      127. TABLE 126. REST OF SOUTH AMERICA SILVER MARKET SIZE ESTIMATES & FORECAST, BY REGIONAL, 2019-2035 (USD BILLIONS) 
      128. TABLE 127. MEA SILVER MARKET SIZE ESTIMATES & FORECAST, BY APPLICATION, 2019-2035 (USD BILLIONS) 
      129. TABLE 128. MEA SILVER MARKET SIZE ESTIMATES & FORECAST, BY END USE INDUSTRY, 2019-2035 (USD BILLIONS) 
      130. TABLE 129. MEA SILVER MARKET SIZE ESTIMATES & FORECAST, BY FORM, 2019-2035 (USD BILLIONS) 
      131. TABLE 130. MEA SILVER MARKET SIZE ESTIMATES & FORECAST, BY PURITY, 2019-2035 (USD BILLIONS) 
      132. TABLE 131. MEA SILVER MARKET SIZE ESTIMATES & FORECAST, BY REGIONAL, 2019-2035 (USD BILLIONS) 
      133. TABLE 132. GCC COUNTRIES SILVER MARKET SIZE ESTIMATES & FORECAST, BY APPLICATION, 2019-2035 (USD BILLIONS) 
      134. TABLE 133. GCC COUNTRIES SILVER MARKET SIZE ESTIMATES & FORECAST, BY END USE INDUSTRY, 2019-2035 (USD BILLIONS) 
      135. TABLE 134. GCC COUNTRIES SILVER MARKET SIZE ESTIMATES & FORECAST, BY FORM, 2019-2035 (USD BILLIONS) 
      136. TABLE 135. GCC COUNTRIES SILVER MARKET SIZE ESTIMATES & FORECAST, BY PURITY, 2019-2035 (USD BILLIONS) 
      137. TABLE 136. GCC COUNTRIES SILVER MARKET SIZE ESTIMATES & FORECAST, BY REGIONAL, 2019-2035 (USD BILLIONS) 
      138. TABLE 137. SOUTH AFRICA SILVER MARKET SIZE ESTIMATES & FORECAST, BY APPLICATION, 2019-2035 (USD BILLIONS) 
      139. TABLE 138. SOUTH AFRICA SILVER MARKET SIZE ESTIMATES & FORECAST, BY END USE INDUSTRY, 2019-2035 (USD BILLIONS) 
      140. TABLE 139. SOUTH AFRICA SILVER MARKET SIZE ESTIMATES & FORECAST, BY FORM, 2019-2035 (USD BILLIONS) 
      141. TABLE 140. SOUTH AFRICA SILVER MARKET SIZE ESTIMATES & FORECAST, BY PURITY, 2019-2035 (USD BILLIONS) 
      142. TABLE 141. SOUTH AFRICA SILVER MARKET SIZE ESTIMATES & FORECAST, BY REGIONAL, 2019-2035 (USD BILLIONS) 
      143. TABLE 142. REST OF MEA SILVER MARKET SIZE ESTIMATES & FORECAST, BY APPLICATION, 2019-2035 (USD BILLIONS) 
      144. TABLE 143. REST OF MEA SILVER MARKET SIZE ESTIMATES & FORECAST, BY END USE INDUSTRY, 2019-2035 (USD BILLIONS) 
      145. TABLE 144. REST OF MEA SILVER MARKET SIZE ESTIMATES & FORECAST, BY FORM, 2019-2035 (USD BILLIONS) 
      146. TABLE 145. REST OF MEA SILVER MARKET SIZE ESTIMATES & FORECAST, BY PURITY, 2019-2035 (USD BILLIONS) 
      147. TABLE 146. REST OF MEA SILVER MARKET SIZE ESTIMATES & FORECAST, BY REGIONAL, 2019-2035 (USD BILLIONS) 
      148. TABLE 147. PRODUCT LAUNCH/PRODUCT DEVELOPMENT/APPROVAL 
      149. TABLE 148. ACQUISITION/PARTNERSHIP                             LIST OF FIGURES
      150. FIGURE 1. MARKET SYNOPSIS 
      151. FIGURE 2. NORTH AMERICA SILVER MARKET ANALYSIS 
      152. FIGURE 3. US SILVER MARKET ANALYSIS BY APPLICATION 
      153. FIGURE 4. US SILVER MARKET ANALYSIS BY END USE INDUSTRY 
      154. FIGURE 5. US SILVER MARKET ANALYSIS BY FORM 
      155. FIGURE 6. US SILVER MARKET ANALYSIS BY PURITY 
      156. FIGURE 7. US SILVER MARKET ANALYSIS BY REGIONAL 
      157. FIGURE 8. CANADA SILVER MARKET ANALYSIS BY APPLICATION 
      158. FIGURE 9. CANADA SILVER MARKET ANALYSIS BY END USE INDUSTRY 
      159. FIGURE 10. CANADA SILVER MARKET ANALYSIS BY FORM 
      160. FIGURE 11. CANADA SILVER MARKET ANALYSIS BY PURITY 
      161. FIGURE 12. CANADA SILVER MARKET ANALYSIS BY REGIONAL 
      162. FIGURE 13. EUROPE SILVER MARKET ANALYSIS 
      163. FIGURE 14. GERMANY SILVER MARKET ANALYSIS BY APPLICATION 
      164. FIGURE 15. GERMANY SILVER MARKET ANALYSIS BY END USE INDUSTRY 
      165. FIGURE 16. GERMANY SILVER MARKET ANALYSIS BY FORM 
      166. FIGURE 17. GERMANY SILVER MARKET ANALYSIS BY PURITY 
      167. FIGURE 18. GERMANY SILVER MARKET ANALYSIS BY REGIONAL 
      168. FIGURE 19. UK SILVER MARKET ANALYSIS BY APPLICATION 
      169. FIGURE 20. UK SILVER MARKET ANALYSIS BY END USE INDUSTRY 
      170. FIGURE 21. UK SILVER MARKET ANALYSIS BY FORM 
      171. FIGURE 22. UK SILVER MARKET ANALYSIS BY PURITY 
      172. FIGURE 23. UK SILVER MARKET ANALYSIS BY REGIONAL 
      173. FIGURE 24. FRANCE SILVER MARKET ANALYSIS BY APPLICATION 
      174. FIGURE 25. FRANCE SILVER MARKET ANALYSIS BY END USE INDUSTRY 
      175. FIGURE 26. FRANCE SILVER MARKET ANALYSIS BY FORM 
      176. FIGURE 27. FRANCE SILVER MARKET ANALYSIS BY PURITY 
      177. FIGURE 28. FRANCE SILVER MARKET ANALYSIS BY REGIONAL 
      178. FIGURE 29. RUSSIA SILVER MARKET ANALYSIS BY APPLICATION 
      179. FIGURE 30. RUSSIA SILVER MARKET ANALYSIS BY END USE INDUSTRY 
      180. FIGURE 31. RUSSIA SILVER MARKET ANALYSIS BY FORM 
      181. FIGURE 32. RUSSIA SILVER MARKET ANALYSIS BY PURITY 
      182. FIGURE 33. RUSSIA SILVER MARKET ANALYSIS BY REGIONAL 
      183. FIGURE 34. ITALY SILVER MARKET ANALYSIS BY APPLICATION 
      184. FIGURE 35. ITALY SILVER MARKET ANALYSIS BY END USE INDUSTRY 
      185. FIGURE 36. ITALY SILVER MARKET ANALYSIS BY FORM 
      186. FIGURE 37. ITALY SILVER MARKET ANALYSIS BY PURITY 
      187. FIGURE 38. ITALY SILVER MARKET ANALYSIS BY REGIONAL 
      188. FIGURE 39. SPAIN SILVER MARKET ANALYSIS BY APPLICATION 
      189. FIGURE 40. SPAIN SILVER MARKET ANALYSIS BY END USE INDUSTRY 
      190. FIGURE 41. SPAIN SILVER MARKET ANALYSIS BY FORM 
      191. FIGURE 42. SPAIN SILVER MARKET ANALYSIS BY PURITY 
      192. FIGURE 43. SPAIN SILVER MARKET ANALYSIS BY REGIONAL 
      193. FIGURE 44. REST OF EUROPE SILVER MARKET ANALYSIS BY APPLICATION 
      194. FIGURE 45. REST OF EUROPE SILVER MARKET ANALYSIS BY END USE INDUSTRY 
      195. FIGURE 46. REST OF EUROPE SILVER MARKET ANALYSIS BY FORM 
      196. FIGURE 47. REST OF EUROPE SILVER MARKET ANALYSIS BY PURITY 
      197. FIGURE 48. REST OF EUROPE SILVER MARKET ANALYSIS BY REGIONAL 
      198. FIGURE 49. APAC SILVER MARKET ANALYSIS 
      199. FIGURE 50. CHINA SILVER MARKET ANALYSIS BY APPLICATION 
      200. FIGURE 51. CHINA SILVER MARKET ANALYSIS BY END USE INDUSTRY 
      201. FIGURE 52. CHINA SILVER MARKET ANALYSIS BY FORM 
      202. FIGURE 53. CHINA SILVER MARKET ANALYSIS BY PURITY 
      203. FIGURE 54. CHINA SILVER MARKET ANALYSIS BY REGIONAL 
      204. FIGURE 55. INDIA SILVER MARKET ANALYSIS BY APPLICATION 
      205. FIGURE 56. INDIA SILVER MARKET ANALYSIS BY END USE INDUSTRY 
      206. FIGURE 57. INDIA SILVER MARKET ANALYSIS BY FORM 
      207. FIGURE 58. INDIA SILVER MARKET ANALYSIS BY PURITY 
      208. FIGURE 59. INDIA SILVER MARKET ANALYSIS BY REGIONAL 
      209. FIGURE 60. JAPAN SILVER MARKET ANALYSIS BY APPLICATION 
      210. FIGURE 61. JAPAN SILVER MARKET ANALYSIS BY END USE INDUSTRY 
      211. FIGURE 62. JAPAN SILVER MARKET ANALYSIS BY FORM 
      212. FIGURE 63. JAPAN SILVER MARKET ANALYSIS BY PURITY 
      213. FIGURE 64. JAPAN SILVER MARKET ANALYSIS BY REGIONAL 
      214. FIGURE 65. SOUTH KOREA SILVER MARKET ANALYSIS BY APPLICATION 
      215. FIGURE 66. SOUTH KOREA SILVER MARKET ANALYSIS BY END USE INDUSTRY 
      216. FIGURE 67. SOUTH KOREA SILVER MARKET ANALYSIS BY FORM 
      217. FIGURE 68. SOUTH KOREA SILVER MARKET ANALYSIS BY PURITY 
      218. FIGURE 69. SOUTH KOREA SILVER MARKET ANALYSIS BY REGIONAL 
      219. FIGURE 70. MALAYSIA SILVER MARKET ANALYSIS BY APPLICATION 
      220. FIGURE 71. MALAYSIA SILVER MARKET ANALYSIS BY END USE INDUSTRY 
      221. FIGURE 72. MALAYSIA SILVER MARKET ANALYSIS BY FORM 
      222. FIGURE 73. MALAYSIA SILVER MARKET ANALYSIS BY PURITY 
      223. FIGURE 74. MALAYSIA SILVER MARKET ANALYSIS BY REGIONAL 
      224. FIGURE 75. THAILAND SILVER MARKET ANALYSIS BY APPLICATION 
      225. FIGURE 76. THAILAND SILVER MARKET ANALYSIS BY END USE INDUSTRY 
      226. FIGURE 77. THAILAND SILVER MARKET ANALYSIS BY FORM 
      227. FIGURE 78. THAILAND SILVER MARKET ANALYSIS BY PURITY 
      228. FIGURE 79. THAILAND SILVER MARKET ANALYSIS BY REGIONAL 
      229. FIGURE 80. INDONESIA SILVER MARKET ANALYSIS BY APPLICATION 
      230. FIGURE 81. INDONESIA SILVER MARKET ANALYSIS BY END USE INDUSTRY 
      231. FIGURE 82. INDONESIA SILVER MARKET ANALYSIS BY FORM 
      232. FIGURE 83. INDONESIA SILVER MARKET ANALYSIS BY PURITY 
      233. FIGURE 84. INDONESIA SILVER MARKET ANALYSIS BY REGIONAL 
      234. FIGURE 85. REST OF APAC SILVER MARKET ANALYSIS BY APPLICATION 
      235. FIGURE 86. REST OF APAC SILVER MARKET ANALYSIS BY END USE INDUSTRY 
      236. FIGURE 87. REST OF APAC SILVER MARKET ANALYSIS BY FORM 
      237. FIGURE 88. REST OF APAC SILVER MARKET ANALYSIS BY PURITY 
      238. FIGURE 89. REST OF APAC SILVER MARKET ANALYSIS BY REGIONAL 
      239. FIGURE 90. SOUTH AMERICA SILVER MARKET ANALYSIS 
      240. FIGURE 91. BRAZIL SILVER MARKET ANALYSIS BY APPLICATION 
      241. FIGURE 92. BRAZIL SILVER MARKET ANALYSIS BY END USE INDUSTRY 
      242. FIGURE 93. BRAZIL SILVER MARKET ANALYSIS BY FORM 
      243. FIGURE 94. BRAZIL SILVER MARKET ANALYSIS BY PURITY 
      244. FIGURE 95. BRAZIL SILVER MARKET ANALYSIS BY REGIONAL 
      245. FIGURE 96. MEXICO SILVER MARKET ANALYSIS BY APPLICATION 
      246. FIGURE 97. MEXICO SILVER MARKET ANALYSIS BY END USE INDUSTRY 
      247. FIGURE 98. MEXICO SILVER MARKET ANALYSIS BY FORM 
      248. FIGURE 99. MEXICO SILVER MARKET ANALYSIS BY PURITY 
      249. FIGURE 100. MEXICO SILVER MARKET ANALYSIS BY REGIONAL 
      250. FIGURE 101. ARGENTINA SILVER MARKET ANALYSIS BY APPLICATION 
      251. FIGURE 102. ARGENTINA SILVER MARKET ANALYSIS BY END USE INDUSTRY 
      252. FIGURE 103. ARGENTINA SILVER MARKET ANALYSIS BY FORM 
      253. FIGURE 104. ARGENTINA SILVER MARKET ANALYSIS BY PURITY 
      254. FIGURE 105. ARGENTINA SILVER MARKET ANALYSIS BY REGIONAL 
      255. FIGURE 106. REST OF SOUTH AMERICA SILVER MARKET ANALYSIS BY APPLICATION 
      256. FIGURE 107. REST OF SOUTH AMERICA SILVER MARKET ANALYSIS BY END USE INDUSTRY 
      257. FIGURE 108. REST OF SOUTH AMERICA SILVER MARKET ANALYSIS BY FORM 
      258. FIGURE 109. REST OF SOUTH AMERICA SILVER MARKET ANALYSIS BY PURITY 
      259. FIGURE 110. REST OF SOUTH AMERICA SILVER MARKET ANALYSIS BY REGIONAL 
      260. FIGURE 111. MEA SILVER MARKET ANALYSIS 
      261. FIGURE 112. GCC COUNTRIES SILVER MARKET ANALYSIS BY APPLICATION 
      262. FIGURE 113. GCC COUNTRIES SILVER MARKET ANALYSIS BY END USE INDUSTRY 
      263. FIGURE 114. GCC COUNTRIES SILVER MARKET ANALYSIS BY FORM 
      264. FIGURE 115. GCC COUNTRIES SILVER MARKET ANALYSIS BY PURITY 
      265. FIGURE 116. GCC COUNTRIES SILVER MARKET ANALYSIS BY REGIONAL 
      266. FIGURE 117. SOUTH AFRICA SILVER MARKET ANALYSIS BY APPLICATION 
      267. FIGURE 118. SOUTH AFRICA SILVER MARKET ANALYSIS BY END USE INDUSTRY 
      268. FIGURE 119. SOUTH AFRICA SILVER MARKET ANALYSIS BY FORM 
      269. FIGURE 120. SOUTH AFRICA SILVER MARKET ANALYSIS BY PURITY 
      270. FIGURE 121. SOUTH AFRICA SILVER MARKET ANALYSIS BY REGIONAL 
      271. FIGURE 122. REST OF MEA SILVER MARKET ANALYSIS BY APPLICATION 
      272. FIGURE 123. REST OF MEA SILVER MARKET ANALYSIS BY END USE INDUSTRY 
      273. FIGURE 124. REST OF MEA SILVER MARKET ANALYSIS BY FORM 
      274. FIGURE 125. REST OF MEA SILVER MARKET ANALYSIS BY PURITY 
      275. FIGURE 126. REST OF MEA SILVER MARKET ANALYSIS BY REGIONAL 
      276. FIGURE 127. KEY BUYING CRITERIA OF SILVER MARKET 
      277. FIGURE 128. RESEARCH PROCESS OF MRFR 
      278. FIGURE 129. DRO ANALYSIS OF SILVER MARKET 
      279. FIGURE 130. DRIVERS IMPACT ANALYSIS: SILVER MARKET 
      280. FIGURE 131. RESTRAINTS IMPACT ANALYSIS: SILVER MARKET 
      281. FIGURE 132. SUPPLY / VALUE CHAIN: SILVER MARKET 
      282. FIGURE 133. SILVER MARKET, BY APPLICATION, 2025 (% SHARE) 
      283. FIGURE 134. SILVER MARKET, BY APPLICATION, 2019 TO 2035 (USD Billions) 
      284. FIGURE 135. SILVER MARKET, BY END USE INDUSTRY, 2025 (% SHARE) 
      285. FIGURE 136. SILVER MARKET, BY END USE INDUSTRY, 2019 TO 2035 (USD Billions) 
      286. FIGURE 137. SILVER MARKET, BY FORM, 2025 (% SHARE) 
      287. FIGURE 138. SILVER MARKET, BY FORM, 2019 TO 2035 (USD Billions) 
      288. FIGURE 139. SILVER MARKET, BY PURITY, 2025 (% SHARE) 
      289. FIGURE 140. SILVER MARKET, BY PURITY, 2019 TO 2035 (USD Billions) 
      290. FIGURE 141. SILVER MARKET, BY REGIONAL, 2025 (% SHARE) 
      291. FIGURE 142. SILVER MARKET, BY REGIONAL, 2019 TO 2035 (USD Billions) 
      292. FIGURE 143. BENCHMARKING OF MAJOR COMPETITORS  "

    Silver Market Segmentation


    Silver Market By Application (USD Billion, 2019-2035)

    Jewelry

    Electronics

    Coins and Medals

    Photography

    Industrial Manufacturing


    Silver Market By End Use Industry (USD Billion, 2019-2035)

    Consumer Goods

    Automotive

    Medical

    Solar Energy

    Telecommunications


    Silver Market By Form (USD Billion, 2019-2035)

    Bars

    Coins

    Powder

    Foil

    Wire


    Silver Market By Purity (USD Billion, 2019-2035)

    Sterling Silver

    Fine Silver

    Coin Silver


    Silver Market By Regional (USD Billion, 2019-2035)

    North America

    Europe

    South America

    Asia Pacific

    Middle East and Africa


    Silver Market Regional Outlook (USD Billion, 2019-2035)


    North America Outlook (USD Billion, 2019-2035)

    North America Silver Market by Application Type

    Jewelry

    Electronics

    Coins and Medals

    Photography

    Industrial Manufacturing

    North America Silver Market by End Use Industry Type

    Consumer Goods

    Automotive

    Medical

    Solar Energy

    Telecommunications

    North America Silver Market by Form Type

    Bars

    Coins

    Powder

    Foil

    Wire

    North America Silver Market by Purity Type

    Sterling Silver

    Fine Silver

    Coin Silver

    North America Silver Market by Regional Type

    US

    Canada

    US Outlook (USD Billion, 2019-2035)

    US Silver Market by Application Type

    Jewelry

    Electronics

    Coins and Medals

    Photography

    Industrial Manufacturing

    US Silver Market by End Use Industry Type

    Consumer Goods

    Automotive

    Medical

    Solar Energy

    Telecommunications

    US Silver Market by Form Type

    Bars

    Coins

    Powder

    Foil

    Wire

    US Silver Market by Purity Type

    Sterling Silver

    Fine Silver

    Coin Silver

    CANADA Outlook (USD Billion, 2019-2035)

    CANADA Silver Market by Application Type

    Jewelry

    Electronics

    Coins and Medals

    Photography

    Industrial Manufacturing

    CANADA Silver Market by End Use Industry Type

    Consumer Goods

    Automotive

    Medical

    Solar Energy

    Telecommunications

    CANADA Silver Market by Form Type

    Bars

    Coins

    Powder

    Foil

    Wire

    CANADA Silver Market by Purity Type

    Sterling Silver

    Fine Silver

    Coin Silver

    Europe Outlook (USD Billion, 2019-2035)

    Europe Silver Market by Application Type

    Jewelry

    Electronics

    Coins and Medals

    Photography

    Industrial Manufacturing

    Europe Silver Market by End Use Industry Type

    Consumer Goods

    Automotive

    Medical

    Solar Energy

    Telecommunications

    Europe Silver Market by Form Type

    Bars

    Coins

    Powder

    Foil

    Wire

    Europe Silver Market by Purity Type

    Sterling Silver

    Fine Silver

    Coin Silver

    Europe Silver Market by Regional Type

    Germany

    UK

    France

    Russia

    Italy

    Spain

    Rest of Europe

    GERMANY Outlook (USD Billion, 2019-2035)

    GERMANY Silver Market by Application Type

    Jewelry

    Electronics

    Coins and Medals

    Photography

    Industrial Manufacturing

    GERMANY Silver Market by End Use Industry Type

    Consumer Goods

    Automotive

    Medical

    Solar Energy

    Telecommunications

    GERMANY Silver Market by Form Type

    Bars

    Coins

    Powder

    Foil

    Wire

    GERMANY Silver Market by Purity Type

    Sterling Silver

    Fine Silver

    Coin Silver

    UK Outlook (USD Billion, 2019-2035)

    UK Silver Market by Application Type

    Jewelry

    Electronics

    Coins and Medals

    Photography

    Industrial Manufacturing

    UK Silver Market by End Use Industry Type

    Consumer Goods

    Automotive

    Medical

    Solar Energy

    Telecommunications

    UK Silver Market by Form Type

    Bars

    Coins

    Powder

    Foil

    Wire

    UK Silver Market by Purity Type

    Sterling Silver

    Fine Silver

    Coin Silver

    FRANCE Outlook (USD Billion, 2019-2035)

    FRANCE Silver Market by Application Type

    Jewelry

    Electronics

    Coins and Medals

    Photography

    Industrial Manufacturing

    FRANCE Silver Market by End Use Industry Type

    Consumer Goods

    Automotive

    Medical

    Solar Energy

    Telecommunications

    FRANCE Silver Market by Form Type

    Bars

    Coins

    Powder

    Foil

    Wire

    FRANCE Silver Market by Purity Type

    Sterling Silver

    Fine Silver

    Coin Silver

    RUSSIA Outlook (USD Billion, 2019-2035)

    RUSSIA Silver Market by Application Type

    Jewelry

    Electronics

    Coins and Medals

    Photography

    Industrial Manufacturing

    RUSSIA Silver Market by End Use Industry Type

    Consumer Goods

    Automotive

    Medical

    Solar Energy

    Telecommunications

    RUSSIA Silver Market by Form Type

    Bars

    Coins

    Powder

    Foil

    Wire

    RUSSIA Silver Market by Purity Type

    Sterling Silver

    Fine Silver

    Coin Silver

    ITALY Outlook (USD Billion, 2019-2035)

    ITALY Silver Market by Application Type

    Jewelry

    Electronics

    Coins and Medals

    Photography

    Industrial Manufacturing

    ITALY Silver Market by End Use Industry Type

    Consumer Goods

    Automotive

    Medical

    Solar Energy

    Telecommunications

    ITALY Silver Market by Form Type

    Bars

    Coins

    Powder

    Foil

    Wire

    ITALY Silver Market by Purity Type

    Sterling Silver

    Fine Silver

    Coin Silver

    SPAIN Outlook (USD Billion, 2019-2035)

    SPAIN Silver Market by Application Type

    Jewelry

    Electronics

    Coins and Medals

    Photography

    Industrial Manufacturing

    SPAIN Silver Market by End Use Industry Type

    Consumer Goods

    Automotive

    Medical

    Solar Energy

    Telecommunications

    SPAIN Silver Market by Form Type

    Bars

    Coins

    Powder

    Foil

    Wire

    SPAIN Silver Market by Purity Type

    Sterling Silver

    Fine Silver

    Coin Silver

    REST OF EUROPE Outlook (USD Billion, 2019-2035)

    REST OF EUROPE Silver Market by Application Type

    Jewelry

    Electronics

    Coins and Medals

    Photography

    Industrial Manufacturing

    REST OF EUROPE Silver Market by End Use Industry Type

    Consumer Goods

    Automotive

    Medical

    Solar Energy

    Telecommunications

    REST OF EUROPE Silver Market by Form Type

    Bars

    Coins

    Powder

    Foil

    Wire

    REST OF EUROPE Silver Market by Purity Type

    Sterling Silver

    Fine Silver

    Coin Silver

    APAC Outlook (USD Billion, 2019-2035)

    APAC Silver Market by Application Type

    Jewelry

    Electronics

    Coins and Medals

    Photography

    Industrial Manufacturing

    APAC Silver Market by End Use Industry Type

    Consumer Goods

    Automotive

    Medical

    Solar Energy

    Telecommunications

    APAC Silver Market by Form Type

    Bars

    Coins

    Powder

    Foil

    Wire

    APAC Silver Market by Purity Type

    Sterling Silver

    Fine Silver

    Coin Silver

    APAC Silver Market by Regional Type

    China

    India

    Japan

    South Korea

    Malaysia

    Thailand

    Indonesia

    Rest of APAC

    CHINA Outlook (USD Billion, 2019-2035)

    CHINA Silver Market by Application Type

    Jewelry

    Electronics

    Coins and Medals

    Photography

    Industrial Manufacturing

    CHINA Silver Market by End Use Industry Type

    Consumer Goods

    Automotive

    Medical

    Solar Energy

    Telecommunications

    CHINA Silver Market by Form Type

    Bars

    Coins

    Powder

    Foil

    Wire

    CHINA Silver Market by Purity Type

    Sterling Silver

    Fine Silver

    Coin Silver

    INDIA Outlook (USD Billion, 2019-2035)

    INDIA Silver Market by Application Type

    Jewelry

    Electronics

    Coins and Medals

    Photography

    Industrial Manufacturing

    INDIA Silver Market by End Use Industry Type

    Consumer Goods

    Automotive

    Medical

    Solar Energy

    Telecommunications

    INDIA Silver Market by Form Type

    Bars

    Coins

    Powder

    Foil

    Wire

    INDIA Silver Market by Purity Type

    Sterling Silver

    Fine Silver

    Coin Silver

    JAPAN Outlook (USD Billion, 2019-2035)

    JAPAN Silver Market by Application Type

    Jewelry

    Electronics

    Coins and Medals

    Photography

    Industrial Manufacturing

    JAPAN Silver Market by End Use Industry Type

    Consumer Goods

    Automotive

    Medical

    Solar Energy

    Telecommunications

    JAPAN Silver Market by Form Type

    Bars

    Coins

    Powder

    Foil

    Wire

    JAPAN Silver Market by Purity Type

    Sterling Silver

    Fine Silver

    Coin Silver

    SOUTH KOREA Outlook (USD Billion, 2019-2035)

    SOUTH KOREA Silver Market by Application Type

    Jewelry

    Electronics

    Coins and Medals

    Photography

    Industrial Manufacturing

    SOUTH KOREA Silver Market by End Use Industry Type

    Consumer Goods

    Automotive

    Medical

    Solar Energy

    Telecommunications

    SOUTH KOREA Silver Market by Form Type

    Bars

    Coins

    Powder

    Foil

    Wire

    SOUTH KOREA Silver Market by Purity Type

    Sterling Silver

    Fine Silver

    Coin Silver

    MALAYSIA Outlook (USD Billion, 2019-2035)

    MALAYSIA Silver Market by Application Type

    Jewelry

    Electronics

    Coins and Medals

    Photography

    Industrial Manufacturing

    MALAYSIA Silver Market by End Use Industry Type

    Consumer Goods

    Automotive

    Medical

    Solar Energy

    Telecommunications

    MALAYSIA Silver Market by Form Type

    Bars

    Coins

    Powder

    Foil

    Wire

    MALAYSIA Silver Market by Purity Type

    Sterling Silver

    Fine Silver

    Coin Silver

    THAILAND Outlook (USD Billion, 2019-2035)

    THAILAND Silver Market by Application Type

    Jewelry

    Electronics

    Coins and Medals

    Photography

    Industrial Manufacturing

    THAILAND Silver Market by End Use Industry Type

    Consumer Goods

    Automotive

    Medical

    Solar Energy

    Telecommunications

    THAILAND Silver Market by Form Type

    Bars

    Coins

    Powder

    Foil

    Wire

    THAILAND Silver Market by Purity Type

    Sterling Silver

    Fine Silver

    Coin Silver

    INDONESIA Outlook (USD Billion, 2019-2035)

    INDONESIA Silver Market by Application Type

    Jewelry

    Electronics

    Coins and Medals

    Photography

    Industrial Manufacturing

    INDONESIA Silver Market by End Use Industry Type

    Consumer Goods

    Automotive

    Medical

    Solar Energy

    Telecommunications

    INDONESIA Silver Market by Form Type

    Bars

    Coins

    Powder

    Foil

    Wire

    INDONESIA Silver Market by Purity Type

    Sterling Silver

    Fine Silver

    Coin Silver

    REST OF APAC Outlook (USD Billion, 2019-2035)

    REST OF APAC Silver Market by Application Type

    Jewelry

    Electronics

    Coins and Medals

    Photography

    Industrial Manufacturing

    REST OF APAC Silver Market by End Use Industry Type

    Consumer Goods

    Automotive

    Medical

    Solar Energy

    Telecommunications

    REST OF APAC Silver Market by Form Type

    Bars

    Coins

    Powder

    Foil

    Wire

    REST OF APAC Silver Market by Purity Type

    Sterling Silver

    Fine Silver

    Coin Silver

    South America Outlook (USD Billion, 2019-2035)

    South America Silver Market by Application Type

    Jewelry

    Electronics

    Coins and Medals

    Photography

    Industrial Manufacturing

    South America Silver Market by End Use Industry Type

    Consumer Goods

    Automotive

    Medical

    Solar Energy

    Telecommunications

    South America Silver Market by Form Type

    Bars

    Coins

    Powder

    Foil

    Wire

    South America Silver Market by Purity Type

    Sterling Silver

    Fine Silver

    Coin Silver

    South America Silver Market by Regional Type

    Brazil

    Mexico

    Argentina

    Rest of South America

    BRAZIL Outlook (USD Billion, 2019-2035)

    BRAZIL Silver Market by Application Type

    Jewelry

    Electronics

    Coins and Medals

    Photography

    Industrial Manufacturing

    BRAZIL Silver Market by End Use Industry Type

    Consumer Goods

    Automotive

    Medical

    Solar Energy

    Telecommunications

    BRAZIL Silver Market by Form Type

    Bars

    Coins

    Powder

    Foil

    Wire

    BRAZIL Silver Market by Purity Type

    Sterling Silver

    Fine Silver

    Coin Silver

    MEXICO Outlook (USD Billion, 2019-2035)

    MEXICO Silver Market by Application Type

    Jewelry

    Electronics

    Coins and Medals

    Photography

    Industrial Manufacturing

    MEXICO Silver Market by End Use Industry Type

    Consumer Goods

    Automotive

    Medical

    Solar Energy

    Telecommunications

    MEXICO Silver Market by Form Type

    Bars

    Coins

    Powder

    Foil

    Wire

    MEXICO Silver Market by Purity Type

    Sterling Silver

    Fine Silver

    Coin Silver

    ARGENTINA Outlook (USD Billion, 2019-2035)

    ARGENTINA Silver Market by Application Type

    Jewelry

    Electronics

    Coins and Medals

    Photography

    Industrial Manufacturing

    ARGENTINA Silver Market by End Use Industry Type

    Consumer Goods

    Automotive

    Medical

    Solar Energy

    Telecommunications

    ARGENTINA Silver Market by Form Type

    Bars

    Coins

    Powder

    Foil

    Wire

    ARGENTINA Silver Market by Purity Type

    Sterling Silver

    Fine Silver

    Coin Silver

    REST OF SOUTH AMERICA Outlook (USD Billion, 2019-2035)

    REST OF SOUTH AMERICA Silver Market by Application Type

    Jewelry

    Electronics

    Coins and Medals

    Photography

    Industrial Manufacturing

    REST OF SOUTH AMERICA Silver Market by End Use Industry Type

    Consumer Goods

    Automotive

    Medical

    Solar Energy

    Telecommunications

    REST OF SOUTH AMERICA Silver Market by Form Type

    Bars

    Coins

    Powder

    Foil

    Wire

    REST OF SOUTH AMERICA Silver Market by Purity Type

    Sterling Silver

    Fine Silver

    Coin Silver

    MEA Outlook (USD Billion, 2019-2035)

    MEA Silver Market by Application Type

    Jewelry

    Electronics

    Coins and Medals

    Photography

    Industrial Manufacturing

    MEA Silver Market by End Use Industry Type

    Consumer Goods

    Automotive

    Medical

    Solar Energy

    Telecommunications

    MEA Silver Market by Form Type

    Bars

    Coins

    Powder

    Foil

    Wire

    MEA Silver Market by Purity Type

    Sterling Silver

    Fine Silver

    Coin Silver

    MEA Silver Market by Regional Type

    GCC Countries

    South Africa

    Rest of MEA

    GCC COUNTRIES Outlook (USD Billion, 2019-2035)

    GCC COUNTRIES Silver Market by Application Type

    Jewelry

    Electronics

    Coins and Medals

    Photography

    Industrial Manufacturing

    GCC COUNTRIES Silver Market by End Use Industry Type

    Consumer Goods

    Automotive

    Medical

    Solar Energy

    Telecommunications

    GCC COUNTRIES Silver Market by Form Type

    Bars

    Coins

    Powder

    Foil

    Wire

    GCC COUNTRIES Silver Market by Purity Type

    Sterling Silver

    Fine Silver

    Coin Silver

    SOUTH AFRICA Outlook (USD Billion, 2019-2035)

    SOUTH AFRICA Silver Market by Application Type

    Jewelry

    Electronics

    Coins and Medals

    Photography

    Industrial Manufacturing

    SOUTH AFRICA Silver Market by End Use Industry Type

    Consumer Goods

    Automotive

    Medical

    Solar Energy

    Telecommunications

    SOUTH AFRICA Silver Market by Form Type

    Bars

    Coins

    Powder

    Foil

    Wire

    SOUTH AFRICA Silver Market by Purity Type

    Sterling Silver

    Fine Silver

    Coin Silver

    REST OF MEA Outlook (USD Billion, 2019-2035)

    REST OF MEA Silver Market by Application Type

    Jewelry

    Electronics

    Coins and Medals

    Photography

    Industrial Manufacturing

    REST OF MEA Silver Market by End Use Industry Type

    Consumer Goods

    Automotive

    Medical

    Solar Energy

    Telecommunications

    REST OF MEA Silver Market by Form Type

    Bars

    Coins

    Powder

    Foil

    Wire

    REST OF MEA Silver Market by Purity Type

    Sterling Silver

    Fine Silver

    Coin Silver


    Infographic

    Free Sample Request

    Kindly complete the form below to receive a free sample of this Report

    Get Free Sample

    Customer Strories

    “I am very pleased with how market segments have been defined in a relevant way for my purposes (such as "Portable Freezers & refrigerators" and "last-mile"). In general the report is well structured. Thanks very much for your efforts.”

    Victoria Milne

    Founder
    Case Study
    Chemicals and Materials