Silver Market (2026 - 2035)

Silver Market Size, Share & Industry Analysis Research Report By Application (Jewelry, Electronics, Coins and Medals, Photography, Industrial Manufacturing), By End Use Industry (Consumer Goods, Automotive, Medical, Solar Energy, Telecommunications), By Form (Bars, Coins, Powder, Foil, Wire), By Purity (Sterling Silver, Fine Silver, Coin Silver) and By Regional (North America, Europe, South America, Asia Pacific, Middle East and Africa) - Forecast to 2035.
ID: MRFR/CnM/6530-HCR
111 Pages
Chitranshi Jaiswal
Last Updated: July 02, 2026
Silver Market
Market Size
Forecast Period2026-2035
CAGR (2026-2035)4.95%
2025 Market Size40.42 Kilotons
2035 Market Size65.35 Kilotons
Key Players
Fresnillo PLC
Pan American Silver Corp
Newmont Corporation
Wheaton Precious Metals
First Majestic Silver Corp
Polymetal International
Opportunities
  • Urban-Scale Solar Mandates in Emerging Economies
  • Silver-Based Solid-State Battery Components
  • Data Monetization Through Supply-Chain Traceability

Silver Market Summary

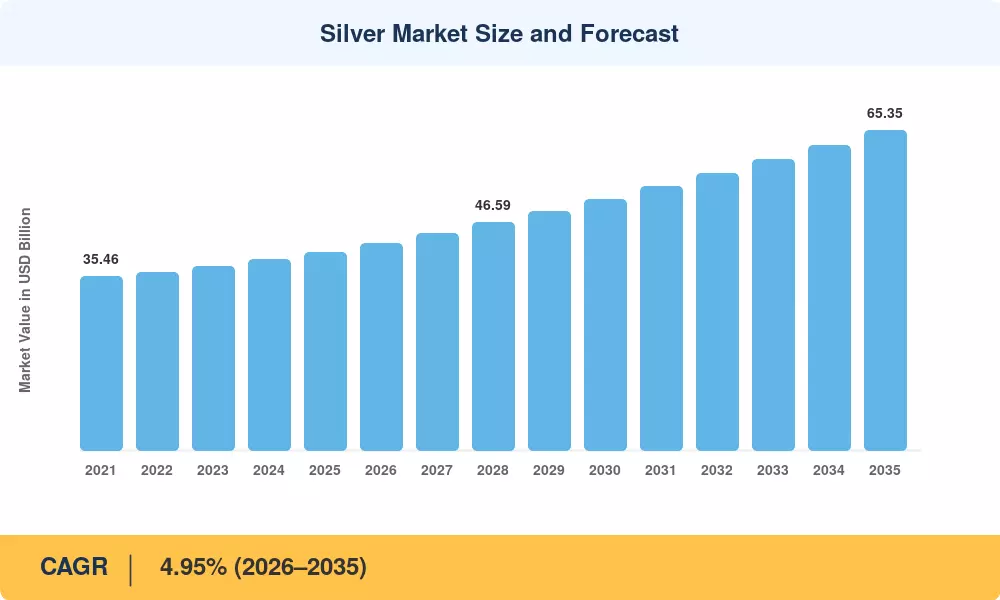
The Silver Market reached an estimated 40.42 kilotons of global consumption in 2025, rising to a projected 42.30 kilotons in 2026 as photovoltaic cell metallization, 5G infrastructure build-outs, and high-voltage direct-current connector adoption accelerated draw on refined supply. Over the 2026–2035 forecast window, the Silver Market is expected to expand at a 4.95% CAGR, reaching approximately 65.35 kilotons by 2035. Two catalysts anchor this trajectory: India's Production Linked Incentive scheme for electronics manufacturing, which commits over USD 10 billion in subsidies through 2029 [1], and the IEA's revised Net Zero roadmap calling for a tripling of utility-scale solar capacity by 2035 [2] — both directly intensifying silver offtake.

A structural transformation is reshaping how the Silver Market absorbs refined metal. Legacy thick-film paste formulations that loaded 100–120 mg of silver per photovoltaic cell are giving way to heterojunction and TOPCon architectures that cut loading per cell yet multiply total cell counts, keeping aggregate silver demand elevated. The U.S. Department of Energy's Solar Futures Study projects cumulative U.S. solar installations to surpass 1,000 GW by 2035, implying sustained silver consumption even as per-cell thrifting intensifies [3]. Electronics miniaturization in automotive radar, millimeter-wave 5G antennas, and medical biosensors is simultaneously opening high-value, low-volume channels that carry premium pricing.

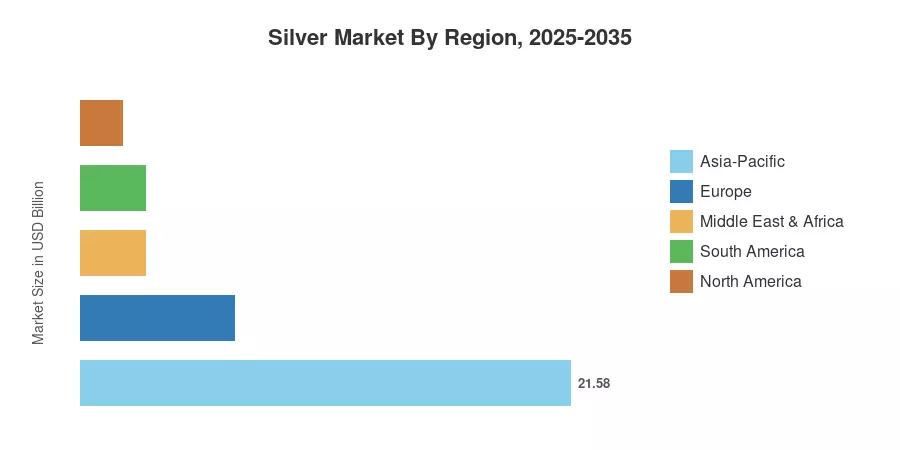
Asia-Pacific commands roughly 53.4% of global Silver Market consumption — driven by China's solar manufacturing dominance and India's fast-growing electronics assembly sector — and is forecast to post the fastest regional CAGR of 5.30% through 2035. North America accounts for about 18.2% of consumption, anchored by U.S. photovoltaic deployment targets and defense electronics procurement. Europe follows at 16.8%, where the REPowerEU plan and the Critical Raw Materials Act are channeling fresh investment into domestic silver refining. The decade ahead will test whether mine supply expansion and recycling innovation can keep pace with the Silver Market's broadening industrial appetite.


Key Report Takeaways

• By Type

  • Fine silver held 66.6% of Silver Market volume in 2025, reflecting its dominance across industrial fabrication and investment-grade bar production.
  • Argentium silver is forecast to register the fastest type-level CAGR of 5.10% through 2035, propelled by tarnish-resistant jewelry alloys and antimicrobial medical device coatings.

• By Application

  • Jewelry and silverware captured approximately 28.0% of the Silver Market volume in 2025, supported by robust consumer demand in India and Southeast Asia.
  • Electrical and electronics applications are projected to advance at a 5.15% CAGR between 2026 and 2035 as photovoltaic and 5G end-uses scale.

• By Region

  • Asia-Pacific accounted for 53.4% of global Silver Market consumption in 2025, underpinned by China's solar module output and India's electronics expansion.
  • North America is expected to grow at a 4.60% CAGR through 2035, with U.S. solar policy and defense procurement as primary demand levers.


Silver Market Size and Forecast (2021–2035)

Market Research Future's sizing model synthesizes mine production data from the World Bureau of Metal Statistics, refinery throughput from the Silver Institute, and downstream demand tracking across photovoltaic, electronics, and jewelry channels. Historical figures (2021–2024) reflect actuals; 2025 is the validated base year; 2026–2035 are forecast estimates applying a calibrated 4.95% CAGR with demand-weighted adjustments by end-use.
Silver Market Size and Forecast
Our Impact
Enabled $4.3B Revenue Impact for Fortune 500 and Leading Multinationals
Partnering with 2000+ Global Organizations Each Year
30K+ Citations by Top-Tier Firms in the Industry

Driver Impact Analysis

Driver ~% Impact on CAGR Geographic Relevance Impact Timeline
Utility-scale solar capacity expansion +1.4% Global Long-term (≥4 yr)
5G base-station and mmWave antenna deployment +0.9% Asia-Pacific, North America Medium-term (2–4 yr)
EV high-voltage connector adoption +0.7% Europe, China Medium-term (2–4 yr)
Electronics miniaturization (IoT, wearables) +0.5% Global Long-term (≥4 yr)
Antimicrobial coating mandates in healthcare +0.4% North America, Europe Short-term (≤2 yr)
India PLI scheme for electronics manufacturing +0.3% Asia-Pacific Short-term (≤2 yr)
Physical investment and ETF inflows +0.2% Global Medium-term (2–4 yr)


Utility-Scale Solar Capacity Expansion

The IEA's World Energy Outlook 2024 projects that global solar PV capacity must reach 5,400 GW by 2030 under the Stated Policies Scenario, up from roughly 1,600 GW at end-2023 [2]. Each GW of crystalline silicon capacity requires approximately 10–15 tonnes of silver paste, and while per-cell silver loading has fallen 8% since 2020, total cell volumes are growing fast enough to offset thrifting. China's National Energy Administration approved 217 GW of new solar in 2024 alone, a figure that guarantees sustained Silver Market pull through the decade. TOPCon and heterojunction architectures, despite lower per-cell loading, actually increase the number of silver metallization steps, preserving aggregate consumption.

5G and Millimeter-Wave Infrastructure

Global 5G base-station installations are expected to exceed 15 million units by 2028, each employing silver-palladium thick-film pastes in filters, antenna feed networks, and high-frequency connectors [7]. Millimeter-wave deployments in the 24–39 GHz bands demand tighter conductor tolerances where silver's superior conductivity becomes a non-negotiable specification. The Silver Market stands to absorb an incremental 800–1,200 tonnes annually from telecom alone by 2030, a channel that barely existed five years ago.

Electrification and High-Voltage Connectors

The transition to 800 V electrical architectures in battery electric vehicles requires silver-plated busbars and fast-charge connector contacts rated for sustained high-amperage cycles [14]. BloombergNEF estimates global EV sales will reach 30 million units per year by 2030, each using roughly 0.5–1.0 ounce of silver in powertrain and charging components. This represents a structural floor under the Silver Market that did not exist during the previous decade's consumption profile.

Antimicrobial Coatings in Healthcare

Post-pandemic infection control protocols have accelerated the adoption of silver-based antimicrobial coatings on hospital surfaces, catheters, and wound dressings. The U.S. FDA cleared 14 new silver-containing medical devices in 2024, the highest annual count on record [15]. Europe's Medical Device Regulation (MDR) now classifies antimicrobial-coated implants under Class III, increasing compliance requirements but also expanding the addressable Silver Market for certified nano-silver formulations.


Restraints Impact Analysis

The restraint percentages below are directional estimates of headwinds that moderate growth; they are not directly subtracted from the headline CAGR.

Restraint ~% Drag on CAGR Geographic Relevance Impact Timeline
Copper and aluminum substitution in PV ribbons −0.6% China, Southeast Asia Long-term (≥4 yr)
Regulatory tightening on mine approvals in Latin America −0.4% South America Medium-term (2–4 yr)
Silver thrifting in next-gen solar cells −0.3% Global Long-term (≥4 yr)
Price volatility discouraging downstream commitments −0.3% Global Short-term (≤2 yr)
Recycling capacity expansion reducing virgin demand −0.2% Europe, Japan Medium-term (2–4 yr)


Substitution Pressure from Base Metals

Copper-plated PV ribbon technology, pioneered by several Chinese cell manufacturers, can replace up to 80% of the silver in interconnect wiring. Aluminum-doped zinc oxide (AZO) transparent conductive layers are also under development as silver-free alternatives in thin-film panels [18]. While these substitutes sacrifice some conversion efficiency, ongoing cost pressure — especially during silver price spikes above USD 30 per troy ounce — incentivizes adoption. This dynamic creates a ceiling effect on Silver Market growth whenever spot prices surge.

Environmental Regulation of Mine Supply

Peru's Ministry of Energy and Mines extended the average permitting timeline for new silver-copper projects to 7.2 years in 2024, up from 5.1 years in 2019, reflecting stricter water-use and tailings-management standards [19]. Mexico's 2023 mining law reforms introduced community-consent provisions that have effectively halted three major silver projects in Zacatecas. These supply-side constraints tighten the availability of newly mined silver, creating periodic shortfalls that the Silver Market must cover through above-ground inventories and secondary recovery.

Silver Thrifting in Solar Cell Design

Cell manufacturers have reduced silver consumption per watt of solar capacity by roughly 30% over the past decade through finer screen-printing meshes, multi-busbar designs, and selective emitter doping [11]. The industry roadmap targets a further 15% reduction by 2030. While total Silver Market volume continues to grow because installed capacity is expanding far faster than per-cell savings, thrifting directly moderates the slope of demand growth.


Silver Market Opportunities

Urban-Scale Solar Mandates in Emerging Economies

India’s PM Surya Ghar project aims for 10 million residential rooftop solar systems by 2027, and Brazil’s distributed generation platform has already brought online 2.5 million systems [1]. Every rooftop installation metallizes the cells with silver paste, and the total amount from decentralized solar in emerging nations could increase annual Silver Market demand by 2,000 to 3,000 tonnes by 2030.


Silver-Based Solid-State Battery Components

Solid-state battery developers are studying silver-carbon composite anodes and silver-doped lithium electrolytes to boost ionic conductivity. Toyota in 2024 demonstrated prototype solid-state cells using silver current collectors, which have 40% less interfacial resistance than copper ones [14]. If solid-state batteries become a commercial reality for EV production by 2030, this might provide a whole new consumer channel for the Silver Market.


Data Monetization Through Supply-Chain Traceability

Blockchain-enabled tracing of provenance from the mine, through the refinery, to the end product is becoming a value-added service, commanding premiums of 3-5% on ethically certified silver bars. The LBMA Responsible Sourcing Programme and the Responsible Minerals Initiative are pushing adoption [20]. The Silver Market is an opportunity for companies investing in digital traceability technologies to differentiate their goods and attract institutional purchasers with ESG mandates.


Antimicrobial Textiles and Water Purification

A fast-growing sector is the incorporation of silver nanoparticles into technical textiles—sportswear, hospital linens, military outfits. The WHO’s 2024 guidelines on point-of-use water treatment supported colloidal silver filters for low-resource settings, enabling a public-health pathway that might expand fast in Sub-Saharan Africa and South Asia [15]. This expands the end-use base of the Silver Market beyond the conventional industrial and investment groups.


Secondary Recovery and Urban Mining

End-of-life photovoltaic panels are projected to generate 5 million tonnes of waste annually by 2035, containing recoverable silver valued at over USD 1 billion [12]. Japan and the EU are implementing extended producer responsibility schemes that mandate silver recovery rates above 85%. Building scalable urban mining infrastructure represents both an environmental imperative and a commercial opportunity within the Silver Market.


Silver Market Future Outlook

The Electrification Supercycle and Silver Intensity

Global electricity demand is projected to grow 3.4% annually through 2035, the fastest sustained rate since the 1970s, according to the IEA [2]. Solar photovoltaics will supply the majority of incremental generation, and crystalline silicon technology — which requires silver metallization — will dominate installations at least through 2032. The Silver Market's linkage to electricity generation positions it as a structural beneficiary of decarbonization, even as per-cell silver loading continues to decline.

AI-Driven Demand in Data Center and Semiconductor Fabrication

The explosion of AI training and inference workloads is driving a data center construction boom that the International Energy Agency estimates will double global data center electricity consumption by 2030 [22]. Silver-containing thermal interface materials, high-frequency connectors, and printed circuit board finishes are embedded in every server rack. As semiconductor nodes shrink below 3 nm, silver's role in advanced packaging — particularly in hybrid bonding and redistribution layers — could open a new high-value channel for the Silver Market.

Circular Economy and Secondary Silver Supply

End-of-life solar panels, spent electronics, and industrial catalysts collectively contain an estimated 4,000–6,000 tonnes of recoverable silver that will become available annually by the early 2030s [12]. The EU's revised Waste Electrical and Electronic Equipment Directive targets 90% precious-metal recovery by 2030, and Japan's Urban Mine concept has already demonstrated commercial-scale recovery. Scaling secondary supply will moderate the Silver Market's dependence on primary mining and reduce exposure to geopolitical supply disruption.

ESG Reporting and Responsible Sourcing Premiums

Institutional investors managing over USD 40 trillion in assets now apply ESG screens to commodity supply chains, and silver is no exception [20]. The LBMA's Responsible Silver Guidance and the Responsible Minerals Initiative's audit protocols are creating a two-tier Silver Market: certified responsibly sourced bars trade at 2–4% premiums over uncertified material. Miners and refiners that invest in traceability, community engagement, and emissions reduction stand to capture differentiated pricing through 2035.


Silver Market Segmentation

By Type

Segment Key Metric Primary Demand Driver
Fine Silver 66.6% of volume (2025) Industrial fabrication, investment bars, solar paste
Sterling Silver 4.45% CAGR (2026–2035) Jewelry, tableware, decorative arts
Argentium Silver 5.10% CAGR (2026–2035) Tarnish-resistant jewelry, medical devices
Coin Silver 2.18 kilotons (2025) Numismatic and commemorative mintage
Other Types 1.04 kilotons (2025) Specialty alloys, brazing, soldering


Fine silver dominates the Silver Market because its 99.9%+ purity is the required feedstock for photovoltaic paste, electronics-grade sputtering targets, and investment-grade bars and coins. Refineries in China, Japan, and Germany produce the vast majority of fine silver output, processing doré from Latin American and Australian mines. The segment's share has held steady over the past five years as industrial consumption growth has roughly matched investment demand growth.

Argentium silver — an alloy containing germanium that dramatically improves tarnish resistance — is the fastest-growing type segment in the Silver Market. Premium jewelry brands increasingly specify argentium for collections marketed to younger consumers who prioritize low-maintenance luxury. The alloy's antimicrobial properties also position it for medical device applications, including orthopedic implant coatings cleared under FDA Class II pathways [15].

By Application

Segment Key Metric Primary Demand Driver
Jewelry & Silverware 28.0% of volume (2025) Consumer demand in India, China, ASEAN
Electrical & Electronics 5.15% CAGR (2026–2035) PV cells, 5G infrastructure, automotive
Physical Investment 6.42 kilotons (2025) ETF inflows, central bank reserves, retail bars
Films (Photography) 1.64 kilotons (2025) Medical imaging, industrial X-ray
Alloys & Brazing 4.20% CAGR (2026–2035) Aerospace joining, HVAC manufacturing
Pharma & Medical 4.85% CAGR (2026–2035) Antimicrobial coatings, wound care, diagnostics
Other Applications 2.38 kilotons (2025) Catalysts, mirrors, batteries


Jewelry and silverware remain the largest single application in the Silver Market by volume, driven by India's cultural affinity for silver adornment and China's expanding middle class. India alone consumes over 6,000 tonnes of silver annually for jewelry and religious artifacts, with consumption spiking during wedding and festival seasons. The segment's growth rate, however, trails the industrial categories as discretionary spending fluctuates with economic cycles.

Electrical and electronics is the fastest-growing application and the primary reason the Silver Market has outperformed broader metals indices in recent years. Photovoltaic cell metallization alone consumed an estimated 6,000 tonnes globally in 2024, a figure that could reach 9,000 tonnes by 2030 under IEA solar deployment scenarios [2]. The convergence of 5G, automotive electrification, and AI-driven semiconductor demand creates multiple reinforcing vectors that underpin the Silver Market's forward growth trajectory.


Regional Market Share Analysis

Region Key Metric Primary Investment Themes
Asia-Pacific 53.4% of global consumption (2025) Solar cell manufacturing, electronics assembly, jewelry fabrication
North America 4.60% CAGR (2026–2035) Photovoltaic deployment, defense electronics, ETF inflows
Europe 16.8% of global consumption (2025) REPowerEU solar targets, automotive electrification, refining capacity
South America 7.1% of global consumption (2025) Mine production leadership, domestic jewelry demand
Middle East & Africa 2.88 kilotons (2025) Infrastructure electrification, emerging solar markets
Total 40.42 kilotons (2025)

The Silver Market's consumption geography is heavily tilted toward Asia-Pacific, reflecting the region's concentration of solar cell manufacturing, electronics assembly, and jewelry fabrication. Production geography, by contrast, centers on Latin America. The table below summarizes regional consumption shares and growth themes.


North America

Country Key Metric Key Driver
United States 5.98 kilotons (2025) Solar IRA credits, defense electronics procurement
Canada 0.89 kilotons (2025) Mining output, industrial fabrication
Mexico 0.48 kilotons (2025) Largest global mine producer; domestic consumption growing


The United States drives the bulk of North American Silver Market consumption, with the Inflation Reduction Act's manufacturing tax credits spurring domestic solar cell production that requires domestically sourced or refined silver. Canada's silver consumption is modest but its mining output — particularly from British Columbia and Ontario operations — feeds global refining chains. Mexico's unique position as the world's leading silver mine producer means domestic policy on mining concessions directly shapes global supply dynamics for the Silver Market.

Europe

Country Key Metric Key Driver
Germany 2.85% CAGR (2026–2035) Automotive electrification, industrial electronics
United Kingdom 1.12 kilotons (2025) LBMA trading hub, investment demand
France 3.10% CAGR (2026–2035) Nuclear-solar hybrid projects, defense
Italy 0.74 kilotons (2025) Jewelry fabrication, photovoltaics
Spain 3.25% CAGR (2026–2035) Utility-scale solar expansion
Nordic Countries 0.51 kilotons (2025) Green technology, electronics
Russia 0.68 kilotons (2025) Domestic refining, reduced export channels
Rest of Europe 1.22 kilotons (2025) Diversified industrial consumption


Europe's Silver Market consumption is shaped by the REPowerEU plan's target of 750 GW installed solar by 2030 and the EU Critical Raw Materials Act, which designates silver as strategically important. The United Kingdom's London Bullion Market Association remains the world's primary trading and settlement venue, giving London outsized influence on global silver pricing. Germany's automotive OEMs are increasing silver use in EV power electronics, while Spain's solar boom has made it Europe's largest per-capita solar consumer.

Asia-Pacific

Country Key Metric Key Driver
China 31.8% of global consumption Solar cell production, electronics manufacturing
India 5.30% CAGR (2026–2035) PLI electronics scheme, jewelry, rooftop solar
Japan 3.86 kilotons (2025) Electronics, automotive, recycling leadership
South Korea 4.75% CAGR (2026–2035) Semiconductor fabrication, display manufacturing
ASEAN 2.14 kilotons (2025) Electronics assembly relocation from China
Rest of Asia-Pacific 1.28 kilotons (2025) Emerging industrial demand


Asia-Pacific's dominance in the Silver Market reflects China's position as a manufacturer of over 80% of global solar cells and a major share of consumer electronics [6]. India is the fastest-growing consumption center, with Silver Market demand rising on three fronts: the PLI scheme's electronics manufacturing subsidies, robust wedding-season jewelry purchases, and the PM Surya Ghar rooftop solar programme. Japan's advanced recycling infrastructure recovers significant volumes from end-of-life electronics, partially offsetting its import dependence.

South America

Country Key Metric Key Driver
Brazil 1.18 kilotons (2025) Distributed solar generation, jewelry
Argentina 3.90% CAGR (2026–2035) Lithium-silver co-extraction, emerging solar
Rest of South America 1.14 kilotons (2025) Peru and Bolivia mine production centers


South America's Silver Market profile is unique because the region is simultaneously the world's largest mine producer and a relatively small consumer. Peru holds the planet's largest identified silver reserves, while Bolivia's Cerro Rico remains an iconic — if depleted — producing district [19]. Brazil's rapidly growing distributed solar sector is the primary consumption growth vector, with over 2.5 million connected systems generating sustained demand for silver-containing PV cells.

Middle East & Africa

Country Key Metric Key Driver
Saudi Arabia 4.15% CAGR (2026–2035) NEOM and Vision 2030 solar mega-projects
UAE 0.52 kilotons (2025) Gold-silver refining hub, jewelry re-export
South Africa 0.61 kilotons (2025) Mining output, industrial fabrication
Egypt 3.85% CAGR (2026–2035) Benban solar complex expansion
Rest of MEA 0.88 kilotons (2025) Infrastructure electrification


The Middle East & Africa Silver Market is small but growing quickly, driven by Gulf states' solar mega-projects and Sub-Saharan Africa's electrification push. Saudi Arabia's NEOM project alone plans over 10 GW of renewable capacity, translating into meaningful silver paste demand [21]. The UAE functions as a refining and re-export hub, processing doré bars from African mines for Asian fabricators. South Africa's Bushveld Complex produces silver as a by-product of platinum group metals mining, linking supply dynamics to PGM market conditions.


Silver Market By Region, 2025-2035

Competitive Benchmarking

The Silver Market exhibits low concentration, with an estimated Herfindahl-Hirschman Index below 600 and the top five producers collectively controlling roughly 22–28% of global mine output. This fragmentation reflects the geographic dispersion of silver deposits — often extracted as a by-product of lead, zinc, copper, and gold mining — and the separation between mine production, refining, and downstream fabrication. No single entity dominates the full value chain from ore to end-product.

Company Est. Revenue Share Range Key Offerings for Silver Market Strategic Positioning
Fresnillo PLC ~5–8% Primary silver and gold mine production World's largest primary silver producer; Mexico-focused operations
Pan American Silver Corp ~4–7% Silver and gold mining across the Americas Diversified mine portfolio spanning Mexico, Peru, Canada, Bolivia
Newmont Corporation ~3–6% Silver is a by-product of gold operations Scale advantage from Newcrest merger; global mine footprint
Wheaton Precious Metals ~3–5% Silver streaming and royalty agreements Asset-light streaming model; long-term offtake contracts
First Majestic Silver Corp ~2–4% Primary silver production in Mexico Pure-play silver focus; vertical integration into minting
Hecla Mining Company ~2–4% Silver, gold, lead, zinc mining in North America Largest U.S. silver producer; Greens Creek and Lucky Friday mines
Polymetal International ~2–4% Silver and gold mining in the CIS region Significant silver output from Dukat and Omolon hubs
Coeur Mining Inc. ~1–3% Silver and gold production in the Americas Focused portfolio with Rochester expansion completed
Hochschild Mining PLC ~1–3% Underground silver and gold mining Peru and Argentina focus; deep underground expertise
MAG Silver Corp ~1–2% High-grade silver development projects Juanicipio JV with Fresnillo; emerging major producer


Recent News & Developments

  • Fresnillo pIc (April 2024 ) launched a USD 500 million program to improve its mining infrastructure with AI-driven tools, aiming to increase production efficiency by 15%.
  • Pan American Silver (June 2023) acquired Maverix Metals in a deal that will grow its royalty portfolio and bolster its financial resiliency in the face of volatile silver prices.


  • LBMA (October 2023): Published updated Responsible Silver Guidance requiring third-party audits of mine-to-refinery supply chains, setting a new compliance baseline for the global Silver Market [20].


Silver Market Report Scope

Parameter Detail
Market Scope Global Silver Market — production, refining, and consumption of silver across all end-use applications
Study Period 2021–2035
CAGR (Forecast) 4.95% (2026–2035)
Market Size — Base Year (2025) 40.42 Kilotons
Market Size — Forecast End (2035) 65.35 Kilotons
Fastest Growing Segment (Type) Argentium Silver (5.10% CAGR)
Fastest Growing Segment (Application) Electrical & Electronics (5.15% CAGR)
Fastest Growing Region Asia-Pacific (5.30% CAGR)
Companies Profiled 10 (Fresnillo, Pan American Silver, Newmont, Wheaton, First Majestic, Hecla, Polymetal, Coeur, Hochschild, MAG Silver)
Valuation Unit Volume (Kilotons)


FAQs

How does silver's by-product status affect supply predictability?
Around 70% of mined silver comes as a by-product of lead, zinc, copper, and gold extraction, meaning supply responds to those metals' economics rather than silver-specific demand signals. This structural disconnect can create shortfalls when base-metal mines curtail output during price downturns [4].
What distinguishes silver streaming from traditional mining investment?
Streaming companies provide upfront capital to miners in exchange for future silver delivery at predetermined below-market prices. This model offers investors exposure to the Silver Market with lower operational risk than direct mine ownership [17].
How are perovskite solar cells expected to affect silver consumption?
Perovskite-silicon tandem cells still require a silver metallization layer on the silicon subcell. Pure perovskite single-junction cells could eliminate silver entirely, but commercial viability remains at least a decade away [16].
What role does silver play in water purification technologies?
Silver ions disrupt bacterial cell membranes, making colloidal silver effective in point-of-use water filters for regions lacking centralized treatment. WHO-endorsed silver-ceramic filters are scaling in Sub-Saharan Africa [15].
How do silver ETF holdings influence physical market balances?
Global silver ETFs held approximately 22,000 tonnes at end-2024, representing locked-up inventory that tightens available float. Large inflows or redemptions can amplify price volatility [17].
What supply-chain risks does the Silver Market face from geopolitical tensions?
Mexico and Peru account for roughly 40% of global mine production, concentrating supply in jurisdictions undergoing regulatory reform. Trade restrictions or nationalization moves could disrupt refined silver availability [19].
Can recycled silver fully substitute for primary mine output by 2035?
Secondary recovery currently meets about 15–18% of annual demand. Even with aggressive recycling mandates, mine production will remain essential because e-waste and end-of-life solar panels cannot scale fast enough to close the gap [12].    
Author
Author
Author Profile
Chitranshi Jaiswal LinkedIn
Team Lead - Research
Chitranshi is a Team Leader in the Chemicals & Materials (CnM) and Energy & Power (EnP) domains, with 6+ years of experience in market research. She leads and mentors teams to deliver cross-domain projects that equip clients with actionable insights and growth strategies. She is skilled in market estimation, forecasting, competitive benchmarking, and both primary & secondary research, enabling her to turn complex data into decision-ready insights. An engineer and MBA professional, she combines technical expertise with strategic acumen to solve dynamic market challenges. Chitranshi has successfully managed projects that support market entry, investment planning, and competitive positioning, while building strong client relationships. Certified in Advanced Excel & Power BI she leverages data-driven approaches to ensure accuracy, clarity, and impactful outcomes.

Research Approach


Secondary Research

The secondary research process involved comprehensive analysis of government geological surveys, central bank reserve databases, precious metals exchanges, mining regulatory filings, and authoritative commodity research institutions. Key sources included the United States Geological Survey (USGS) National Minerals Information Center, London Bullion Market Association (LBMA), Commodity Futures Trading Commission (CFTC), Silver Institute (World Silver Survey), World Bank Commodity Price Data (Pink Sheet), International Monetary Fund (IMF) Primary Commodity Prices, National Mining Association (NMA), Eurometaux (European non-ferrous metals association), China Gold Association (Silver Division), Environment Canada (Mining and Processing Regulations), Australian Bureau of Statistics (Mineral and Petroleum Exploration), Peruvian Ministry of Energy and Mines, Mexican Geological Survey, and Bloomberg/Reuters Commodity Indices.

In order to gather information for primary silver mining, by-product silver recovery, scrap recycling, downstream industrial applications, purity-grade pricing differentials, above-ground stock data, industrial consumption figures, and regulatory compliance data, these sources were utilized.


Primary Research

In order to gather qualitative and quantitative information on production costs, refining capacity, fabrication demand, and investment flows, supply-side and demand-side players were interviewed during the primary research process. CEOs, VPs of exploration, chief geologists, heads of concentrator operations, and sustainability directors from major silver mining firms, polymetallic ore processors, and precious metals refineries were among the supply-side sources. The demand-side sources included bullion dealers, managers of precious metals ETF funds, central bank reserve asset managers, solar photovoltaic cell fabricators, jewelry manufacturing associations, automobile connection suppliers, and procurement directors from semiconductor and electronics manufacturers. In addition to verifying mining development schedules and validating industrial demand segmentation, primary research also provided information on price hedging mechanisms, inventory management tactics, and replacement threats.

Primary Respondent Breakdown:

By Designation: C-level Primaries (30%), Vice President Level (32%), Others (38%)

By Region: North America (40%), Europe (22%), Asia-Pacific (28%), Rest of World (10%)


Market Size Estimation

Price analysis throughout the value chain and production volume mapping were used to get the global market valuation. The following were part of the methodology:

45+ major mining operations and refineries in Mexico, Peru, China, Australia, Chile, as well as secondary industrial hubs in North America and Europe have been identified.

Product mapping between Industrial/Commercial Grades, High Purity (99.9%+), and Sterling Grade (92.5%)

Examination of yearly revenues for silver-equivalent ounces as reported and projected, including by-product credits from lead-zinc and copper operations

coverage of companies engaged in mining and refining that will account for 75–80% of the world's silver supply in 2024

Verification of industrial demands in the fields of electronics (bonded wire, electrical connections), photovoltaics (metallization of solar cells), brazing alloys, jewelry and cutlery, and investment fabrications

To determine segment-specific valuations, extrapolation is done using top-down (validating manufacturer revenue against export data from national customs databases and UN Comtrade) and bottom-up (mine production × LBMA spot price modifications by purity) methods.

To improve estimates of the overall market volume, above-ground inventories and scrap recycling flows from metal service centers and urban mining operations are included (estimated at 15-20% of the total supply).

Download Free Sample

Kindly complete the form below to receive a free sample of this Report

Download PDF ×

We do not share your information with anyone. However, we may send you emails based on your report interest from time to time. You may contact us at any time to opt-out.

















