• Cat-intel
  • MedIntelliX
  • Resources
  • About Us
  • Hero Background
    English
    Chinese
    French
    Japanese
    Korean
    German
    Spanish

    Vapor Deposition Market Share

    ID: MRFR/CnM/2152-CR
    140 Pages
    Anshula Mandaokar
    May 2018

    Vapor Deposition Market, By Process (CVD and PVD), By Application (Into Microelectronics, Cutting Tool, Medical Devices & Equipment and Decorative Coatings) and By End-Use (Electrical & Electronics, Automotive, Aerospace) – Forecast till 2035

    Share:
    Download PDF ×

    We do not share your information with anyone. However, we may send you emails based on your report interest from time to time. You may contact us at any time to opt-out.

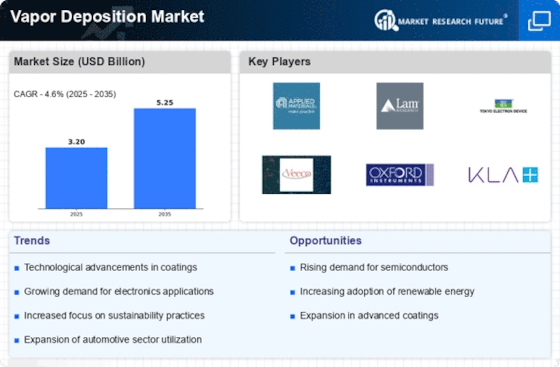
    Vapor Deposition Market Infographic
    Purchase Options

    Market Share

    Vapor Deposition Market Share Analysis

    In the competitive landscape of the Vapor Deposition Market, companies employ various market share positioning strategies to establish their presence and gain a competitive edge. One prevalent strategy is differentiation, where companies emphasize unique features or capabilities of their vapor deposition technology to stand out from competitors. This could involve highlighting superior deposition rates, precision, or the ability to coat a wide range of substrates. By positioning themselves as offering something distinct, companies can attract customers seeking specific benefits or performance metrics.

    Another key strategy is cost leadership, wherein companies aim to capture market share by offering vapor deposition solutions at lower prices compared to competitors. This approach requires efficient production processes, economies of scale, and effective cost management to maintain profitability while undercutting prices. By appealing to cost-conscious customers, companies can expand their market share, especially in price-sensitive segments or regions where budget constraints are significant factors in purchasing decisions.

    Furthermore, companies may adopt a niche market strategy, focusing on serving specific industry verticals or applications within the vapor deposition market. By specializing in particular niches such as semiconductor manufacturing, automotive coatings, or medical device fabrication, companies can tailor their offerings to meet the unique requirements and challenges of these sectors. This targeted approach allows companies to deepen their expertise, build strong relationships with customers, and command premium prices for specialized solutions, thus enhancing their market share within these niches.

    Collaboration and partnerships are also vital strategies for market share positioning in the vapor deposition market. Companies may form strategic alliances with complementary technology providers, research institutions, or end-users to co-develop innovative solutions, expand market reach, or access new customer segments. By leveraging the strengths and resources of partners, companies can accelerate product development, enhance market visibility, and create synergies that drive mutual growth and market share expansion.

    Moreover, continuous innovation and product development are critical for maintaining and growing market share in the dynamic vapor deposition industry. Companies must invest in research and development to stay ahead of technological advancements, improve product performance, and address evolving customer needs and market trends. By regularly introducing new and enhanced vapor deposition systems, processes, or materials, companies can differentiate themselves, attract new customers, and retain existing ones, thereby strengthening their market position over time.

    Additionally, effective marketing and branding strategies play a crucial role in market share positioning within the vapor deposition market. Companies need to effectively communicate their value proposition, competitive advantages, and differentiation strategies to target audiences through various channels such as advertising, trade shows, digital marketing, and industry publications. Building a strong brand reputation based on reliability, quality, and innovation can help companies gain customer trust, loyalty, and preference, ultimately leading to increased market share and sustainable growth.

    Furthermore, geographical expansion and market penetration are essential strategies for companies looking to increase their market share in the vapor deposition industry. By entering new regional markets or expanding their presence in existing ones, companies can tap into untapped opportunities, reach more customers, and diversify their revenue streams. This may involve establishing local sales and service networks, adapting products to local preferences or regulations, and understanding cultural nuances to effectively compete and capture market share in different regions.

    Author
    Anshula Mandaokar
    Team Lead - Research

    Anshula Mandaokar holds an academic degree in Chemical Engineering and has been contributing to the field for more than 5 years. She has expertise in Market Research and Business Consulting and serves as a Team Lead for a reputed Market Research firm under the Chemicals and Materials domain spectrum. She has worked on multiple projects, generating explicit results in a quick turnaround time. Her understanding of data interpretation justifies her role as a leader.

    Leave a Comment

    FAQs

    What is the projected market valuation of the Vapor Deposition Market by 2035?

    The Vapor Deposition Market is projected to reach a valuation of 5.248 USD Billion by 2035.

    What was the market valuation of the Vapor Deposition Market in 2024?

    In 2024, the Vapor Deposition Market had a valuation of 3.2 USD Billion.

    What is the expected CAGR for the Vapor Deposition Market during the forecast period 2025 - 2035?

    The expected CAGR for the Vapor Deposition Market during the forecast period 2025 - 2035 is 4.6%.

    Which segments are included in the Vapor Deposition Market analysis?

    The Vapor Deposition Market analysis includes segments such as Process, Application, and End-Use.

    What are the projected values for Chemical Vapor Deposition (CVD) and Physical Vapor Deposition (PVD) by 2035?

    By 2035, Chemical Vapor Deposition (CVD) is projected to reach 2.56 USD Billion, while Physical Vapor Deposition (PVD) is expected to reach 2.688 USD Billion.

    Market Summary

    As per MRFR analysis, the Vapor Deposition Market Size was estimated at 3.2 USD Billion in 2024. The Vapor Deposition industry is projected to grow from 3.347 USD Billion in 2025 to 5.248 USD Billion by 2035, exhibiting a compound annual growth rate (CAGR) of 4.6 during the forecast period 2025 - 2035.

    Key Market Trends & Highlights

    The Vapor Deposition Market is experiencing robust growth driven by technological advancements and sustainability initiatives.

    • North America remains the largest market for vapor deposition technologies, driven by its strong electronics sector.
    • Asia-Pacific is emerging as the fastest-growing region, fueled by increasing industrialization and demand for advanced materials.
    • Chemical Vapor Deposition (CVD) continues to dominate the market, while Physical Vapor Deposition (PVD) is witnessing rapid growth due to its applications in various industries.
    • Rising demand for electronics and advancements in coating technologies are key drivers propelling the market forward.

    Market Size & Forecast

    2024 Market Size 3.2 (USD Billion)
    2035 Market Size 5.248 (USD Billion)
    CAGR (2025 - 2035) 4.6%
    Largest Regional Market Share in 2024 Asia Pacific

    Major Players

    <p>Applied Materials (US), Lam Research (US), Tokyo Electron (JP), Veeco Instruments (US), Oxford Instruments (GB), KLA Corporation (US), MKS Instruments (US), AIXTRON (DE), SUSS MicroTec (DE)</p>

    Market Trends

    The Vapor Deposition Market is currently experiencing a dynamic evolution, driven by advancements in technology and increasing demand across various sectors. This market encompasses a range of deposition techniques, including chemical vapor deposition and physical vapor deposition, which are utilized in the production of thin films and coatings. Industries such as electronics, optics, and renewable energy are particularly influential, as they seek to enhance product performance and durability. The ongoing push for miniaturization in electronics and the need for high-performance materials are propelling innovation within this space. Furthermore, environmental considerations are prompting manufacturers to adopt more sustainable practices, which may reshape the competitive landscape. In addition, the Vapor Deposition Market appears to be influenced by the growing trend of automation and smart manufacturing. As industries increasingly integrate advanced technologies, the demand for precision and efficiency in vapor deposition processes is likely to rise. This shift may lead to the development of more sophisticated equipment and techniques, enhancing the overall quality of deposited films. Moreover, collaborations between research institutions and industry players could foster new applications and expand the market's reach. Overall, the Vapor Deposition Market is poised for continued growth, driven by technological advancements and evolving consumer needs.

    Sustainability Initiatives

    The Vapor Deposition Market is witnessing a notable shift towards sustainable practices. Manufacturers are increasingly focusing on eco-friendly materials and processes, aiming to reduce waste and energy consumption. This trend is likely to influence product development and operational strategies, as companies seek to align with global sustainability goals.

    Technological Advancements

    Rapid technological innovations are reshaping the Vapor Deposition Market. New techniques and equipment are emerging, enhancing the efficiency and precision of deposition processes. This evolution may lead to improved product quality and expanded applications across various industries, particularly in electronics and optics.

    Integration of Automation

    The integration of automation within the Vapor Deposition Market is becoming more prevalent. As industries adopt smart manufacturing practices, the demand for automated deposition systems is likely to increase. This trend may enhance production efficiency and consistency, ultimately benefiting manufacturers and end-users alike.

    The Global Vapor Deposition Market is poised for robust growth, driven by increasing demand in sectors such as electronics and renewable energy, which underscores the technology's critical role in advancing material science and manufacturing processes.

    U.S. Department of Energy

    Vapor Deposition Market Market Drivers

    Rising Demand for Electronics

    The increasing demand for electronic devices is a primary driver of the Vapor Deposition Market. As consumer electronics continue to evolve, manufacturers require advanced materials that enhance performance and durability. The market for electronic devices is projected to reach USD 1 trillion by 2025, which indicates a substantial growth opportunity for vapor deposition technologies. These technologies are essential for producing thin films and coatings that improve the functionality of semiconductors, displays, and other electronic components. Consequently, the Vapor Deposition Market is likely to experience significant growth as it caters to the needs of the electronics sector, which is characterized by rapid innovation and a constant push for higher efficiency.

    Growth in Renewable Energy Sector

    The expansion of the renewable energy sector is significantly influencing the Vapor Deposition Market. Technologies such as solar panels and wind turbines require specialized coatings to enhance efficiency and durability. The Vapor Deposition is projected to grow at a CAGR of 20% from 2025, which suggests a burgeoning demand for vapor deposition processes that can produce high-quality photovoltaic materials. Additionally, the need for protective coatings in wind energy applications is also on the rise. As the world shifts towards sustainable energy solutions, the Vapor Deposition Market is poised to benefit from increased investments and innovations aimed at improving energy efficiency and performance.

    Emerging Applications in Healthcare

    The healthcare sector is increasingly adopting vapor deposition technologies, which is driving growth in the Vapor Deposition Market. Applications such as medical devices, implants, and diagnostic equipment require specialized coatings to enhance biocompatibility and functionality. The global market for medical devices is expected to reach USD 500 billion by 2025, indicating a substantial opportunity for vapor deposition processes. These technologies can provide antimicrobial properties and improve the longevity of medical products, which is crucial in a field where reliability is paramount. As healthcare continues to evolve, the demand for advanced materials produced through vapor deposition is likely to increase, further expanding the market.

    Advancements in Coating Technologies

    Technological advancements in coating processes are reshaping the Vapor Deposition Market. Innovations such as atomic layer deposition (ALD) and chemical vapor deposition (CVD) are enabling the production of thinner, more uniform films with enhanced properties. These advancements are particularly relevant in industries such as aerospace and automotive, where high-performance coatings are critical for safety and efficiency. The market for advanced coatings is expected to grow at a CAGR of 6.5% through 2025, reflecting the increasing reliance on vapor deposition techniques. As industries seek to improve product performance and reduce weight, the demand for sophisticated vapor deposition technologies is anticipated to rise, further propelling the market forward.

    Focus on Environmental Sustainability

    The growing emphasis on environmental sustainability is a key driver for the Vapor Deposition Market. Industries are increasingly seeking eco-friendly materials and processes to reduce their carbon footprint. Vapor deposition techniques, which often utilize less energy and generate fewer emissions compared to traditional manufacturing methods, are becoming more attractive. The market for sustainable materials is projected to grow significantly, with many companies committing to sustainability goals by 2025. This trend is likely to encourage the adoption of vapor deposition technologies, as they align with the objectives of reducing waste and enhancing resource efficiency. As a result, the Vapor Deposition Market is expected to see a rise in demand for sustainable solutions.

    Market Segment Insights

    By Process: Chemical Vapor Deposition (CVD) (Largest) vs. Physical Vapor Deposition (PVD) (Fastest-Growing)

    <p>In the Vapor Deposition Market, Chemical Vapor Deposition (CVD) continues to dominate with the largest share due to its extensive applications in producing high-performance materials in microelectronics and optoelectronics. CVD is favored for its ability to create thin films with precise chemical compositions, making it indispensable for the semiconductor industry. Conversely, Physical Vapor Deposition (PVD) is witnessing rapid growth as it gains popularity in various industries like aerospace and renewable energy for coating applications. This has led to an expanded adoption of PVD technology for its efficiency and flexibility in material selection.</p>

    <p>Process: CVD (Dominant) vs. PVD (Emerging)</p>

    <p>Chemical Vapor Deposition (CVD) remains the dominant process in the Vapor Deposition Market, credited for its capability to create high-quality, uniform coatings essential in semiconductors and photovoltaics. Its processes, which rely on chemical reactions to deposit materials on substrates, are robust and have a proven track record in producing advanced materials. On the other hand, Physical Vapor Deposition (PVD) is considered an emerging technology that is quickly gaining traction. PVD techniques, involving the physical transition of materials from solid to vapor and then back to solid on the substrate, provide versatility and are ideal for various applications including decorative and protective coatings. The rapid advancements in PVD are contributing to its increased use across multiple sectors.</p>

    By Application: Microelectronics (Largest) vs. Decorative Coatings (Fastest-Growing)

    <p>In the Vapor Deposition Market, the application segment is predominantly driven by microelectronics, which commands the largest market share due to its critical role in semiconductor manufacturing and consumer electronics. Following closely are decorative coatings, cutting tools, and medical devices & equipment, each contributing to the diverse landscape of vapor deposition technologies. While microelectronics remains the cornerstone, the other applications indicate significant growth potential as industries evolve.</p>

    <p>Microelectronics (Dominant) vs. Medical Devices & Equipment (Emerging)</p>

    <p>The microelectronics segment stands as the dominant force in the vapor deposition market, benefiting from continuous advancements in technology and increased demand for smaller, more efficient electronic components. This dominance is counterbalanced by the emerging segment of medical devices & equipment, which is gaining traction due to the rising demand for innovative healthcare solutions. Vapor deposition processes enhance the functionality and durability of medical instruments, making it an attractive area for investment. Both segments reflect the adaptability and versatility of vapor deposition technologies, meeting the evolving needs of their respective industries.</p>

    By End-Use: Electrical & Electronics (Largest) vs. Automotive (Fastest-Growing)

    <p>The Vapor Deposition Market is significantly segmented by end-use applications, with the Electrical & Electronics sector occupying the largest share. This segment benefits from the growing demand for electronic components, such as semiconductors and photovoltaic cells, that require advanced coating technologies to enhance performance and durability. Following closely, the Automotive sector is gaining traction as manufacturers seek out vapor deposition techniques to improve component reliability and reduce weight, indicating a shift toward more sustainable automotive technologies. In terms of growth trends, the Electrical & Electronics segment is driven by rapid technological advancements and the continuous evolution of smart devices. In contrast, the Automotive sector is fueled by the increasing adoption of electric vehicles (EVs) that require innovative materials and coatings, positioning it as the fastest-growing segment within the Vapor Deposition Market. The overall demand for efficient and durable coatings in these sectors is expected to stimulate further growth in the coming years.</p>

    <p>Electrical & Electronics (Dominant) vs. Automotive (Emerging)</p>

    <p>The Electrical & Electronics segment leads the Vapor Deposition Market due to its essential role in the manufacturing of advanced electronic devices and components. This segment leverages sophisticated deposition techniques to create thin films that enhance functionality, such as improved conductivity and protection against environmental factors. As technology continues to advance, the demand for tailored coatings in applications like organic semiconductors, LEDs, and solar panels further solidifies this segment's dominant position. On the other hand, the Automotive segment is emerging as a key player, driven by the automotive industry's shift toward lighter, more efficient vehicles. Vapor deposition technologies are increasingly employed to apply protective coatings that enhance the longevity and performance of automotive parts. As EV adoption rises, the necessity for innovative coating solutions that contribute to vehicle efficiency and performance enhancements will continue to propel this segment forward.</p>

    Get more detailed insights about Vapor Deposition Market Research Report – Forecast to 2032

    Regional Insights

    North America : Innovation and Technology Hub

    North America is the largest market for vapor deposition, holding approximately 45% of the global share. The region's growth is driven by advancements in semiconductor manufacturing, increasing demand for electronic devices, and supportive government regulations promoting innovation. The U.S. is the primary contributor, followed by Canada, which is rapidly expanding its technological capabilities. Regulatory frameworks are also evolving to support sustainable practices in manufacturing. The competitive landscape in North America is dominated by key players such as Applied Materials, Lam Research, and KLA Corporation. These companies are at the forefront of technological advancements, focusing on R&D to enhance vapor deposition processes. The presence of major semiconductor manufacturers further strengthens the market, creating a robust ecosystem for innovation and collaboration. The region's commitment to maintaining its leadership position is evident through continuous investments in technology and infrastructure.

    Europe : Emerging Market with Growth Potential

    Europe is witnessing significant growth in the vapor deposition market, accounting for approximately 30% of the global share. The region's expansion is fueled by increasing investments in renewable energy technologies and advancements in the automotive sector, particularly electric vehicles. Countries like Germany and France are leading this growth, supported by EU regulations that encourage sustainable manufacturing practices and innovation in technology. Germany stands out as a key player in the vapor deposition landscape, with companies like AIXTRON and SUSS MicroTec leading the charge. The competitive environment is characterized by a mix of established firms and emerging startups focusing on innovative solutions. The European market is also benefiting from collaborative efforts between industry and academia, fostering research and development initiatives that enhance the capabilities of vapor deposition technologies.

    Asia-Pacific : Rapid Growth and Technological Advancements

    Asia-Pacific is rapidly emerging as a significant player in the vapor deposition market, holding around 20% of the global share. The region's growth is primarily driven by the booming electronics and semiconductor industries, particularly in countries like Japan, South Korea, and China. Government initiatives aimed at boosting technological advancements and manufacturing capabilities are also contributing to this upward trend, making the region a focal point for investment and innovation. Japan is a leader in vapor deposition technologies, with companies like Tokyo Electron at the forefront. South Korea and China are also making substantial investments in R&D to enhance their manufacturing processes. The competitive landscape is marked by a mix of local and international players, all vying for market share. The region's focus on high-tech applications and sustainable practices is expected to further propel its growth in the coming years.

    Middle East and Africa : Emerging Market with Untapped Potential

    The Middle East and Africa (MEA) region is an emerging market for vapor deposition, currently holding about 5% of the global share. The growth in this region is driven by increasing investments in the oil and gas sector, as well as a growing interest in renewable energy technologies. Countries like the UAE and South Africa are beginning to explore vapor deposition applications, supported by government initiatives aimed at diversifying their economies and enhancing technological capabilities. The competitive landscape in MEA is still developing, with a few local players and international companies looking to establish a foothold. The region's potential for growth is significant, particularly as it seeks to modernize its manufacturing processes. Collaborative efforts between governments and private sectors are essential to unlock the full potential of vapor deposition technologies in this region, paving the way for future advancements and investments.

    Key Players and Competitive Insights

    The Vapor Deposition Market is currently characterized by a dynamic competitive landscape, driven by technological advancements and increasing demand across various sectors, including electronics, optics, and materials science. Key players such as Applied Materials (US), Lam Research (US), and Tokyo Electron (JP) are at the forefront, focusing on innovation and strategic partnerships to enhance their market positions. These companies are not only investing in research and development but are also exploring mergers and acquisitions to consolidate their market presence and expand their technological capabilities. This collective emphasis on innovation and strategic alignment among major players is shaping a competitive environment that is both collaborative and competitive, fostering rapid advancements in vapor deposition technologies.

    In terms of business tactics, companies are increasingly localizing manufacturing to reduce lead times and enhance supply chain efficiency. This approach appears to be a response to the growing need for agility in production processes, particularly in the face of fluctuating global demand. The market structure is moderately fragmented, with several key players exerting significant influence. The interplay between these companies creates a competitive dynamic that encourages continuous improvement and adaptation to market needs.

    In August 2025, Applied Materials (US) announced a strategic partnership with a leading semiconductor manufacturer to develop next-generation deposition technologies. This collaboration is expected to enhance their product offerings and solidify their position in the semiconductor market, which is experiencing unprecedented growth. The partnership underscores the importance of collaboration in driving innovation and meeting the evolving demands of the industry.

    In September 2025, Lam Research (US) unveiled a new line of advanced deposition equipment designed to improve efficiency and reduce waste in semiconductor manufacturing. This launch is indicative of Lam's commitment to sustainability and operational excellence, aligning with broader industry trends towards environmentally friendly practices. The introduction of this technology is likely to strengthen Lam's competitive edge by appealing to manufacturers seeking to enhance their sustainability profiles.

    In July 2025, Tokyo Electron (JP) expanded its operations in Europe by establishing a new manufacturing facility aimed at increasing production capacity for its deposition systems. This strategic move not only enhances Tokyo Electron's ability to serve the European market but also reflects a broader trend of regional expansion among key players. By localizing production, the company aims to improve responsiveness to customer needs and reduce logistical challenges.

    As of October 2025, the Vapor Deposition Market is witnessing significant trends such as digitalization, sustainability, and the integration of artificial intelligence in manufacturing processes. These trends are reshaping competitive dynamics, with companies increasingly forming strategic alliances to leverage complementary strengths. The shift from price-based competition to a focus on innovation, technology, and supply chain reliability is becoming evident. As the market evolves, differentiation will likely hinge on the ability to innovate and adapt to emerging technologies, positioning companies for sustained success in a rapidly changing landscape.

    Key Companies in the Vapor Deposition Market market include

    Industry Developments

    • Q2 2024: Applied Materials to Invest $400 Million in New R&D Center for Advanced Deposition Technologies Applied Materials announced the opening of a new research and development facility in Silicon Valley focused on vapor deposition and other advanced semiconductor manufacturing processes, aiming to accelerate innovation in chip fabrication.
    • Q2 2024: ASM International Secures Major Contract for Atomic Layer Deposition Equipment from Leading Memory Chipmaker ASM International revealed it won a multi-year supply contract to provide atomic layer deposition (ALD) systems to a top global memory manufacturer, strengthening its position in the vapor deposition equipment market.
    • Q3 2024: Tokyo Electron Launches Next-Generation Chemical Vapor Deposition Tool for 3D NAND Production Tokyo Electron introduced a new CVD system designed for high-volume manufacturing of advanced 3D NAND flash memory, targeting increased throughput and improved film quality for semiconductor fabs.
    • Q3 2024: Veeco Instruments Announces Strategic Partnership with European Solar Manufacturer for Thin-Film Deposition Veeco Instruments entered a partnership with a major European solar panel producer to supply physical vapor deposition equipment for next-generation thin-film solar cell manufacturing.
    • Q4 2024: ULVAC Inc. Opens New Manufacturing Facility in South Korea for Vacuum Deposition Systems ULVAC Inc. inaugurated a new plant in South Korea dedicated to producing vacuum deposition equipment, aiming to meet rising demand from Asian semiconductor and display manufacturers.
    • Q4 2024: Lam Research Appoints New Chief Technology Officer to Lead Deposition Technology Innovations Lam Research named Dr. Priya Raman as CTO, tasking her with driving advancements in chemical and physical vapor deposition technologies for next-generation semiconductor devices.
    • Q1 2025: Applied Materials Unveils Innovative Physical Vapor Deposition Platform for Advanced Packaging Applied Materials launched a new PVD platform tailored for advanced semiconductor packaging, enabling finer interconnects and improved device reliability.
    • Q1 2025: Entegris Acquires Deposition Materials Business from Specialty Chemicals Firm Entegris completed the acquisition of a leading deposition materials division from a specialty chemicals company, expanding its portfolio for semiconductor manufacturing.
    • Q2 2025: ASM International Opens New Customer Support Center in Taiwan for Deposition Equipment ASM International established a new support and training center in Hsinchu, Taiwan, to provide technical assistance and training for its vapor deposition equipment customers in Asia.
    • Q2 2025: Oxford Instruments Wins Contract to Supply Atomic Layer Deposition Tools to European Research Consortium Oxford Instruments secured a contract to deliver ALD systems to a European research consortium focused on developing next-generation nanoelectronics.
    • Q3 2025: Veeco Instruments Launches New Physical Vapor Deposition System for Power Electronics Veeco Instruments released a new PVD system optimized for manufacturing power electronic devices, targeting applications in electric vehicles and renewable energy.
    • Q3 2025: Lam Research Announces $250 Million Expansion of Oregon Facility to Boost Deposition Tool Production Lam Research announced a $250 million investment to expand its Oregon manufacturing site, increasing capacity for chemical and physical vapor deposition equipment.

    Segmentation Table

    By Process

      • chemical vapor deposition (CVD)
      • physical vapor deposition (PVD)

    By Application

      • microelectronics
      • cutting tool
      • medical devices & equipment
      • decorative coatings

    By End-Use

      • electrical & electronics
      • automotive
      • aerospace
      • metal industry
      • medical

    Future Outlook

    Vapor Deposition Market Future Outlook

    <p>The Vapor Deposition Market is projected to grow at a 4.6% CAGR from 2024 to 2035, driven by advancements in technology and increasing demand across various industries.</p>

    New opportunities lie in:

    • <p>Development of advanced materials for electronics manufacturing.</p>
    • <p>Expansion into emerging markets with tailored vapor deposition solutions.</p>
    • <p>Integration of automation in vapor deposition processes for efficiency.</p>

    <p>By 2035, the market is expected to solidify its position as a key player in advanced manufacturing.</p>

    Market Segmentation

    Vapor Deposition Market End-Use Outlook

    • electrical & electronics
    • automotive
    • aerospace
    • metal industry
    • medical

    Vapor Deposition Market Process Outlook

    • chemical vapor deposition (CVD)
    • physical vapor deposition (PVD)

    Vapor Deposition Market Application Outlook

    • microelectronics
    • cutting tool
    • medical devices & equipment
    • decorative coatings

    Report Scope

    MARKET SIZE 20243.2(USD Billion)
    MARKET SIZE 20253.347(USD Billion)
    MARKET SIZE 20355.248(USD Billion)
    COMPOUND ANNUAL GROWTH RATE (CAGR)4.6% (2024 - 2035)
    REPORT COVERAGERevenue Forecast, Competitive Landscape, Growth Factors, and Trends
    BASE YEAR2024
    Market Forecast Period2025 - 2035
    Historical Data2019 - 2024
    Market Forecast UnitsUSD Billion
    Key Companies ProfiledMarket analysis in progress
    Segments CoveredMarket segmentation analysis in progress
    Key Market OpportunitiesAdvancements in nanotechnology drive demand for innovative applications in the Vapor Deposition Market.
    Key Market DynamicsTechnological advancements drive competitive forces in the Vapor Deposition Market, enhancing efficiency and product quality.
    Countries CoveredNorth America, Europe, APAC, South America, MEA

    Market Highlights

    Author

    Anshula Mandaokar
    Team Lead - Research

    She holds an experience of about 6+ years in market research and business consulting, working under the spectrum of information communication technology, telecommunications and semiconductor domains. aarti conceptualizes and implements a scalable business strategy and provides strategic leadership to the clients. her expertise lies in market estimation, competitive intelligence, pipeline analysis, customer assessment, etc.

    Leave a Comment

    Latest Comments

    John Doe
    john@example.com

    This is a great article! Really helped me understand the topic better.

    Posted on July 23, 2025, 10:15 AM
    Jane Smith
    jane@domain.com

    Thanks for sharing this. I’ve bookmarked it for later reference.

    Posted on July 22, 2025, 7:45 PM

    FAQs

    What is the projected market valuation of the Vapor Deposition Market by 2035?

    The Vapor Deposition Market is projected to reach a valuation of 5.248 USD Billion by 2035.

    What was the market valuation of the Vapor Deposition Market in 2024?

    In 2024, the Vapor Deposition Market had a valuation of 3.2 USD Billion.

    What is the expected CAGR for the Vapor Deposition Market during the forecast period 2025 - 2035?

    The expected CAGR for the Vapor Deposition Market during the forecast period 2025 - 2035 is 4.6%.

    Which segments are included in the Vapor Deposition Market analysis?

    The Vapor Deposition Market analysis includes segments such as Process, Application, and End-Use.

    What are the projected values for Chemical Vapor Deposition (CVD) and Physical Vapor Deposition (PVD) by 2035?

    By 2035, Chemical Vapor Deposition (CVD) is projected to reach 2.56 USD Billion, while Physical Vapor Deposition (PVD) is expected to reach 2.688 USD Billion.

    1. Executive Summary
      1. \r\n1.1 Definition 10
      2. \r\n1.2 Scope of Study
      3. 10
      4. \r\n1.3 Research Objective 10
      5. \r\n1.4 Assumptions & Limitations
      6. 11
      7. \r\n1.4.1 Assumptions 11
      8. \r\n1.4.2 Limitations 11
      9. \r\n1.5 Market
      10. Structure 11
      11. \r\n
      12. \r\n2 Market Introduction
      13. \r\n2.1 Definition
      14. 17
      15. \r\n2.2 Scope of the Study 17
      16. \r\n2.3 List of Assumptions 18
      17. \r\n2.4
      18. Market Structure 18
      19. \r\n2.5 Key Takeaways 19
      20. \r\n
      21. \r\n3
      22. Market Insights
      23. \r\n3.1 Introduction
      24. \r\n3.2 Primary Research
      25. \r\n3.3
      26. Secondary research
      27. \r\n3.4 Market Size Estimation
      28. \r\n
      29. \r\n4
      30. Research Methodology
      31. \r\n4.1 Research Process 28
      32. \r\n4.2 Primary Research
      33. 29
      34. \r\n4.3 Secondary Research 30
      35. \r\n4.4 Market Size Estimation 30
      36. \r\n4.5
      37. Forecast Model 31
      38. \r\n
      39. \r\n5 Market Dynamics
      40. \r\n5.1 Introduction
      41. 33
      42. \r\n5.2 Drivers 34
      43. \r\n5.2.1 Increasing consumption of electronic
      44. devices, equipment, and appliances 34
      45. \r\n5.2.2 Surging demand from medical
      46. devices & equipment 34
      47. \r\n5.2.3 Stringent environmental regulations against
      48. the use of Cr6 35
      49. \r\n5.3 Restraints 35
      50. \r\n5.3.1 High capital investment
      51. 35
      52. \r\n5.4 Opportunities 36
      53. \r\n5.4.1 Growing demand from renewable
      54. energy sector, especially from solar energy 36
      55. \r\n5.5 Challenges 36
      56. \r\n5.5.1
      57. Technical complexities 36
      58. \r\n6 Market Impact Analysis
      59. \r\n6.1 Supply
      60. Chain Analysis 38
      61. \r\n6.1.1 Raw Material 38
      62. \r\n6.1.2 Vapor Deposition
      63. Producers 38
      64. \r\n6.1.3 Distributors 39
      65. \r\n6.1.4 End-use Industries
      66. 39
      67. \r\n6.2 Porter’s Five Forces 39
      68. \r\n6.2.1 Threat of new entrants
      69. 39
      70. \r\n6.2.2 The intensity of competitive rivalry 39
      71. \r\n6.2.3 Bargaining
      72. power of supplier 39
      73. \r\n6.2.4 Bargaining power of buyer 39
      74. \r\n6.2.5
      75. Threat of Substitute 39
    2. \r\n7 Global Vapor Deposition Market, By Process
      1. \r\n7.1
      2. Chemical Vapor Deposition 43
      3. \r\n7.1.1 Low Pressure CVD 43
      4. \r\n7.1.2
      5. Atmospheric Pressure CVD 44
      6. \r\n7.1.3 Plasma Enhanced CVD 44
      7. \r\n7.1.4
      8. Metal Organic CVD 45
      9. \r\n7.1.5 Others CVD 45
      10. \r\n7.2 Physical Vapor
      11. Deposition 46
      12. \r\n7.2.1 Cathodic Arc Deposition 46
      13. \r\n7.2.2 Electron
      14. Beam PVD 47
      15. \r\n7.2.3 Sputter Deposition 47
      16. \r\n7.2.4 Others PVD 48
      17. \r\n8
    3. Global Vapor Deposition Market, By Application
      1. \r\n8.1 Microelectronics 51
      2. \r\n8.2
      3. Cutting tool 51
      4. \r\n8.3 Medical Devices & Equipment 52
      5. \r\n8.4 Decorative
      6. Coatings 52
      7. \r\n8.5 Others 53
      8. \r\n
      9. \r\n9 Global Vapor Deposition
    4. Market, By End-use Industry
      1. \r\n9.1 Electrical & Electronics 56
      2. \r\n9.2
      3. Automotive 56
      4. \r\n9.3 Aerospace 57
      5. \r\n9.4 Metal Industry 57
      6. \r\n9.5
      7. Medical 58
      8. \r\n9.6 Others 58
      9. \r\n
      10. \r\n10 Global Vapor deposition
    5. Market, By Region
      1. \r\n10.1 Introduction 60
      2. \r\n10.2 North America 63
      3. \r\n10.2.1
      4. U.S 66
      5. \r\n10.2.2 Canada 68
      6. \r\n10.3 Europe 70
      7. \r\n10.3.1 Germany
      8. 73
      9. \r\n10.3.2 France 75
      10. \r\n10.3.3 UK 77
      11. \r\n10.3.4 Spain 79
      12. \r\n10.3.5
      13. Rest of Europe 81
      14. \r\n10.4 Asia-Pacific 83
      15. \r\n10.4.1 China 86
      16. \r\n10.4.2
      17. Japan 88
      18. \r\nSouth Korea 90
      19. \r\n10.4.3 Taiwan 92
      20. \r\n10.4.4 India
      21. 94
      22. \r\n10.4.5 Rest of Asia-Pacific 96
      23. \r\n10.5 Middle East & Africa
      24. 98
      25. \r\n10.5.1 GCC 101
      26. \r\n10.5.2 South Africa 103
      27. \r\n10.5.3 Rest
      28. of Middle East & Africa 105
      29. \r\n10.6 Latin America 107
      30. \r\n10.6.1
      31. Mexico 110
      32. \r\n10.6.2 Brazil 112
      33. \r\n10.6.3 Rest of Latin America 114
      34. \r\n
      35. \r\n11
      36. Competitive Landscape
      37. \r\n11.1 Competitive Landscape 117
      38. \r\n11.1.1
      39. Introduction 117
      40. \r\n11.1.2 Key development analysis 117
      41. \r\n
      42. \r\n12
      43. Company Profiles
      44. \r\n12.1 Oerlikon Balzers Coating AG 120
      45. \r\n12.1.1
      46. Company Overview 120
      47. \r\n12.1.2 Financial Overview 120
      48. \r\n12.1.3 Products
      49. Offerings 121
      50. \r\n12.1.4 Key Developments 121
      51. \r\n12.1.5 SWOT Analysis
      52. 121
      53. \r\n12.1.6 Key Strategy 121
      54. \r\n12.2 ULVAC Technologies, Inc. 122
      55. \r\n12.2.1
      56. Company Overview 122
      57. \r\n12.2.2 Financial Overview 122
      58. \r\n12.2.3 Products
      59. Offerings 123
      60. \r\n12.2.4 Key Developments 123
      61. \r\n12.2.5 SWOT Analysis
      62. 123
      63. \r\n12.2.6 Key Strategy 123
      64. \r\n12.3 IHI Ionbond AG 124
      65. \r\n12.3.1
      66. Company Overview 124
      67. \r\n12.3.2 Financial Overview 124
      68. \r\n12.3.3 Products
      69. Offerings 125
      70. \r\n12.3.4 Key Developments 125
      71. \r\n12.3.5 SWOT Analysis
      72. 125
      73. \r\n12.3.6 Key Strategy 125
      74. \r\n12.4 Applied Materials Inc. 126
      75. \r\n12.4.1
      76. Company Overview 126
      77. \r\n12.4.2 Financial Overview 126
      78. \r\n12.4.3 Products
      79. Offerings 127
      80. \r\n12.4.4 Key Developments 127
      81. \r\n12.4.5 SWOT Analysis
      82. 127
      83. \r\n12.4.6 Key Strategy 127
      84. \r\n12.5 JUSUNG ENGINEERING Co., Ltd.
      85. 128
      86. \r\n12.5.1 Company Overview 128
      87. \r\n12.5.2 Financial Overview 128
      88. \r\n12.5.3
      89. Products Offerings 129
      90. \r\n12.5.4 Key Developments 129
      91. \r\n12.5.5 SWOT
      92. Analysis 129
      93. \r\n12.5.6 Key Strategy 129
      94. \r\n12.6 ASM International
      95. N.V. 130
      96. \r\n12.6.1 Company Overview 130
      97. \r\n12.6.2 Financial Overview
      98. 130
      99. \r\n12.6.3 Products Offerings 131
      100. \r\n12.6.4 Key Developments 131
      101. \r\n12.6.5
      102. SWOT Analysis 131
      103. \r\n12.6.6 Key Strategy 131
      104. \r\n12.7 LAM RESEARCH
      105. CORPORATION 132
      106. \r\n12.7.1 Company Overview 132
      107. \r\n12.7.2 Financial
      108. Overview 132
      109. \r\n12.7.3 Products Offerings 133
      110. \r\n12.7.4 Key Developments
      111. 133
      112. \r\n12.7.5 SWOT Analysis 133
      113. \r\n12.7.6 Key Strategy 133
      114. \r\n12.8
      115. Kurt J. Lesker 134
      116. \r\n12.8.1 Company Overview 134
      117. \r\n12.8.2 Financial
      118. Overview 134
      119. \r\n12.8.3 Products Offerings 134
      120. \r\n12.8.4 Key Developments
      121. 134
      122. \r\n12.8.5 SWOT Analysis 135
      123. \r\n12.8.6 Key Strategy 135
      124. \r\n12.9
      125. Plasma-Therm LLC. 136
      126. \r\n12.9.1 Company Overview 136
      127. \r\n12.9.2 Financial
      128. Overview 136
      129. \r\n12.9.3 Products Offerings 136
      130. \r\n12.9.4 Key Developments
      131. 136
      132. \r\n12.9.5 SWOT Analysis 137
      133. \r\n12.9.6 Key Strategy 137
      134. \r\n12.10
      135. Aurora Scientific Corp. 138
      136. \r\n12.10.1 Company Overview 138
      137. \r\n12.10.2
      138. Financial Overview 138
      139. \r\n12.10.3 Products Offerings 138
      140. \r\n12.10.4
      141. Key Developments 138
      142. \r\n12.10.5 SWOT Analysis 139
      143. \r\n12.10.6 Key Strategy
      144. 139
      145. \r\n
      146. \r\n13 Conclusion
      147. \r\n13.1 Discussion Blue Print
      148. 86
      149. \r\n14 List Of Tables
      150. \r\nTABLE 1 MARKET SYNOPSIS 15
      151. \r\nTABLE
    6. LIST OF ASSUMPTIONS 18
    7. \r\nTABLE 3 GLOBAL VAPOR DEPOSITION MARKET, BY PROCESS,
      1. \r\nTABLE 4 GLOBAL VAPOR DEPOSITION MARKET FOR
      2. CHEMICAL VAPOR DEPOSITION, 2020-2027 (USD MILLION) 43
      3. \r\nTABLE 5 GLOBAL VAPOR
      4. DEPOSITION MARKET FOR LOW PRESSURE CVD, 2020-2027 (USD MILLION) 43
      5. \r\nTABLE
    8. GLOBAL VAPOR DEPOSITION MARKET FOR ATMOSPHERIC PRESSURE CVD, 2020-2027 (USD MILLION)
      1. 44
      2. \r\nTABLE 7 GLOBAL VAPOR DEPOSITION MARKET FOR PLASMA ENHANCED CVD, 2020-2027
      3. (USD MILLION) 44
      4. \r\nTABLE 8 GLOBAL VAPOR DEPOSITION MARKET FOR METAL ORGANIC
      5. CVD, 2020-2027 (USD MILLION) 45
      6. \r\nTABLE 9 GLOBAL VAPOR DEPOSITION MARKET
      7. FOR OTHERS CVD, 2020-2027 (USD MILLION) 45
      8. \r\nTABLE 10 GLOBAL VAPOR DEPOSITIONMARKET
      9. FOR PHYSICAL VAPOR DEPOSITION, 2020-2027 (USD MILLION) 46
      10. \r\nTABLE 11 GLOBAL
      11. VAPOR DEPOSITION MARKET FOR CATHODIC ARC DEPOSITION, 2020-2027 (USD MILLION) 46
      12. \r\nTABLE
    9. GLOBAL VAPOR DEPOSITION MARKET FOR ELECTRON BEAM PVD, 2020-2027 (USD MILLION)
      1. 47
      2. \r\nTABLE 13 GLOBAL VAPOR DEPOSITION MARKET FOR SPUTTER DEPOSITION, 2020-2027
      3. (USD MILLION) 47
      4. \r\nTABLE 14 GLOBAL VAPOR DEPOSITION MARKET FOR OTHERS PVD,
      5. \r\nTABLE 15 GLOBAL VAPOR DEPOSITION MARKET, BY
      6. APPLICATION, 2020-2027 (USD MILLION) 50
      7. \r\nTABLE 16 GLOBAL VAPOR DEPOSITIONMARKET
      8. FOR MICROELECTRONICS, 2020-2027 (USD MILLION) 51
      9. \r\nTABLE 17 GLOBAL VAPOR
      10. DEPOSITION MARKET FOR CUTTING TOOL, 2020-2027 (USD MILLION) 51
      11. \r\nTABLE 18
      12. GLOBAL VAPOR DEPOSITION MARKET FOR MEDICAL DEVICES & EQUIPMENT, 2020-2027 (USD
      13. MILLION) 52
      14. \r\nTABLE 19 GLOBAL VAPOR DEPOSITION MARKET FOR DECORATIVE COATINGS,
      15. \r\nTABLE 20 GLOBAL VAPOR DEPOSITION MARKET FOR
      16. OTHERS, 2020-2027 (USD MILLION) 53
      17. \r\nTABLE 21 GLOBAL VAPOR DEPOSITION MARKET,
      18. BY END-USE INDUSTRY, 2020-2027 (USD MILLION) 55
      19. \r\nTABLE 22 GLOBAL VAPOR
      20. DEPOSITION MARKET FOR ELECTRICAL & ELECTRONICS, 2020-2027 (USD MILLION) 56
      21. \r\nTABLE
    10. GLOBAL VAPOR DEPOSITION MARKET FOR AUTOMOTIVE, 2020-2027 (USD MILLION) 56
      1. \r\nTABLE
    11. GLOBAL VAPOR DEPOSITION MARKET FOR AEROSPACE, 2020-2027 (USD MILLION) 57
      1. \r\nTABLE
    12. GLOBAL VAPOR DEPOSITION MARKET FOR METAL INDUSTRY, 2020-2027 (USD MILLION) 57
      1. \r\nTABLE
    13. GLOBAL VAPOR DEPOSITION MARKET FOR MEDICAL, 2020-2027 (USD MILLION) 58
      1. \r\nTABLE
    14. GLOBAL VAPOR DEPOSITION MARKET FOR OTHERS, 2020-2027 (USD MILLION) 58
      1. \r\nTABLE
    15. GLOBAL VAPOR DEPOSITION MARKET, BY REGION, 2020-2027 (USD MILLION) 60
      1. \r\nTABLE
    16. GLOBAL VAPOR DEPOSITION MARKET, BY PROCESS , 2020-2027 (USD MILLION) 61
      1. \r\nTABLE
    17. GLOBAL VAPOR DEPOSITION MARKET, BY APPLICATION , 2020-2027 (USD MILLION) 61
      1. \r\nTABLE
    18. GLOBAL VAPOR DEPOSITION MARKET, BY END-USE INDUSTRY , 2020-2027 (USD MILLION)
      1. 62
    19. \r\nTABLE 32 NORTH AMERICA VAPOR DEPOSITION MARKET, BY COUNTRY, 2020-2027
      1. (USD MILLION) 64
    20. \r\nTABLE 33 NORTH AMERICA VAPOR DEPOSITION MARKET, BY PROCESS
      1. , 2020-2027 (USD MILLION) 64
      2. \r\nTABLE 34 NORTH AMERICA VAPOR DEPOSITION MARKET,
      3. BY APPLICATION , 2020-2027 (USD MILLION) 65
      4. \r\nTABLE 35 NORTH AMERICA VAPOR
    21. DEPOSITION MARKET, BY END-USE INDUSTRY , 2020-2027 (USD MILLION) 65
      1. \r\nTABLE
    22. U.S VAPOR DEPOSITION MARKET, BY PROCESS , 2020-2027 (USD MILLION) 66
      1. \r\nTABLE
    23. U.S VAPOR DEPOSITION MARKET, BY APPLICATION , 2020-2027 (USD MILLION) 67
      1. \r\nTABLE
    24. U.S VAPOR DEPOSITION MARKET, BY END-USE INDUSTRY , 2020-2027 (USD MILLION) 67
      1. \r\nTABLE
    25. CANADA VAPOR DEPOSITION MARKET, BY PROCESS , 2020-2027 (USD MILLION) 68
      1. \r\nTABLE
    26. CANADA VAPOR DEPOSITION MARKET, BY APPLICATION , 2020-2027 (USD MILLION) 69
      1. \r\nTABLE
    27. CANADA VAPOR DEPOSITION MARKET, BY END-USE INDUSTRY , 2020-2027 (USD MILLION)
      1. 69
    28. \r\nTABLE 42 EUROPE VAPOR DEPOSITION MARKET, BY COUNTRY, 2020-2027 (USD
      1. MILLION) 71
    29. \r\nTABLE 43 EUROPE VAPOR DEPOSITION MARKET, BY PROCESS , 2020-2027
      1. (USD MILLION) 71
    30. \r\nTABLE 44 EUROPE VAPOR DEPOSITION MARKET, BY APPLICATION
      1. , 2020-2027 (USD MILLION) 72
      2. \r\nTABLE 45 EUROPE VAPOR DEPOSITION MARKET,
      3. BY END-USE INDUSTRY , 2020-2027 (USD MILLION) 72
      4. \r\nTABLE 46 GERMANY VAPOR
    31. DEPOSITION MARKET, BY PROCESS , 2020-2027 (USD MILLION) 73
      1. \r\nTABLE 47 GERMANY
    32. VAPOR DEPOSITION MARKET, BY APPLICATION , 2020-2027 (USD MILLION) 73
      1. \r\nTABLE
    33. GERMANY VAPOR DEPOSITION MARKET, BY END-USE INDUSTRY , 2020-2027 (USD MILLION)
      1. 74
    34. \r\nTABLE 49 FRANCE VAPOR DEPOSITION MARKET, BY PROCESS , 2020-2027 (USD
      1. MILLION) 75
    35. \r\nTABLE 50 FRANCE VAPOR DEPOSITION MARKET, BY APPLICATION ,
      1. \r\nTABLE 51 FRANCE VAPOR DEPOSITION MARKET, BY
      2. END-USE INDUSTRY , 2020-2027 (USD MILLION) 76
      3. \r\nTABLE 52 UK VAPOR DEPOSITION
    36. MARKET, BY PROCESS , 2020-2027 (USD MILLION) 77
      1. \r\nTABLE 53 UK VAPOR DEPOSITION
    37. MARKET, BY APPLICATION , 2020-2027 (USD MILLION) 78
      1. \r\nTABLE 54 UK VAPOR
    38. DEPOSITION MARKET, BY END-USE INDUSTRY , 2020-2027 (USD MILLION) 79
      1. \r\nTABLE
    39. SPAIN VAPOR DEPOSITION MARKET, BY PROCESS , 2020-2027 (USD MILLION) 79
      1. \r\nTABLE
    40. SPAIN VAPOR DEPOSITION MARKET, BY APPLICATION , 2020-2027 (USD MILLION) 80
      1. \r\nTABLE
    41. SPAIN VAPOR DEPOSITION MARKET, BY END-USE INDUSTRY , 2020-2027 (USD MILLION)
      1. 80
    42. \r\nTABLE 58 REST OF EUROPE VAPOR DEPOSITION MARKET, BY PROCESS , 2020-2027
      1. (USD MILLION) 81
    43. \r\nTABLE 59 REST OF EUROPE VAPOR DEPOSITION MARKET, BY APPLICATION
      1. , 2020-2027 (USD MILLION) 82
      2. \r\nTABLE 60 REST OF EUROPE VAPOR DEPOSITION
    44. MARKET, BY END-USE INDUSTRY , 2020-2027 (USD MILLION) 82
      1. \r\nTABLE 61 ASIA-PACIFIC
    45. VAPOR DEPOSITION MARKET, BY COUNTRY, 2020-2027 (USD MILLION) 84
      1. \r\nTABLE
    46. ASIA-PACIFIC VAPOR DEPOSITION MARKET, BY PROCESS , 2020-2027 (USD MILLION) 84
      1. \r\nTABLE
    47. ASIA-PACIFIC VAPOR DEPOSITION MARKET, BY APPLICATION , 2020-2027 (USD MILLION)
      1. 85
    48. \r\nTABLE 64 ASIA-PACIFIC VAPOR DEPOSITION MARKET, BY END-USE INDUSTRY
      1. , 2020-2027 (USD MILLION) 85
      2. \r\nTABLE 65 CHINA VAPOR DEPOSITION MARKET, BY
      3. PROCESS , 2020-2027 (USD MILLION) 86
      4. \r\nTABLE 66 CHINA VAPOR DEPOSITION MARKET,
      5. BY APPLICATION , 2020-2027 (USD MILLION) 87
      6. \r\nTABLE 67 CHINA VAPOR DEPOSITION
    49. MARKET, BY END-USE INDUSTRY , 2020-2027 (USD MILLION) 87
      1. \r\nTABLE 68 JAPAN
    50. VAPOR DEPOSITION MARKET, BY PROCESS , 2020-2027 (USD MILLION) 88
      1. \r\nTABLE
    51. JAPAN VAPOR DEPOSITION MARKET, BY APPLICATION , 2020-2027 (USD MILLION) 89
      1. \r\nTABLE
    52. JAPAN VAPOR DEPOSITION MARKET, BY END-USE INDUSTRY , 2020-2027 (USD MILLION)
      1. 89
    53. \r\nTABLE 71 SOUTH KOREA VAPOR DEPOSITION MARKET, BY PROCESS , 2020-2027
      1. (USD MILLION) 90
    54. \r\nTABLE 72 SOUTH KOREA VAPOR DEPOSITION MARKET, BY APPLICATION
      1. , 2020-2027 (USD MILLION) 91
      2. \r\nTABLE 73 SOUTH KOREA VAPOR DEPOSITION MARKET,
      3. BY END-USE INDUSTRY , 2020-2027 (USD MILLION) 91
      4. \r\nTABLE 74 TAIWAN VAPOR
    55. DEPOSITION MARKET, BY PROCESS , 2020-2027 (USD MILLION) 92
      1. \r\nTABLE 75 TAIWAN
    56. VAPOR DEPOSITION MARKET, BY APPLICATION , 2020-2027 (USD MILLION) 93
      1. \r\nTABLE
    57. TAIWAN VAPOR DEPOSITION MARKET, BY END-USE INDUSTRY , 2020-2027 (USD MILLION)
      1. 93
    58. \r\nTABLE 77 INDIA VAPOR DEPOSITION MARKET, BY PROCESS , 2020-2027 (USD
      1. MILLION) 94
    59. \r\nTABLE 78 INDIA VAPOR DEPOSITION MARKET, BY APPLICATION , 2020-2027
      1. (USD MILLION) 95
    60. \r\nTABLE 79 INDIA VAPOR DEPOSITION MARKET, BY END-USE INDUSTRY
      1. , 2020-2027 (USD MILLION) 95
      2. \r\nTABLE 80 REST OF ASIA-PACIFIC VAPOR DEPOSITION
    61. MARKET, BY PROCESS , 2020-2027 (USD MILLION) 96
      1. \r\nTABLE 81 REST OF ASIA-PACIFIC
    62. VAPOR DEPOSITION MARKET, BY APPLICATION , 2020-2027 (USD MILLION) 97
      1. \r\nTABLE
    63. REST OF ASIA-PACIFIC VAPOR DEPOSITION MARKET, BY END-USE INDUSTRY , 2020-2027
      1. (USD MILLION) 97
      2. \r\nTABLE 83 MIDDLE EAST & AFRICA VAPOR DEPOSITION MARKET,
      3. BY PROCESS , 2020-2027 (USD MILLION) 99
      4. \r\nTABLE 84 MIDDLE EAST & AFRICA
    64. VAPOR DEPOSITION MARKET, BY PROCESS , 2020-2027 (USD MILLION) 99
      1. \r\nTABLE
    65. MIDDLE EAST & AFRICA VAPOR DEPOSITION MARKET, BY APPLICATION , 2020-2027
      1. (USD MILLION) 100
      2. \r\nTABLE 86 MIDDLE EAST & AFRICA VAPOR DEPOSITION MARKET,
      3. BY END-USE INDUSTRY , 2020-2027 (USD MILLION) 100
      4. \r\nTABLE 87 GCC VAPOR DEPOSITION
    66. MARKET, BY PROCESS , 2020-2027 (USD MILLION) 101
      1. \r\nTABLE 88 GCC VAPOR DEPOSITION
    67. MARKET, BY APPLICATION , 2020-2027 (USD MILLION) 102
      1. \r\nTABLE 89 GCC VAPOR
    68. DEPOSITION MARKET, BY END-USE INDUSTRY , 2020-2027 (USD MILLION) 102
      1. \r\nTABLE
    69. SOUTH AFRICA VAPOR DEPOSITION MARKET, BY PROCESS , 2020-2027 (USD MILLION) 103
      1. \r\nTABLE
    70. SOUTH AFRICA VAPOR DEPOSITION MARKET, BY APPLICATION , 2020-2027 (USD MILLION)
      1. 104
    71. \r\nTABLE 92 SOUTH AFRICA VAPOR DEPOSITION MARKET, BY END-USE INDUSTRY
      1. , 2020-2027 (USD MILLION) 104
      2. \r\nTABLE 93 REST OF MIDDLE EAST & AFRICA
    72. VAPOR DEPOSITION MARKET, BY PROCESS , 2020-2027 (USD MILLION) 105
      1. \r\nTABLE
    73. REST OF MIDDLE EAST & AFRICA VAPOR DEPOSITION MARKET, BY APPLICATION , 2020-2027
      1. (USD MILLION) 106
      2. \r\nTABLE 95 REST OF MIDDLE EAST & AFRICA VAPOR DEPOSITION
    74. MARKET, BY END-USE INDUSTRY , 2020-2027 (USD MILLION) 106
      1. \r\nTABLE 96 LATIN
    75. AMERICA VAPOR DEPOSITION MARKET, BY COUNTRY , 2020-2027 (USD MILLION) 108
      1. \r\nTABLE
    76. LATIN AMERICA VAPOR DEPOSITION MARKET, BY PROCESS , 2020-2027 (USD MILLION) 108
      1. \r\nTABLE
    77. LATIN AMERICA VAPOR DEPOSITION MARKET, BY APPLICATION , 2020-2027 (USD MILLION)
      1. 109
    78. \r\nTABLE 99 LATIN AMERICA VAPOR DEPOSITION MARKET, BY END-USE INDUSTRY
      1. , 2020-2027 (USD MILLION) 109
      2. \r\nTABLE 100 MEXICO VAPOR DEPOSITION MARKET,
      3. BY PROCESS , 2020-2027 (USD MILLION) 110
      4. \r\nTABLE 101 MEXICO VAPOR DEPOSITION
    79. MARKET, BY APPLICATION , 2020-2027 (USD MILLION) 111
      1. \r\nTABLE 102 MEXICO
    80. VAPOR DEPOSITION MARKET, BY END-USE INDUSTRY , 2020-2027 (USD MILLION) 111
      1. \r\nTABLE
    81. BRAZIL VAPOR DEPOSITION MARKET, BY PROCESS , 2020-2027 (USD MILLION) 112
      1. \r\nTABLE
    82. BRAZIL VAPOR DEPOSITION MARKET, BY APPLICATION , 2020-2027 (USD MILLION) 113
      1. \r\nTABLE
    83. BRAZIL VAPOR DEPOSITION MARKET, BY END-USE INDUSTRY , 2020-2027 (USD MILLION)
      1. 113
    84. \r\nTABLE 106 REST OF LATIN AMERICA VAPOR DEPOSITION MARKET, BY PROCESS
      1. , 2020-2027 (USD MILLION) 114
      2. \r\nTABLE 107 REST OF LATIN AMERICA VAPOR DEPOSITION
    85. MARKET, BY APPLICATION , 2020-2027 (USD MILLION) 115
      1. \r\nTABLE 108 REST OF
    86. LATIN AMERICA VAPOR DEPOSITION MARKET, BY END-USE INDUSTRY , 2020-2027 (USD MILLION)
      1. 115
      2. \r\nTABLE 109 KEY DEVELOPMENT ABNALYSIS 118
      3. \r\n
      4. \r\n15
      5. List Of Figures
      6. \r\nFIGURE 1 GLOBAL VAPOR DEPOSITION MARKET: MARKET STRUCTURE
      7. 18
      8. \r\nFIGURE 2 KEY TAKEAWAYS OF THE VAPOR DEPOSITION MARKET 19
      9. \r\nFIGURE
    87. NORTH AMERICA MARKET SIZE & MARKET SHARE BY COUNTRY (2020) 21
      1. \r\nFIGURE
    88. EUROPE MARKET SIZE & MARKET SHARE BY COUNTRY (2020) 22
      1. \r\nFIGURE 5
      2. ASIA-PACIFIC & MARKET SHARE BY COUNTRY (2020) 23
      3. \r\nFIGURE 6 LATIN AMERICA
      4. MARKET SIZE & MARKET SHARE BY COUNTRY (2020) 24
      5. \r\nFIGURE 7 MIDDLE EAST
      6. & AFRICA MARKET SIZE & MARKET SHARE BY COUNTRY (2020) 25
      7. \r\nFIGURE
    89. VAPOR DEPOSITION MARKET, BY REGION, 2020 26
      1. \r\nFIGURE 9 RESEARCH PROCESS
      2. OF MRFR 28
      3. \r\nFIGURE 10 TOP DOWN & BOTTOM UP APPROACH 31
      4. \r\nFIGURE
    90. MARKEY DYNAMICS OVERVIEW 33
      1. \r\nFIGURE 12 SUPPLY CHAIN ANALYSIS 38
      2. \r\nFIGURE
    91. GLOBAL VAPOR DEPOSITIONMARKET, BY PROCESS, 2020-2027 41
      1. \r\nFIGURE 14 GLOBAL
    92. VAPOR DEPOSITION MARKET, BY APPLICATION, 2020-2027 50
      1. \r\nFIGURE 15 GLOBAL
    93. VAPOR DEPOSITION MARKET, BY END-USE INDUSTRY, 2020-2027 55
      1. \r\nFIGURE 16 GLOBAL
    94. VAPOR DEPOSITION MARKET, BY REGION, 2020-2027 60

    Vapor Deposition Market Segmentation

    Market Segmentation Overview

    • Detailed segmentation data will be available in the full report
    • Comprehensive analysis by multiple parameters
    • Regional and country-level breakdowns
    • Market size forecasts by segment
    Infographic

    Free Sample Request

    Kindly complete the form below to receive a free sample of this Report

    Get Free Sample

    Customer Strories

    “I am very pleased with how market segments have been defined in a relevant way for my purposes (such as "Portable Freezers & refrigerators" and "last-mile"). In general the report is well structured. Thanks very much for your efforts.”

    Victoria Milne

    Founder
    Case Study
    Chemicals and Materials

    Compare Licence

    ×
    Features License Type
    Single User Multiuser License Enterprise User
    Price $4,950 $5,950 $7,250
    Maximum User Access Limit 1 User Upto 10 Users Unrestricted Access Throughout the Organization
    Free Customization
    Direct Access to Analyst
    Deliverable Format
    Platform Access
    Discount on Next Purchase 10% 15% 15%
    Printable Versions