• Cat-intel
  • MedIntelliX
  • Resources
  • About Us
  • Hero Background
    English
    Chinese
    French
    Japanese
    Korean
    German
    Spanish

    Water Softening Systems Market Share

    ID: MRFR/IA - E/6299-HCR
    100 Pages
    Varsha More
    October 2025

    Water Softening Systems Market Research Report By Application (Residential, Commercial, Industrial), By Technology (Ion Exchange, Salt-Free Water Softening, Reverse Osmosis), By Mechanism (Single Tank, Dual Tank, Single Tank with Filter), By End Use (Households, Hotels, Manufacturing Plants) and By Regional (North America, Europe, South America, Asia Pacific, Middle East and Africa) - Forecast ...

    Share:
    Download PDF ×

    We do not share your information with anyone. However, we may send you emails based on your report interest from time to time. You may contact us at any time to opt-out.

    Water Softening Systems Market Infographic
    $ 4,950.0
    $ 5,950.0
    $ 7,250.0

    Market Share

    Water Softening Systems Market Share Analysis

    The Residential Water Softening Systems market presents a plethora of opportunities driven by various factors that contribute to its growth and evolution. These opportunities arise from a combination of technological advancements, changing consumer preferences, and global initiatives focused on water quality and sustainability. Let's delve into some key opportunities that can shape the future landscape of the Residential Water Softening Systems market.

    Rising Awareness of Water Quality: The increasing awareness among consumers about the impact of water quality on health and daily life creates a significant opportunity for the Residential Water Softening Systems market. As people become more conscious of the potential risks associated with hard water, the demand for effective water softening solutions is likely to rise.

    Technological Innovations and Smart Solutions: Technological advancements provide a promising avenue for the Residential Water Softening Systems market. The development of smart water softening systems with features such as real-time monitoring, remote control, and data analytics presents an opportunity to cater to consumers who seek advanced, user-friendly solutions for water quality management in their homes.

    Sustainable and Eco-Friendly Solutions: With a growing emphasis on sustainability and environmental consciousness, there is an opportunity for the market to explore and promote eco-friendly water softening alternatives. Salt-free water softening systems and systems with reduced environmental impact can attract environmentally conscious consumers who are keen on adopting sustainable practices.

    Integration with Smart Home Ecosystems: The integration of Residential Water Softening Systems into smart home ecosystems provides an opportunity to enhance overall home automation and convenience. Collaborations with smart home platforms and compatibility with voice-activated assistants can make water softening systems an integral part of modern smart homes.

    Partnerships and Collaborations: Collaborative efforts between manufacturers, technology providers, and water treatment specialists present an opportunity to create comprehensive solutions. Partnerships can lead to the development of integrated water management systems that address multiple aspects of water quality, including softening, filtration, and purification.

    Government Initiatives for Water Quality Improvement: Government initiatives and regulations aimed at improving water quality create opportunities for market players. In regions where water quality standards are stringent, there is a demand for effective residential water softening solutions that comply with regulatory requirements.

    Customization and Personalization: Offering customizable and personalized solutions based on individual water quality needs provides an opportunity for market differentiation. Consumers may seek tailored water softening systems that address specific concerns, and manufacturers can capitalize on this demand by providing versatile and adaptable products.

    Educational Campaigns and Consumer Outreach: Opportunities exist for market players to engage in educational campaigns to raise awareness about the benefits of water softening. By providing information about water hardness, its effects, and the advantages of using residential water softening systems, companies can influence consumer perceptions and drive adoption.

    Market Expansion in Developing Regions: As developing countries witness rapid urbanization and infrastructure development, there is an opportunity for market expansion in these regions. Smart city projects and increasing disposable incomes in emerging economies create a conducive environment for the adoption of residential water softening systems.

    Innovative Business Models and Subscription Services: Exploring innovative business models, such as subscription services for water softening solutions, can be a strategic opportunity. This model allows consumers to access water softening services without the upfront cost of purchasing the system, fostering affordability and accessibility.

    The Residential Water Softening Systems market is brimming with opportunities that align with the evolving dynamics of consumer preferences, technological advancements, and global initiatives focused on water quality improvement. By capitalizing on these opportunities, market players can not only meet the current demands but also contribute to the sustainable and efficient management of water resources in residential settings.

    Author
    Varsha More
    Research Analyst

    Experienced business professional with a demonstrated history of working in the CFnB industry. Skilled in market research, and market estimation. Strong professional with a Masters focused in marketing management.

    Leave a Comment

    FAQs

    What is the current valuation of the Water Softening Systems Market?

    The market valuation was 2460.8 USD Billion in 2024.

    What is the projected market size for the Water Softening Systems Market by 2035?

    The market is projected to reach 5084.7 USD Billion by 2035.

    What is the expected CAGR for the Water Softening Systems Market during the forecast period 2025 - 2035?

    The expected CAGR is 6.82% during the forecast period 2025 - 2035.

    Which application segment holds the largest market share in the Water Softening Systems Market?

    The Industrial application segment was valued at 1230.4 USD Billion in 2024.

    How does the Ion Exchange technology segment perform in the Water Softening Systems Market?

    The Ion Exchange technology segment was valued at 900.0 USD Billion in 2024.

    What are the key players in the Water Softening Systems Market?

    Key players include Culligan International, Pentair, GE Appliances, and Kinetico.

    What is the market valuation for the Residential application segment?

    The Residential application segment was valued at 738.24 USD Billion in 2024.

    How does the Dual Tank mechanism segment compare in terms of market valuation?

    The Dual Tank mechanism segment was valued at 600.0 USD Billion in 2024.

    What is the market size for the Hotels end-use segment?

    The Hotels end-use segment was valued at 600.0 USD Billion in 2024.

    What is the projected growth for the Salt-Free Water Softening technology segment by 2035?

    The Salt-Free Water Softening technology segment is projected to reach 1200.0 USD Billion by 2035.

    Market Summary

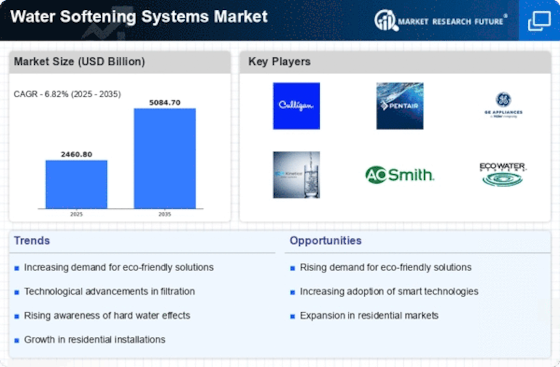
    As per MRFR analysis, the Water Softening Systems Market was estimated at 2460.8 USD Billion in 2024. The water softening industry is projected to grow from 2628.63 USD Billion in 2025 to 5084.7 USD Billion by 2035, exhibiting a compound annual growth rate (CAGR) of 6.82 during the forecast period 2025 - 2035.

    Key Market Trends & Highlights

    The Water Softening Systems Market is experiencing notable growth driven by technological advancements and increasing consumer awareness.

    • Consumer awareness regarding water quality is rising, leading to increased demand for water softening systems in North America. Technological innovations in water softening are enhancing system efficiency, particularly in the residential segment, which remains the largest. The Asia-Pacific region is emerging as the fastest-growing market, driven by rapid urbanization and rising construction activities. Key market drivers include increasing water quality concerns and government regulations promoting the adoption of advanced water treatment technologies.

    Market Size & Forecast

    2024 Market Size 2460.8 (USD Billion)
    2035 Market Size 5084.7 (USD Billion)
    CAGR (2025 - 2035) 6.82%
    Largest Regional Market Share in 2024 North America

    Major Players

    <p>Culligan International (US), <a href="https://www.pentair.com/en-us/water-softening-filtration/water-softening.html">Pentair </a>(US), GE Appliances (US), Kinetico (US), A. O. Smith (US), EcoWater Systems (US), Water-Right (US), Harvey Water Softeners (GB), <a href="https://www.bwt.com/en/shop/Domestic-Water/Water-Softener/">BWT</a> AG (AT), Aquasana (US)</p>

    Market Trends

    The Water Softening Systems Market is currently experiencing a notable transformation driven by various factors. Increasing awareness regarding the adverse effects of hard water on household appliances and plumbing systems appears to be a primary catalyst for growth. Consumers are becoming more informed about the benefits of water softening, which include improved efficiency of appliances, reduced energy consumption, and enhanced skin and hair health. Furthermore, the rising demand for high-quality water in residential water softening systems and commercial sectors is likely to propel the adoption of these systems. As environmental concerns gain traction, there is a growing inclination towards eco-friendly solutions, which may influence product development in this sector. In addition, technological advancements in water softening systems are contributing to market evolution. Innovations such as smart water softeners that offer remote monitoring and control capabilities seem to attract tech-savvy consumers. The integration of IoT technology into these systems could enhance user experience and operational efficiency. Moreover, the increasing prevalence of water quality regulations across various regions may further stimulate market growth. As the Water Softening Systems Market continues to evolve, stakeholders must remain vigilant to emerging trends and consumer preferences to maintain a competitive edge.

    Rising Consumer Awareness

    There is a growing recognition among consumers regarding the detrimental effects of hard water. This awareness is driving demand for water softening solutions, as individuals seek to protect their appliances and improve overall water quality.

    Technological Innovations

    Advancements in technology are reshaping the Water Softening Systems Market. The introduction of smart systems that allow for remote monitoring and control is appealing to a modern consumer base that values convenience and efficiency.

    Regulatory Influences

    Increasing regulations concerning water purifier quality are likely to impact the market. As governments implement stricter standards, the demand for effective water softening solutions may rise, prompting manufacturers to innovate and comply.

    <p>The increasing prevalence of hard water across various regions is driving the demand for water softening systems, as households and industries seek effective solutions to mitigate the adverse effects on plumbing and appliances.</p>

    U.S. Geological Survey

    Water Softening Systems Market Market Drivers

    Health and Wellness Trends

    The growing emphasis on health and wellness is impacting the Water Softening Systems Market Industry. Consumers are increasingly aware of the potential health implications associated with hard water, including skin irritations and the effects on hair quality. As a result, there is a rising demand for water softening systems that can provide softer water, which is perceived as beneficial for personal care and overall well-being. Market Research Future indicates that households are willing to invest in water treatment solutions that promise improved health outcomes. This trend is likely to encourage manufacturers to innovate and market their products more effectively, thereby expanding their reach in the health-conscious consumer segment.

    Rising Construction Activities

    The surge in construction activities across residential and commercial sectors is significantly influencing the Water Softening Systems Market Industry. As new buildings are constructed, the demand for water softening systems is expected to rise, particularly in areas known for hard water. The construction of new homes and commercial establishments often includes the installation of water treatment systems as a standard practice. Market data suggests that the construction industry is projected to grow at a steady rate, which will likely lead to an increased adoption of water softening solutions. This trend indicates a robust opportunity for manufacturers to cater to the evolving needs of the construction sector.

    Increasing Water Quality Concerns

    The rising concerns regarding water quality are driving the Water Softening Systems Market Industry. As consumers become more aware of the adverse effects of hard water, such as scale buildup and its impact on appliances, the demand for water softening solutions is likely to increase. Reports indicate that approximately 85 percent of households in certain regions experience hard water issues, which can lead to significant costs in maintenance and repairs. This awareness is prompting consumers to invest in water softening systems to enhance their recycling water filtration and protect their plumbing infrastructure. Consequently, manufacturers are responding by developing more efficient and user-friendly systems, further propelling the market forward.

    Government Regulations and Incentives

    Government regulations and incentives aimed at promoting water conservation and quality are influencing the Water Softening Systems Market Industry. Many regions are implementing stricter guidelines regarding water usage and treatment, which encourages consumers to adopt water softening systems. Additionally, some governments offer financial incentives for households that install water-efficient appliances, including water softeners. This regulatory environment is likely to stimulate market growth as consumers seek to comply with new standards while benefiting from potential cost savings. The interplay between regulation and consumer behavior suggests a favorable landscape for the water softening systems market.

    Technological Advancements in Water Softening

    Technological advancements are playing a pivotal role in shaping the Water Softening Systems Market Industry. Innovations such as smart water softeners, which utilize IoT technology for monitoring and control, are becoming increasingly prevalent. These systems not only provide convenience but also optimize salt usage, thereby reducing operational costs. The market is witnessing a shift towards more sustainable solutions, with some systems designed to minimize water waste and energy consumption. As consumers seek more efficient and eco-friendly options, the integration of advanced technologies is likely to enhance the appeal of water softening systems, driving market growth.

    Market Segment Insights

    By Application: Residential (Largest) vs. Industrial (Fastest-Growing)

    <p>The Water Softening Systems Market is characterized by a diverse application landscape, comprising Residential, Commercial, and Industrial segments. Among these, the Residential segment holds the largest market share, driven by the increasing awareness of water quality and its impact on health and household appliances. On the other hand, the Commercial segment, while significant, does not match the prevalence of residential applications. The Industrial segment is gaining momentum as industries recognize the benefits of softened water in processes, indicating a growing shift in market dynamics.</p>

    <p>Residential (Dominant) vs. Industrial (Emerging)</p>

    <p>The Residential application of water softening systems dominates the market, primarily due to rising consumer demand for better water quality and the increasing prevalence of hard water issues in homes. Homeowners are increasingly investing in water softeners to protect plumbing, improve appliance efficiency, and enhance the taste of drinking water. Conversely, the Industrial segment, though currently smaller, is emerging as a key player driven by stringent regulations on water quality and efficiency in industrial processes. Industries such as manufacturing and food processing are adopting advanced water softening solutions to comply with standards and optimize operational efficiency, marking a significant growth trend in this segment.</p>

    By Technology: Ion Exchange (Largest) vs. Salt-Free Water Softening (Fastest-Growing)

    <p>The Water Softening Systems Market is primarily dominated by the Ion Exchange technology, which holds a significant share due to its efficacy in removing hardness-causing minerals like calcium and magnesium. Salt-Free Water Softening is gaining traction among environmentally conscious consumers seeking alternatives to traditional methods. Although its market share is currently smaller than Ion Exchange, its growth potential is driven by the increasing demand for low-sodium solutions in residential and commercial applications.</p>

    <p>Water Softening Systems: Ion Exchange (Dominant) vs. Salt-Free Water Softening (Emerging)</p>

    <p>Ion Exchange technology remains the dominant player in the Water Softening Systems Market, primarily due to its proven effectiveness and widespread adoption in residential and industrial applications. It operates by exchanging sodium ions for hardness ions, providing immediate results in enhancing water quality. In contrast, Salt-Free Water Softening is emerging rapidly as a viable alternative, focusing on conditioning water without the use of chemicals or salt. This technology appeals to consumers looking for eco-friendly solutions, as it not only reduces sodium levels but also prevents scale buildup, making it an attractive option for areas facing water hardness issues.</p>

    By Mechanism: Single Tank (Largest) vs. Dual Tank (Fastest-Growing)

    <p>In the Water Softening Systems Market, the mechanism segment is dominated by the Single Tank systems, which account for a significant portion of market share due to their widespread adoption in residential and small business applications. Dual <a href="https://www.marketresearchfuture.com/reports/global-cryogenic-tanks-market-11342">cryogenic tank </a>systems follow closely, providing a competitive alternative that is gaining traction among consumers who prioritize continuous softening processes without the downtime associated with regeneration cycles. Single Tank with Filter systems, while smaller in market share, cater to a niche segment of users demanding improved water quality along with softening capabilities.</p>

    <p>Single Tank (Dominant) vs. Dual Tank (Emerging)</p>

    <p>Single Tank water softening systems have established themselves as the dominant choice in the market, appealing to consumers due to their simplicity, compactness, and cost-effectiveness. This mechanism simplifies installation and maintenance, making it particularly attractive for residential users. On the other hand, Dual Tank systems are emerging rapidly, especially in larger households or businesses where uninterrupted service is critical. These systems allow one tank to operate while the other regenerates, ensuring a continuous supply of softened water. The increased demand for higher efficiency and convenience has led to significant innovation and improvements in Dual Tank technologies, positioning them as a fast-growing segment with rising consumer preference.</p>

    By End Use: Households (Largest) vs. Manufacturing Plants (Fastest-Growing)

    <p>In the Water Softening Systems Market, the segment distribution reveals that Households hold a substantial share, reflecting a strong demand for residential water softening solutions. As consumers increasingly prioritize the quality of water for health and appliance longevity, households emerge as the primary market segment. In contrast, Manufacturing Plants are gaining traction as the fastest-growing segment, driven by a rising need for high-quality water in industrial processes and the prevention of scale buildup in equipment.</p>

    <p>Households (Dominant) vs. Manufacturing Plants (Emerging)</p>

    <p>Households represent the dominant segment in the Water Softening Systems Market, as they prioritize water quality and the longevity of their plumbing and appliances. This segment is characterized by a growing trend towards investing in home appliance durability and consumer health, leading many homeowners to adopt water softening systems. In contrast, Manufacturing Plants are emerging rapidly due to the heightened awareness of water quality's impact on production efficiency and equipment maintenance. Industries such as food processing, textiles, and power generation are increasingly utilizing water softeners to ensure consistent water quality, reduce operational costs, and comply with stringent regulations, marking this segment as pivotal for future growth.</p>

    Get more detailed insights about Water Softening Systems Market Research Report - Global Forecast till 2035

    Regional Insights

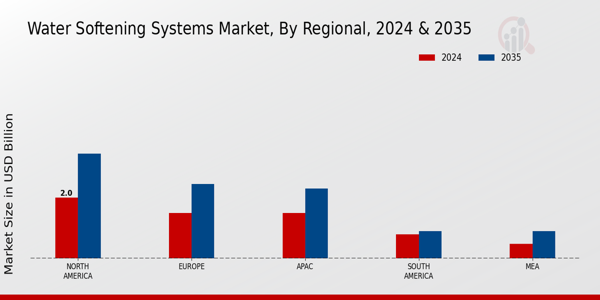
    The Water Softening Systems Market demonstrates significant growth across various regions, with the overall market expected to reach a valuation of 5.28 USD Billion in 2024, and it is projected to further extend to 9.2 USD Billion by 2035. Within this market, North America holds a dominant position, valued at 2.0 USD Billion in 2024 and expected to grow to 3.25 USD billion by 2035, making it a substantial contributor to global market revenue. Europe follows closely, with a valuation of 1.5 USD billion in 2024, rising to 2.5 USD Billion, highlighting its importance in the water softening sector.

    The Asia Pacific region presents promising potential, valued at 1.7 USD Billion in 2024 and anticipated to reach 2.8 USD Billion, driven by accelerating industrial and domestic needs for water treatment solutions. Meanwhile, South America, though smaller in scale, shows consistent growth from 0.35 USD billion in 2024 to 0.6 USD Billion. The Middle East and Africa also reveal upward trends, with valuations starting at 0.73 USD billion in 2024 and reaching 0.95 USD billion by 2035.

    This distributed growth across regions reflects varying water quality challenges and rising awareness about the benefits of water softening systems, thus creating opportunities for expansion within this industry.

    Water Softening Systems Market Regional Insights

    Source: Primary Research, Secondary Research, MRFR Database, and Analyst Review

    Key Players and Competitive Insights

    The Water Softening Systems Market is currently characterized by a dynamic competitive landscape, driven by increasing consumer awareness regarding water quality and the rising prevalence of hard water issues globally. Key players such as Culligan International (US), Pentair (US), and A. O. Smith (US) are strategically positioned to leverage innovation and technological advancements to enhance their product offerings. Culligan International (US) has focused on expanding its service network, while Pentair (US) emphasizes sustainability through energy-efficient solutions. A. O. Smith (US) is actively pursuing digital transformation initiatives to improve customer engagement and operational efficiency. Collectively, these strategies contribute to a competitive environment that is increasingly centered on technological innovation and customer-centric solutions.

    In terms of business tactics, companies are localizing manufacturing to reduce costs and enhance supply chain efficiency. The market structure appears moderately fragmented, with several players vying for market share. However, the influence of major companies is significant, as they set industry standards and drive technological advancements. This competitive structure allows for a diverse range of products and services, catering to various consumer needs and preferences.

    In August 2025, Culligan International (US) announced the launch of a new line of smart water softeners that utilize IoT technology to monitor water usage and optimize salt consumption. This strategic move not only enhances product efficiency but also aligns with the growing trend towards smart home solutions, positioning Culligan as a leader in innovation within the market. The integration of IoT technology is likely to attract tech-savvy consumers and increase customer loyalty.

    In September 2025, Pentair (US) unveiled its latest water softening system designed with advanced filtration capabilities, aimed at addressing both hard water and contaminants. This initiative underscores Pentair's commitment to sustainability and health, as it provides consumers with a dual-function solution. The strategic importance of this launch lies in its potential to capture a broader market segment concerned with both water quality and environmental impact.

    In July 2025, A. O. Smith (US) entered into a partnership with a leading technology firm to develop AI-driven water management solutions. This collaboration is expected to enhance predictive maintenance capabilities and improve customer service through data analytics. The strategic significance of this partnership is profound, as it positions A. O. Smith at the forefront of technological integration in the water softening sector, potentially reshaping customer interactions and operational efficiencies.

    As of October 2025, the competitive trends in the Water Softening Systems Market are increasingly defined by digitalization, sustainability, and the integration of artificial intelligence. Strategic alliances are becoming more prevalent, as companies recognize the value of collaboration in driving innovation and enhancing product offerings. Looking ahead, competitive differentiation is likely to evolve from traditional price-based competition to a focus on technological innovation, supply chain reliability, and sustainable practices, reflecting the changing priorities of consumers and regulatory environments.

    Key Companies in the Water Softening Systems Market market include

    Industry Developments

    The Water Softening Systems Market has grown a lot, thanks to new ideas, a focus on sustainability, and more people learning about the importance of water quality. Companies like GE Appliances and Pentair have been leading the way in this change by adding smart features and green technologies to their products. RainSoft and Aquasana have also gotten a lot of attention for their eco-friendly water treatment products, which include options that don't use salt. Morton Salt is a major supplier of softening salts and plays an important supporting role in the industry, but there is no confirmation of any recent strategic partnerships.

    In the same way, EcoWater Systems is still active in the smart water technology field, but there has been no public confirmation of an acquisition in September 2023. Companies like Culligan and Watts Water Technologies are still doing well because more and more people want to purify and soften their Water at home, especially in areas where the water is hard. The global move toward better filtration and following environmental rules, especially starting in 2022, has made water softening more important in the larger field of residential and commercial water treatment. 

    Future Outlook

    Water Softening Systems Market Future Outlook

    <p>The Water Softening Systems Market is projected to grow at a 6.82% CAGR from 2024 to 2035, driven by increasing water quality concerns and technological advancements.</p>

    New opportunities lie in:

    • <p>Expansion into smart water softening technologies for residential use.</p><p>Development of eco-friendly, salt-free water softening solutions.</p><p>Partnerships with plumbing services for integrated water treatment packages.</p>

    <p>By 2035, the market is expected to be robust, reflecting substantial growth and innovation.</p>

    Market Segmentation

    Water Softening Systems Market End Use Outlook

    • Households
    • Hotels
    • Manufacturing Plants

    Water Softening Systems Market Mechanism Outlook

    • Single Tank
    • Dual Tank
    • Single Tank with Filter

    Water Softening Systems Market Technology Outlook

    • Ion Exchange
    • Salt-Free Water Softening
    • Reverse Osmosis

    Water Softening Systems Market Application Outlook

    • Residential
    • Commercial
    • Industrial

    Report Scope

    MARKET SIZE 20242460.8(USD Billion)
    MARKET SIZE 20252628.63(USD Billion)
    MARKET SIZE 20355084.7(USD Billion)
    COMPOUND ANNUAL GROWTH RATE (CAGR)6.82% (2024 - 2035)
    REPORT COVERAGERevenue Forecast, Competitive Landscape, Growth Factors, and Trends
    BASE YEAR2024
    Market Forecast Period2025 - 2035
    Historical Data2019 - 2024
    Market Forecast UnitsUSD Billion
    Key Companies ProfiledMarket analysis in progress
    Segments CoveredMarket segmentation analysis in progress
    Key Market OpportunitiesIntegration of smart technology in Water Softening Systems Market enhances efficiency and consumer engagement.
    Key Market DynamicsRising consumer awareness of water quality drives demand for advanced water softening technologies and sustainable solutions.
    Countries CoveredNorth America, Europe, APAC, South America, MEA

    Market Highlights

    Author

    Varsha More
    Research Analyst

    She holds an experience of about 6+ years in market research and business consulting, working under the spectrum of information communication technology, telecommunications and semiconductor domains. aarti conceptualizes and implements a scalable business strategy and provides strategic leadership to the clients. her expertise lies in market estimation, competitive intelligence, pipeline analysis, customer assessment, etc.

    Leave a Comment

    Latest Comments

    John Doe
    john@example.com

    This is a great article! Really helped me understand the topic better.

    Posted on July 23, 2025, 10:15 AM
    Jane Smith
    jane@domain.com

    Thanks for sharing this. I’ve bookmarked it for later reference.

    Posted on July 22, 2025, 7:45 PM

    FAQs

    What is the current valuation of the Water Softening Systems Market?

    The market valuation was 2460.8 USD Billion in 2024.

    What is the projected market size for the Water Softening Systems Market by 2035?

    The market is projected to reach 5084.7 USD Billion by 2035.

    What is the expected CAGR for the Water Softening Systems Market during the forecast period 2025 - 2035?

    The expected CAGR is 6.82% during the forecast period 2025 - 2035.

    Which application segment holds the largest market share in the Water Softening Systems Market?

    The Industrial application segment was valued at 1230.4 USD Billion in 2024.

    How does the Ion Exchange technology segment perform in the Water Softening Systems Market?

    The Ion Exchange technology segment was valued at 900.0 USD Billion in 2024.

    What are the key players in the Water Softening Systems Market?

    Key players include Culligan International, Pentair, GE Appliances, and Kinetico.

    What is the market valuation for the Residential application segment?

    The Residential application segment was valued at 738.24 USD Billion in 2024.

    How does the Dual Tank mechanism segment compare in terms of market valuation?

    The Dual Tank mechanism segment was valued at 600.0 USD Billion in 2024.

    What is the market size for the Hotels end-use segment?

    The Hotels end-use segment was valued at 600.0 USD Billion in 2024.

    What is the projected growth for the Salt-Free Water Softening technology segment by 2035?

    The Salt-Free Water Softening technology segment is projected to reach 1200.0 USD Billion by 2035.

    1. EXECUTIVE SUMMARY 1.1. Market Overview 1.2. Key Findings 1.3. Market Segmentation 1.4. Competitive Landscape 1.5. Challenges and Opportunities 1.6. Future Outlook 2. MARKET INTRODUCTION 2.1. Definition 2.2. Scope of the study 2.2.1. Research Objective 2.2.2. Assumption 2.2.3. Limitations 3. RESEARCH METHODOLOGY 3.1. Overview 3.2. Data Mining 3.3. Secondary Research 3.4. Primary Research 3.4.1. Primary Interviews and Information Gathering Process 3.4.2. Breakdown of Primary Respondents 3.5. Forecasting Model 3.6. Market Size Estimation 3.6.1. Bottom-Up Approach 3.6.2. Top-Down Approach 3.7. Data Triangulation 3.8. Validation 4. MARKET DYNAMICS 4.1. Overview 4.2. Drivers 4.3. Restraints 4.4. Opportunities 5. MARKET FACTOR ANALYSIS 5.1. Value chain Analysis 5.2. Porter's Five Forces Analysis 5.2.1. Bargaining Power of Suppliers 5.2.2. Bargaining Power of Buyers 5.2.3. Threat of New Entrants 5.2.4. Threat of Substitutes 5.2.5. Intensity of Rivalry 5.3. COVID-19 Impact Analysis 5.3.1. Market Impact Analysis 5.3.2. Regional Impact 5.3.3. Opportunity and Threat Analysis
      1. \r\n
    2. WATER SOFTENING SYSTEMS MARKET, BY APPLICATION (USD BILLION) 6.1. Residential 6.2. Commercial 6.3. Industrial 7. WATER SOFTENING SYSTEMS MARKET, BY TECHNOLOGY (USD BILLION) 7.1. Ion Exchange 7.2. Salt-Free Water Softening 7.3. Reverse Osmosis 8. WATER SOFTENING SYSTEMS MARKET, BY MECHANISM (USD BILLION) 8.1. Single Tank 8.2. Dual Tank 8.3. Single Tank with Filter 9. WATER SOFTENING SYSTEMS MARKET, BY END USE (USD BILLION) 9.1. Households 9.2. Hotels 9.3. Manufacturing Plants 10. WATER SOFTENING SYSTEMS MARKET, BY REGIONAL (USD BILLION) 10.1. North America 10.1.1. US 10.1.2. Canada 10.2. Europe 10.2.1. Germany 10.2.2. UK 10.2.3. France 10.2.4. Russia 10.2.5. Italy 10.2.6. Spain 10.2.7. Rest of Europe 10.3. APAC 10.3.1. China 10.3.2. India 10.3.3. Japan 10.3.4. South Korea 10.3.5. Malaysia 10.3.6. Thailand 10.3.7. Indonesia 10.3.8. Rest of APAC 10.4. South America 10.4.1. Brazil 10.4.2. Mexico 10.4.3. Argentina 10.4.4. Rest of South America 10.5. MEA 10.5.1. GCC Countries 10.5.2. South Africa 10.5.3. Rest of MEA
      1. \r\n
    3. COMPETITIVE LANDSCAPE 11.1. Overview 11.2. Competitive Analysis 11.3. Market share Analysis 11.4. Major Growth Strategy in the Water Softening Systems Market 11.5. Competitive Benchmarking 11.6. Leading Players in Terms of Number of Developments in the Water Softening Systems Market 11.7. Key developments and growth strategies 11.7.1. New Product Launch/Service Deployment 11.7.2. Merger & Acquisitions 11.7.3. Joint Ventures 11.8. Major Players Financial Matrix 11.8.1. Sales and Operating Income 11.8.2. Major Players R&D Expenditure. 2023 12. COMPANY PROFILES 12.1. GE Appliances 12.1.1. Financial Overview 12.1.2. Products Offered 12.1.3. Key Developments 12.1.4. SWOT Analysis 12.1.5. Key Strategies 12.2. Pentair 12.2.1. Financial Overview 12.2.2. Products Offered 12.2.3. Key Developments 12.2.4. SWOT Analysis 12.2.5. Key Strategies 12.3. Morton Salt 12.3.1. Financial Overview 12.3.2. Products Offered 12.3.3. Key Developments 12.3.4. SWOT Analysis 12.3.5. Key Strategies 12.4. Cleansing Water Systems 12.4.1. Financial Overview 12.4.2. Products Offered 12.4.3. Key Developments 12.4.4. SWOT Analysis 12.4.5. Key Strategies 12.5. Kinetico 12.5.1. Financial Overview 12.5.2. Products Offered 12.5.3. Key Developments 12.5.4. SWOT Analysis 12.5.5. Key Strategies 12.6. Watts Water Technologies 12.6.1. Financial Overview 12.6.2. Products Offered 12.6.3. Key Developments 12.6.4. SWOT Analysis 12.6.5. Key Strategies 12.7. RainSoft 12.7.1. Financial Overview 12.7.2. Products Offered 12.7.3. Key Developments 12.7.4. SWOT Analysis 12.7.5. Key Strategies 12.8. Aquasana 12.8.1. Financial Overview 12.8.2. Products Offered 12.8.3. Key Developments 12.8.4. SWOT Analysis 12.8.5. Key Strategies 12.9. Metso 12.9.1. Financial Overview 12.9.2. Products Offered 12.9.3. Key Developments 12.9.4. SWOT Analysis 12.9.5. Key Strategies 12.10. EcoWater Systems 12.10.1. Financial Overview 12.10.2. Products Offered 12.10.3. Key Developments 12.10.4. SWOT Analysis 12.10.5. Key Strategies 12.11. Bonaqua 12.11.1. Financial Overview 12.11.2. Products Offered 12.11.3. Key Developments 12.11.4. SWOT Analysis 12.11.5. Key Strategies 12.12. AquaChem 12.12.1. Financial Overview 12.12.2. Products Offered 12.12.3. Key Developments 12.12.4. SWOT Analysis 12.12.5. Key Strategies 12.13. Culligan 12.13.1. Financial Overview 12.13.2. Products Offered 12.13.3. Key Developments 12.13.4. SWOT Analysis 12.13.5. Key Strategies 12.14. WaterRight 12.14.1. Financial Overview 12.14.2. Products Offered 12.14.3. Key Developments 12.14.4. SWOT Analysis 12.14.5. Key Strategies 12.15. Harvey Water Softeners 12.15.1. Financial Overview 12.15.2. Products Offered 12.15.3. Key Developments 12.15.4. SWOT Analysis 12.15.5. Key Strategies 13. APPENDIX 13.1. References 13.2. Related Reports LIST OF TABLES
      1. \r\n
    4. LIST OF ASSUMPTIONS TABLE 2. NORTH AMERICA WATER SOFTENING SYSTEMS MARKET SIZE ESTIMATES & FORECAST, BY APPLICATION, 2019-2035 (USD BILLIONS) TABLE 3. NORTH AMERICA WATER SOFTENING SYSTEMS MARKET SIZE ESTIMATES & FORECAST, BY TECHNOLOGY, 2019-2035 (USD BILLIONS) TABLE 4. NORTH AMERICA WATER SOFTENING SYSTEMS MARKET SIZE ESTIMATES & FORECAST, BY MECHANISM, 2019-2035 (USD BILLIONS) TABLE 5. NORTH AMERICA WATER SOFTENING SYSTEMS MARKET SIZE ESTIMATES & FORECAST, BY END USE, 2019-2035 (USD BILLIONS) TABLE 6. NORTH AMERICA WATER SOFTENING SYSTEMS MARKET SIZE ESTIMATES & FORECAST, BY REGIONAL, 2019-2035 (USD BILLIONS) TABLE 7. US WATER SOFTENING SYSTEMS MARKET SIZE ESTIMATES & FORECAST, BY APPLICATION, 2019-2035 (USD BILLIONS) TABLE 8. US WATER SOFTENING SYSTEMS MARKET SIZE ESTIMATES & FORECAST, BY TECHNOLOGY, 2019-2035 (USD BILLIONS) TABLE 9. US WATER SOFTENING SYSTEMS MARKET SIZE ESTIMATES & FORECAST, BY MECHANISM, 2019-2035 (USD BILLIONS) TABLE 10. US WATER SOFTENING SYSTEMS MARKET SIZE ESTIMATES & FORECAST, BY END USE, 2019-2035 (USD BILLIONS) TABLE 11. US WATER SOFTENING SYSTEMS MARKET SIZE ESTIMATES & FORECAST, BY REGIONAL, 2019-2035 (USD BILLIONS) TABLE 12. CANADA WATER SOFTENING SYSTEMS MARKET SIZE ESTIMATES & FORECAST, BY APPLICATION, 2019-2035 (USD BILLIONS) TABLE 13. CANADA WATER SOFTENING SYSTEMS MARKET SIZE ESTIMATES & FORECAST, BY TECHNOLOGY, 2019-2035 (USD BILLIONS) TABLE 14. CANADA WATER SOFTENING SYSTEMS MARKET SIZE ESTIMATES & FORECAST, BY MECHANISM, 2019-2035 (USD BILLIONS) TABLE 15. CANADA WATER SOFTENING SYSTEMS MARKET SIZE ESTIMATES & FORECAST, BY END USE, 2019-2035 (USD BILLIONS) TABLE 16. CANADA WATER SOFTENING SYSTEMS MARKET SIZE ESTIMATES & FORECAST, BY REGIONAL, 2019-2035 (USD BILLIONS) TABLE 17. EUROPE WATER SOFTENING SYSTEMS MARKET SIZE ESTIMATES & FORECAST, BY APPLICATION, 2019-2035 (USD BILLIONS) TABLE 18. EUROPE WATER SOFTENING SYSTEMS MARKET SIZE ESTIMATES & FORECAST, BY TECHNOLOGY, 2019-2035 (USD BILLIONS) TABLE 19. EUROPE WATER SOFTENING SYSTEMS MARKET SIZE ESTIMATES & FORECAST, BY MECHANISM, 2019-2035 (USD BILLIONS) TABLE 20. EUROPE WATER SOFTENING SYSTEMS MARKET SIZE ESTIMATES & FORECAST, BY END USE, 2019-2035 (USD BILLIONS) TABLE 21. EUROPE WATER SOFTENING SYSTEMS MARKET SIZE ESTIMATES & FORECAST, BY REGIONAL, 2019-2035 (USD BILLIONS) TABLE 22. GERMANY WATER SOFTENING SYSTEMS MARKET SIZE ESTIMATES & FORECAST, BY APPLICATION, 2019-2035 (USD BILLIONS) TABLE 23. GERMANY WATER SOFTENING SYSTEMS MARKET SIZE ESTIMATES & FORECAST, BY TECHNOLOGY, 2019-2035 (USD BILLIONS) TABLE 24. GERMANY WATER SOFTENING SYSTEMS MARKET SIZE ESTIMATES & FORECAST, BY MECHANISM, 2019-2035 (USD BILLIONS) TABLE 25. GERMANY WATER SOFTENING SYSTEMS MARKET SIZE ESTIMATES & FORECAST, BY END USE, 2019-2035 (USD BILLIONS) TABLE 26. GERMANY WATER SOFTENING SYSTEMS MARKET SIZE ESTIMATES & FORECAST, BY REGIONAL, 2019-2035 (USD BILLIONS) TABLE 27. UK WATER SOFTENING SYSTEMS MARKET SIZE ESTIMATES & FORECAST, BY APPLICATION, 2019-2035 (USD BILLIONS) TABLE 28. UK WATER SOFTENING SYSTEMS MARKET SIZE ESTIMATES & FORECAST, BY TECHNOLOGY, 2019-2035 (USD BILLIONS) TABLE 29. UK WATER SOFTENING SYSTEMS MARKET SIZE ESTIMATES & FORECAST, BY MECHANISM, 2019-2035 (USD BILLIONS) TABLE 30. UK WATER SOFTENING SYSTEMS MARKET SIZE ESTIMATES & FORECAST, BY END USE, 2019-2035 (USD BILLIONS) TABLE 31. UK WATER SOFTENING SYSTEMS MARKET SIZE ESTIMATES & FORECAST, BY REGIONAL, 2019-2035 (USD BILLIONS) TABLE 32. FRANCE WATER SOFTENING SYSTEMS MARKET SIZE ESTIMATES & FORECAST, BY APPLICATION, 2019-2035 (USD BILLIONS) TABLE 33. FRANCE WATER SOFTENING SYSTEMS MARKET SIZE ESTIMATES & FORECAST, BY TECHNOLOGY, 2019-2035 (USD BILLIONS) TABLE 34. FRANCE WATER SOFTENING SYSTEMS MARKET SIZE ESTIMATES & FORECAST, BY MECHANISM, 2019-2035 (USD BILLIONS) TABLE 35. FRANCE WATER SOFTENING SYSTEMS MARKET SIZE ESTIMATES & FORECAST, BY END USE, 2019-2035 (USD BILLIONS) TABLE 36. FRANCE WATER SOFTENING SYSTEMS MARKET SIZE ESTIMATES & FORECAST, BY REGIONAL, 2019-2035 (USD BILLIONS) TABLE 37. RUSSIA WATER SOFTENING SYSTEMS MARKET SIZE ESTIMATES & FORECAST, BY APPLICATION, 2019-2035 (USD BILLIONS) TABLE 38. RUSSIA WATER SOFTENING SYSTEMS MARKET SIZE ESTIMATES & FORECAST, BY TECHNOLOGY, 2019-2035 (USD BILLIONS) TABLE 39. RUSSIA WATER SOFTENING SYSTEMS MARKET SIZE ESTIMATES & FORECAST, BY MECHANISM, 2019-2035 (USD BILLIONS) TABLE 40. RUSSIA WATER SOFTENING SYSTEMS MARKET SIZE ESTIMATES & FORECAST, BY END USE, 2019-2035 (USD BILLIONS) TABLE 41. RUSSIA WATER SOFTENING SYSTEMS MARKET SIZE ESTIMATES & FORECAST, BY REGIONAL, 2019-2035 (USD BILLIONS) TABLE 42. ITALY WATER SOFTENING SYSTEMS MARKET SIZE ESTIMATES & FORECAST, BY APPLICATION, 2019-2035 (USD BILLIONS) TABLE 43. ITALY WATER SOFTENING SYSTEMS MARKET SIZE ESTIMATES & FORECAST, BY TECHNOLOGY, 2019-2035 (USD BILLIONS) TABLE 44. ITALY WATER SOFTENING SYSTEMS MARKET SIZE ESTIMATES & FORECAST, BY MECHANISM, 2019-2035 (USD BILLIONS) TABLE 45. ITALY WATER SOFTENING SYSTEMS MARKET SIZE ESTIMATES & FORECAST, BY END USE, 2019-2035 (USD BILLIONS) TABLE 46. ITALY WATER SOFTENING SYSTEMS MARKET SIZE ESTIMATES & FORECAST, BY REGIONAL, 2019-2035 (USD BILLIONS) TABLE 47. SPAIN WATER SOFTENING SYSTEMS MARKET SIZE ESTIMATES & FORECAST, BY APPLICATION, 2019-2035 (USD BILLIONS) TABLE 48. SPAIN WATER SOFTENING SYSTEMS MARKET SIZE ESTIMATES & FORECAST, BY TECHNOLOGY, 2019-2035 (USD BILLIONS) TABLE 49. SPAIN WATER SOFTENING SYSTEMS MARKET SIZE ESTIMATES & FORECAST, BY MECHANISM, 2019-2035 (USD BILLIONS) TABLE 50. SPAIN WATER SOFTENING SYSTEMS MARKET SIZE ESTIMATES & FORECAST, BY END USE, 2019-2035 (USD BILLIONS) TABLE 51. SPAIN WATER SOFTENING SYSTEMS MARKET SIZE ESTIMATES & FORECAST, BY REGIONAL, 2019-2035 (USD BILLIONS) TABLE 52. REST OF EUROPE WATER SOFTENING SYSTEMS MARKET SIZE ESTIMATES & FORECAST, BY APPLICATION, 2019-2035 (USD BILLIONS) TABLE 53. REST OF EUROPE WATER SOFTENING SYSTEMS MARKET SIZE ESTIMATES & FORECAST, BY TECHNOLOGY, 2019-2035 (USD BILLIONS) TABLE 54. REST OF EUROPE WATER SOFTENING SYSTEMS MARKET SIZE ESTIMATES & FORECAST, BY MECHANISM, 2019-2035 (USD BILLIONS) TABLE 55. REST OF EUROPE WATER SOFTENING SYSTEMS MARKET SIZE ESTIMATES & FORECAST, BY END USE, 2019-2035 (USD BILLIONS) TABLE 56. REST OF EUROPE WATER SOFTENING SYSTEMS MARKET SIZE ESTIMATES & FORECAST, BY REGIONAL, 2019-2035 (USD BILLIONS) TABLE 57. APAC WATER SOFTENING SYSTEMS MARKET SIZE ESTIMATES & FORECAST, BY APPLICATION, 2019-2035 (USD BILLIONS) TABLE 58. APAC WATER SOFTENING SYSTEMS MARKET SIZE ESTIMATES & FORECAST, BY TECHNOLOGY, 2019-2035 (USD BILLIONS) TABLE 59. APAC WATER SOFTENING SYSTEMS MARKET SIZE ESTIMATES & FORECAST, BY MECHANISM, 2019-2035 (USD BILLIONS) TABLE 60. APAC WATER SOFTENING SYSTEMS MARKET SIZE ESTIMATES & FORECAST, BY END USE, 2019-2035 (USD BILLIONS) TABLE 61. APAC WATER SOFTENING SYSTEMS MARKET SIZE ESTIMATES & FORECAST, BY REGIONAL, 2019-2035 (USD BILLIONS) TABLE 62. CHINA WATER SOFTENING SYSTEMS MARKET SIZE ESTIMATES & FORECAST, BY APPLICATION, 2019-2035 (USD BILLIONS) TABLE 63. CHINA WATER SOFTENING SYSTEMS MARKET SIZE ESTIMATES & FORECAST, BY TECHNOLOGY, 2019-2035 (USD BILLIONS) TABLE 64. CHINA WATER SOFTENING SYSTEMS MARKET SIZE ESTIMATES & FORECAST, BY MECHANISM, 2019-2035 (USD BILLIONS) TABLE 65. CHINA WATER SOFTENING SYSTEMS MARKET SIZE ESTIMATES & FORECAST, BY END USE, 2019-2035 (USD BILLIONS) TABLE 66. CHINA WATER SOFTENING SYSTEMS MARKET SIZE ESTIMATES & FORECAST, BY REGIONAL, 2019-2035 (USD BILLIONS) TABLE 67. INDIA WATER SOFTENING SYSTEMS MARKET SIZE ESTIMATES & FORECAST, BY APPLICATION, 2019-2035 (USD BILLIONS) TABLE 68. INDIA WATER SOFTENING SYSTEMS MARKET SIZE ESTIMATES & FORECAST, BY TECHNOLOGY, 2019-2035 (USD BILLIONS) TABLE 69. INDIA WATER SOFTENING SYSTEMS MARKET SIZE ESTIMATES & FORECAST, BY MECHANISM, 2019-2035 (USD BILLIONS) TABLE 70. INDIA WATER SOFTENING SYSTEMS MARKET SIZE ESTIMATES & FORECAST, BY END USE, 2019-2035 (USD BILLIONS) TABLE 71. INDIA WATER SOFTENING SYSTEMS MARKET SIZE ESTIMATES & FORECAST, BY REGIONAL, 2019-2035 (USD BILLIONS) TABLE 72. JAPAN WATER SOFTENING SYSTEMS MARKET SIZE ESTIMATES & FORECAST, BY APPLICATION, 2019-2035 (USD BILLIONS) TABLE 73. JAPAN WATER SOFTENING SYSTEMS MARKET SIZE ESTIMATES & FORECAST, BY TECHNOLOGY, 2019-2035 (USD BILLIONS) TABLE 74. JAPAN WATER SOFTENING SYSTEMS MARKET SIZE ESTIMATES & FORECAST, BY MECHANISM, 2019-2035 (USD BILLIONS) TABLE 75. JAPAN WATER SOFTENING SYSTEMS MARKET SIZE ESTIMATES & FORECAST, BY END USE, 2019-2035 (USD BILLIONS) TABLE 76. JAPAN WATER SOFTENING SYSTEMS MARKET SIZE ESTIMATES & FORECAST, BY REGIONAL, 2019-2035 (USD BILLIONS) TABLE 77. SOUTH KOREA WATER SOFTENING SYSTEMS MARKET SIZE ESTIMATES & FORECAST, BY APPLICATION, 2019-2035 (USD BILLIONS) TABLE 78. SOUTH KOREA WATER SOFTENING SYSTEMS MARKET SIZE ESTIMATES & FORECAST, BY TECHNOLOGY, 2019-2035 (USD BILLIONS) TABLE 79. SOUTH KOREA WATER SOFTENING SYSTEMS MARKET SIZE ESTIMATES & FORECAST, BY MECHANISM, 2019-2035 (USD BILLIONS) TABLE 80. SOUTH KOREA WATER SOFTENING SYSTEMS MARKET SIZE ESTIMATES & FORECAST, BY END USE, 2019-2035 (USD BILLIONS) TABLE 81. SOUTH KOREA WATER SOFTENING SYSTEMS MARKET SIZE ESTIMATES & FORECAST, BY REGIONAL, 2019-2035 (USD BILLIONS) TABLE 82. MALAYSIA WATER SOFTENING SYSTEMS MARKET SIZE ESTIMATES & FORECAST, BY APPLICATION, 2019-2035 (USD BILLIONS) TABLE 83. MALAYSIA WATER SOFTENING SYSTEMS MARKET SIZE ESTIMATES & FORECAST, BY TECHNOLOGY, 2019-2035 (USD BILLIONS) TABLE 84. MALAYSIA WATER SOFTENING SYSTEMS MARKET SIZE ESTIMATES & FORECAST, BY MECHANISM, 2019-2035 (USD BILLIONS) TABLE 85. MALAYSIA WATER SOFTENING SYSTEMS MARKET SIZE ESTIMATES & FORECAST, BY END USE, 2019-2035 (USD BILLIONS) TABLE 86. MALAYSIA WATER SOFTENING SYSTEMS MARKET SIZE ESTIMATES & FORECAST, BY REGIONAL, 2019-2035 (USD BILLIONS) TABLE 87. THAILAND WATER SOFTENING SYSTEMS MARKET SIZE ESTIMATES & FORECAST, BY APPLICATION, 2019-2035 (USD BILLIONS) TABLE 88. THAILAND WATER SOFTENING SYSTEMS MARKET SIZE ESTIMATES & FORECAST, BY TECHNOLOGY, 2019-2035 (USD BILLIONS) TABLE 89. THAILAND WATER SOFTENING SYSTEMS MARKET SIZE ESTIMATES & FORECAST, BY MECHANISM, 2019-2035 (USD BILLIONS) TABLE 90. THAILAND WATER SOFTENING SYSTEMS MARKET SIZE ESTIMATES & FORECAST, BY END USE, 2019-2035 (USD BILLIONS) TABLE 91. THAILAND WATER SOFTENING SYSTEMS MARKET SIZE ESTIMATES & FORECAST, BY REGIONAL, 2019-2035 (USD BILLIONS) TABLE 92. INDONESIA WATER SOFTENING SYSTEMS MARKET SIZE ESTIMATES & FORECAST, BY APPLICATION, 2019-2035 (USD BILLIONS) TABLE 93. INDONESIA WATER SOFTENING SYSTEMS MARKET SIZE ESTIMATES & FORECAST, BY TECHNOLOGY, 2019-2035 (USD BILLIONS) TABLE 94. INDONESIA WATER SOFTENING SYSTEMS MARKET SIZE ESTIMATES & FORECAST, BY MECHANISM, 2019-2035 (USD BILLIONS) TABLE 95. INDONESIA WATER SOFTENING SYSTEMS MARKET SIZE ESTIMATES & FORECAST, BY END USE, 2019-2035 (USD BILLIONS) TABLE 96. INDONESIA WATER SOFTENING SYSTEMS MARKET SIZE ESTIMATES & FORECAST, BY REGIONAL, 2019-2035 (USD BILLIONS) TABLE 97. REST OF APAC WATER SOFTENING SYSTEMS MARKET SIZE ESTIMATES & FORECAST, BY APPLICATION, 2019-2035 (USD BILLIONS) TABLE 98. REST OF APAC WATER SOFTENING SYSTEMS MARKET SIZE ESTIMATES & FORECAST, BY TECHNOLOGY, 2019-2035 (USD BILLIONS) TABLE 99. REST OF APAC WATER SOFTENING SYSTEMS MARKET SIZE ESTIMATES & FORECAST, BY MECHANISM, 2019-2035 (USD BILLIONS) TABLE 100. REST OF APAC WATER SOFTENING SYSTEMS MARKET SIZE ESTIMATES & FORECAST, BY END USE, 2019-2035 (USD BILLIONS) TABLE 101. REST OF APAC WATER SOFTENING SYSTEMS MARKET SIZE ESTIMATES & FORECAST, BY REGIONAL, 2019-2035 (USD BILLIONS) TABLE 102. SOUTH AMERICA WATER SOFTENING SYSTEMS MARKET SIZE ESTIMATES & FORECAST, BY APPLICATION, 2019-2035 (USD BILLIONS) TABLE 103. SOUTH AMERICA WATER SOFTENING SYSTEMS MARKET SIZE ESTIMATES & FORECAST, BY TECHNOLOGY, 2019-2035 (USD BILLIONS) TABLE 104. SOUTH AMERICA WATER SOFTENING SYSTEMS MARKET SIZE ESTIMATES & FORECAST, BY MECHANISM, 2019-2035 (USD BILLIONS) TABLE 105. SOUTH AMERICA WATER SOFTENING SYSTEMS MARKET SIZE ESTIMATES & FORECAST, BY END USE, 2019-2035 (USD BILLIONS) TABLE 106. SOUTH AMERICA WATER SOFTENING SYSTEMS MARKET SIZE ESTIMATES & FORECAST, BY REGIONAL, 2019-2035 (USD BILLIONS) TABLE 107. BRAZIL WATER SOFTENING SYSTEMS MARKET SIZE ESTIMATES & FORECAST, BY APPLICATION, 2019-2035 (USD BILLIONS) TABLE 108. BRAZIL WATER SOFTENING SYSTEMS MARKET SIZE ESTIMATES & FORECAST, BY TECHNOLOGY, 2019-2035 (USD BILLIONS) TABLE 109. BRAZIL WATER SOFTENING SYSTEMS MARKET SIZE ESTIMATES & FORECAST, BY MECHANISM, 2019-2035 (USD BILLIONS) TABLE 110. BRAZIL WATER SOFTENING SYSTEMS MARKET SIZE ESTIMATES & FORECAST, BY END USE, 2019-2035 (USD BILLIONS) TABLE 111. BRAZIL WATER SOFTENING SYSTEMS MARKET SIZE ESTIMATES & FORECAST, BY REGIONAL, 2019-2035 (USD BILLIONS) TABLE 112. MEXICO WATER SOFTENING SYSTEMS MARKET SIZE ESTIMATES & FORECAST, BY APPLICATION, 2019-2035 (USD BILLIONS) TABLE 113. MEXICO WATER SOFTENING SYSTEMS MARKET SIZE ESTIMATES & FORECAST, BY TECHNOLOGY, 2019-2035 (USD BILLIONS) TABLE 114. MEXICO WATER SOFTENING SYSTEMS MARKET SIZE ESTIMATES & FORECAST, BY MECHANISM, 2019-2035 (USD BILLIONS) TABLE 115. MEXICO WATER SOFTENING SYSTEMS MARKET SIZE ESTIMATES & FORECAST, BY END USE, 2019-2035 (USD BILLIONS) TABLE 116. MEXICO WATER SOFTENING SYSTEMS MARKET SIZE ESTIMATES & FORECAST, BY REGIONAL, 2019-2035 (USD BILLIONS) TABLE 117. ARGENTINA WATER SOFTENING SYSTEMS MARKET SIZE ESTIMATES & FORECAST, BY APPLICATION, 2019-2035 (USD BILLIONS) TABLE 118. ARGENTINA WATER SOFTENING SYSTEMS MARKET SIZE ESTIMATES & FORECAST, BY TECHNOLOGY, 2019-2035 (USD BILLIONS) TABLE 119. ARGENTINA WATER SOFTENING SYSTEMS MARKET SIZE ESTIMATES & FORECAST, BY MECHANISM, 2019-2035 (USD BILLIONS) TABLE 120. ARGENTINA WATER SOFTENING SYSTEMS MARKET SIZE ESTIMATES & FORECAST, BY END USE, 2019-2035 (USD BILLIONS) TABLE 121. ARGENTINA WATER SOFTENING SYSTEMS MARKET SIZE ESTIMATES & FORECAST, BY REGIONAL, 2019-2035 (USD BILLIONS) TABLE 122. REST OF SOUTH AMERICA WATER SOFTENING SYSTEMS MARKET SIZE ESTIMATES & FORECAST, BY APPLICATION, 2019-2035 (USD BILLIONS) TABLE 123. REST OF SOUTH AMERICA WATER SOFTENING SYSTEMS MARKET SIZE ESTIMATES & FORECAST, BY TECHNOLOGY, 2019-2035 (USD BILLIONS) TABLE 124. REST OF SOUTH AMERICA WATER SOFTENING SYSTEMS MARKET SIZE ESTIMATES & FORECAST, BY MECHANISM, 2019-2035 (USD BILLIONS) TABLE 125. REST OF SOUTH AMERICA WATER SOFTENING SYSTEMS MARKET SIZE ESTIMATES & FORECAST, BY END USE, 2019-2035 (USD BILLIONS) TABLE 126. REST OF SOUTH AMERICA WATER SOFTENING SYSTEMS MARKET SIZE ESTIMATES & FORECAST, BY REGIONAL, 2019-2035 (USD BILLIONS) TABLE 127. MEA WATER SOFTENING SYSTEMS MARKET SIZE ESTIMATES & FORECAST, BY APPLICATION, 2019-2035 (USD BILLIONS) TABLE 128. MEA WATER SOFTENING SYSTEMS MARKET SIZE ESTIMATES & FORECAST, BY TECHNOLOGY, 2019-2035 (USD BILLIONS) TABLE 129. MEA WATER SOFTENING SYSTEMS MARKET SIZE ESTIMATES & FORECAST, BY MECHANISM, 2019-2035 (USD BILLIONS) TABLE 130. MEA WATER SOFTENING SYSTEMS MARKET SIZE ESTIMATES & FORECAST, BY END USE, 2019-2035 (USD BILLIONS) TABLE 131. MEA WATER SOFTENING SYSTEMS MARKET SIZE ESTIMATES & FORECAST, BY REGIONAL, 2019-2035 (USD BILLIONS) TABLE 132. GCC COUNTRIES WATER SOFTENING SYSTEMS MARKET SIZE ESTIMATES & FORECAST, BY APPLICATION, 2019-2035 (USD BILLIONS) TABLE 133. GCC COUNTRIES WATER SOFTENING SYSTEMS MARKET SIZE ESTIMATES & FORECAST, BY TECHNOLOGY, 2019-2035 (USD BILLIONS) TABLE 134. GCC COUNTRIES WATER SOFTENING SYSTEMS MARKET SIZE ESTIMATES & FORECAST, BY MECHANISM, 2019-2035 (USD BILLIONS) TABLE 135. GCC COUNTRIES WATER SOFTENING SYSTEMS MARKET SIZE ESTIMATES & FORECAST, BY END USE, 2019-2035 (USD BILLIONS) TABLE 136. GCC COUNTRIES WATER SOFTENING SYSTEMS MARKET SIZE ESTIMATES & FORECAST, BY REGIONAL, 2019-2035 (USD BILLIONS) TABLE 137. SOUTH AFRICA WATER SOFTENING SYSTEMS MARKET SIZE ESTIMATES & FORECAST, BY APPLICATION, 2019-2035 (USD BILLIONS) TABLE 138. SOUTH AFRICA WATER SOFTENING SYSTEMS MARKET SIZE ESTIMATES & FORECAST, BY TECHNOLOGY, 2019-2035 (USD BILLIONS) TABLE 139. SOUTH AFRICA WATER SOFTENING SYSTEMS MARKET SIZE ESTIMATES & FORECAST, BY MECHANISM, 2019-2035 (USD BILLIONS) TABLE 140. SOUTH AFRICA WATER SOFTENING SYSTEMS MARKET SIZE ESTIMATES & FORECAST, BY END USE, 2019-2035 (USD BILLIONS) TABLE 141. SOUTH AFRICA WATER SOFTENING SYSTEMS MARKET SIZE ESTIMATES & FORECAST, BY REGIONAL, 2019-2035 (USD BILLIONS) TABLE 142. REST OF MEA WATER SOFTENING SYSTEMS MARKET SIZE ESTIMATES & FORECAST, BY APPLICATION, 2019-2035 (USD BILLIONS) TABLE 143. REST OF MEA WATER SOFTENING SYSTEMS MARKET SIZE ESTIMATES & FORECAST, BY TECHNOLOGY, 2019-2035 (USD BILLIONS) TABLE 144. REST OF MEA WATER SOFTENING SYSTEMS MARKET SIZE ESTIMATES & FORECAST, BY MECHANISM, 2019-2035 (USD BILLIONS) TABLE 145. REST OF MEA WATER SOFTENING SYSTEMS MARKET SIZE ESTIMATES & FORECAST, BY END USE, 2019-2035 (USD BILLIONS) TABLE 146. REST OF MEA WATER SOFTENING SYSTEMS MARKET SIZE ESTIMATES & FORECAST, BY REGIONAL, 2019-2035 (USD BILLIONS) TABLE 147. PRODUCT LAUNCH/PRODUCT DEVELOPMENT/APPROVAL TABLE 148. ACQUISITION/PARTNERSHIP
      1. \r\n
    5. LIST OF FIGURES
      1. \r\n
    6. MARKET SYNOPSIS FIGURE 2. NORTH AMERICA WATER SOFTENING SYSTEMS MARKET ANALYSIS FIGURE 3. US WATER SOFTENING SYSTEMS MARKET ANALYSIS BY APPLICATION FIGURE 4. US WATER SOFTENING SYSTEMS MARKET ANALYSIS BY TECHNOLOGY FIGURE 5. US WATER SOFTENING SYSTEMS MARKET ANALYSIS BY MECHANISM FIGURE 6. US WATER SOFTENING SYSTEMS MARKET ANALYSIS BY END USE FIGURE 7. US WATER SOFTENING SYSTEMS MARKET ANALYSIS BY REGIONAL FIGURE 8. CANADA WATER SOFTENING SYSTEMS MARKET ANALYSIS BY APPLICATION FIGURE 9. CANADA WATER SOFTENING SYSTEMS MARKET ANALYSIS BY TECHNOLOGY FIGURE 10. CANADA WATER SOFTENING SYSTEMS MARKET ANALYSIS BY MECHANISM FIGURE 11. CANADA WATER SOFTENING SYSTEMS MARKET ANALYSIS BY END USE FIGURE 12. CANADA WATER SOFTENING SYSTEMS MARKET ANALYSIS BY REGIONAL FIGURE 13. EUROPE WATER SOFTENING SYSTEMS MARKET ANALYSIS FIGURE 14. GERMANY WATER SOFTENING SYSTEMS MARKET ANALYSIS BY APPLICATION FIGURE 15. GERMANY WATER SOFTENING SYSTEMS MARKET ANALYSIS BY TECHNOLOGY FIGURE 16. GERMANY WATER SOFTENING SYSTEMS MARKET ANALYSIS BY MECHANISM FIGURE 17. GERMANY WATER SOFTENING SYSTEMS MARKET ANALYSIS BY END USE FIGURE 18. GERMANY WATER SOFTENING SYSTEMS MARKET ANALYSIS BY REGIONAL FIGURE 19. UK WATER SOFTENING SYSTEMS MARKET ANALYSIS BY APPLICATION FIGURE 20. UK WATER SOFTENING SYSTEMS MARKET ANALYSIS BY TECHNOLOGY FIGURE 21. UK WATER SOFTENING SYSTEMS MARKET ANALYSIS BY MECHANISM FIGURE 22. UK WATER SOFTENING SYSTEMS MARKET ANALYSIS BY END USE FIGURE 23. UK WATER SOFTENING SYSTEMS MARKET ANALYSIS BY REGIONAL FIGURE 24. FRANCE WATER SOFTENING SYSTEMS MARKET ANALYSIS BY APPLICATION FIGURE 25. FRANCE WATER SOFTENING SYSTEMS MARKET ANALYSIS BY TECHNOLOGY FIGURE 26. FRANCE WATER SOFTENING SYSTEMS MARKET ANALYSIS BY MECHANISM FIGURE 27. FRANCE WATER SOFTENING SYSTEMS MARKET ANALYSIS BY END USE FIGURE 28. FRANCE WATER SOFTENING SYSTEMS MARKET ANALYSIS BY REGIONAL FIGURE 29. RUSSIA WATER SOFTENING SYSTEMS MARKET ANALYSIS BY APPLICATION FIGURE 30. RUSSIA WATER SOFTENING SYSTEMS MARKET ANALYSIS BY TECHNOLOGY FIGURE 31. RUSSIA WATER SOFTENING SYSTEMS MARKET ANALYSIS BY MECHANISM FIGURE 32. RUSSIA WATER SOFTENING SYSTEMS MARKET ANALYSIS BY END USE FIGURE 33. RUSSIA WATER SOFTENING SYSTEMS MARKET ANALYSIS BY REGIONAL FIGURE 34. ITALY WATER SOFTENING SYSTEMS MARKET ANALYSIS BY APPLICATION FIGURE 35. ITALY WATER SOFTENING SYSTEMS MARKET ANALYSIS BY TECHNOLOGY FIGURE 36. ITALY WATER SOFTENING SYSTEMS MARKET ANALYSIS BY MECHANISM FIGURE 37. ITALY WATER SOFTENING SYSTEMS MARKET ANALYSIS BY END USE FIGURE 38. ITALY WATER SOFTENING SYSTEMS MARKET ANALYSIS BY REGIONAL FIGURE 39. SPAIN WATER SOFTENING SYSTEMS MARKET ANALYSIS BY APPLICATION FIGURE 40. SPAIN WATER SOFTENING SYSTEMS MARKET ANALYSIS BY TECHNOLOGY FIGURE 41. SPAIN WATER SOFTENING SYSTEMS MARKET ANALYSIS BY MECHANISM FIGURE 42. SPAIN WATER SOFTENING SYSTEMS MARKET ANALYSIS BY END USE FIGURE 43. SPAIN WATER SOFTENING SYSTEMS MARKET ANALYSIS BY REGIONAL FIGURE 44. REST OF EUROPE WATER SOFTENING SYSTEMS MARKET ANALYSIS BY APPLICATION FIGURE 45. REST OF EUROPE WATER SOFTENING SYSTEMS MARKET ANALYSIS BY TECHNOLOGY FIGURE 46. REST OF EUROPE WATER SOFTENING SYSTEMS MARKET ANALYSIS BY MECHANISM FIGURE 47. REST OF EUROPE WATER SOFTENING SYSTEMS MARKET ANALYSIS BY END USE FIGURE 48. REST OF EUROPE WATER SOFTENING SYSTEMS MARKET ANALYSIS BY REGIONAL FIGURE 49. APAC WATER SOFTENING SYSTEMS MARKET ANALYSIS FIGURE 50. CHINA WATER SOFTENING SYSTEMS MARKET ANALYSIS BY APPLICATION FIGURE 51. CHINA WATER SOFTENING SYSTEMS MARKET ANALYSIS BY TECHNOLOGY FIGURE 52. CHINA WATER SOFTENING SYSTEMS MARKET ANALYSIS BY MECHANISM FIGURE 53. CHINA WATER SOFTENING SYSTEMS MARKET ANALYSIS BY END USE FIGURE 54. CHINA WATER SOFTENING SYSTEMS MARKET ANALYSIS BY REGIONAL FIGURE 55. INDIA WATER SOFTENING SYSTEMS MARKET ANALYSIS BY APPLICATION FIGURE 56. INDIA WATER SOFTENING SYSTEMS MARKET ANALYSIS BY TECHNOLOGY FIGURE 57. INDIA WATER SOFTENING SYSTEMS MARKET ANALYSIS BY MECHANISM FIGURE 58. INDIA WATER SOFTENING SYSTEMS MARKET ANALYSIS BY END USE FIGURE 59. INDIA WATER SOFTENING SYSTEMS MARKET ANALYSIS BY REGIONAL FIGURE 60. JAPAN WATER SOFTENING SYSTEMS MARKET ANALYSIS BY APPLICATION FIGURE 61. JAPAN WATER SOFTENING SYSTEMS MARKET ANALYSIS BY TECHNOLOGY FIGURE 62. JAPAN WATER SOFTENING SYSTEMS MARKET ANALYSIS BY MECHANISM FIGURE 63. JAPAN WATER SOFTENING SYSTEMS MARKET ANALYSIS BY END USE FIGURE 64. JAPAN WATER SOFTENING SYSTEMS MARKET ANALYSIS BY REGIONAL FIGURE 65. SOUTH KOREA WATER SOFTENING SYSTEMS MARKET ANALYSIS BY APPLICATION FIGURE 66. SOUTH KOREA WATER SOFTENING SYSTEMS MARKET ANALYSIS BY TECHNOLOGY FIGURE 67. SOUTH KOREA WATER SOFTENING SYSTEMS MARKET ANALYSIS BY MECHANISM FIGURE 68. SOUTH KOREA WATER SOFTENING SYSTEMS MARKET ANALYSIS BY END USE FIGURE 69. SOUTH KOREA WATER SOFTENING SYSTEMS MARKET ANALYSIS BY REGIONAL FIGURE 70. MALAYSIA WATER SOFTENING SYSTEMS MARKET ANALYSIS BY APPLICATION FIGURE 71. MALAYSIA WATER SOFTENING SYSTEMS MARKET ANALYSIS BY TECHNOLOGY FIGURE 72. MALAYSIA WATER SOFTENING SYSTEMS MARKET ANALYSIS BY MECHANISM FIGURE 73. MALAYSIA WATER SOFTENING SYSTEMS MARKET ANALYSIS BY END USE FIGURE 74. MALAYSIA WATER SOFTENING SYSTEMS MARKET ANALYSIS BY REGIONAL FIGURE 75. THAILAND WATER SOFTENING SYSTEMS MARKET ANALYSIS BY APPLICATION FIGURE 76. THAILAND WATER SOFTENING SYSTEMS MARKET ANALYSIS BY TECHNOLOGY FIGURE 77. THAILAND WATER SOFTENING SYSTEMS MARKET ANALYSIS BY MECHANISM FIGURE 78. THAILAND WATER SOFTENING SYSTEMS MARKET ANALYSIS BY END USE FIGURE 79. THAILAND WATER SOFTENING SYSTEMS MARKET ANALYSIS BY REGIONAL FIGURE 80. INDONESIA WATER SOFTENING SYSTEMS MARKET ANALYSIS BY APPLICATION FIGURE 81. INDONESIA WATER SOFTENING SYSTEMS MARKET ANALYSIS BY TECHNOLOGY FIGURE 82. INDONESIA WATER SOFTENING SYSTEMS MARKET ANALYSIS BY MECHANISM FIGURE 83. INDONESIA WATER SOFTENING SYSTEMS MARKET ANALYSIS BY END USE FIGURE 84. INDONESIA WATER SOFTENING SYSTEMS MARKET ANALYSIS BY REGIONAL FIGURE 85. REST OF APAC WATER SOFTENING SYSTEMS MARKET ANALYSIS BY APPLICATION FIGURE 86. REST OF APAC WATER SOFTENING SYSTEMS MARKET ANALYSIS BY TECHNOLOGY FIGURE 87. REST OF APAC WATER SOFTENING SYSTEMS MARKET ANALYSIS BY MECHANISM FIGURE 88. REST OF APAC WATER SOFTENING SYSTEMS MARKET ANALYSIS BY END USE FIGURE 89. REST OF APAC WATER SOFTENING SYSTEMS MARKET ANALYSIS BY REGIONAL FIGURE 90. SOUTH AMERICA WATER SOFTENING SYSTEMS MARKET ANALYSIS FIGURE 91. BRAZIL WATER SOFTENING SYSTEMS MARKET ANALYSIS BY APPLICATION FIGURE 92. BRAZIL WATER SOFTENING SYSTEMS MARKET ANALYSIS BY TECHNOLOGY FIGURE 93. BRAZIL WATER SOFTENING SYSTEMS MARKET ANALYSIS BY MECHANISM FIGURE 94. BRAZIL WATER SOFTENING SYSTEMS MARKET ANALYSIS BY END USE FIGURE 95. BRAZIL WATER SOFTENING SYSTEMS MARKET ANALYSIS BY REGIONAL FIGURE 96. MEXICO WATER SOFTENING SYSTEMS MARKET ANALYSIS BY APPLICATION FIGURE 97. MEXICO WATER SOFTENING SYSTEMS MARKET ANALYSIS BY TECHNOLOGY FIGURE 98. MEXICO WATER SOFTENING SYSTEMS MARKET ANALYSIS BY MECHANISM FIGURE 99. MEXICO WATER SOFTENING SYSTEMS MARKET ANALYSIS BY END USE FIGURE 100. MEXICO WATER SOFTENING SYSTEMS MARKET ANALYSIS BY REGIONAL FIGURE 101. ARGENTINA WATER SOFTENING SYSTEMS MARKET ANALYSIS BY APPLICATION FIGURE 102. ARGENTINA WATER SOFTENING SYSTEMS MARKET ANALYSIS BY TECHNOLOGY FIGURE 103. ARGENTINA WATER SOFTENING SYSTEMS MARKET ANALYSIS BY MECHANISM FIGURE 104. ARGENTINA WATER SOFTENING SYSTEMS MARKET ANALYSIS BY END USE FIGURE 105. ARGENTINA WATER SOFTENING SYSTEMS MARKET ANALYSIS BY REGIONAL FIGURE 106. REST OF SOUTH AMERICA WATER SOFTENING SYSTEMS MARKET ANALYSIS BY APPLICATION FIGURE 107. REST OF SOUTH AMERICA WATER SOFTENING SYSTEMS MARKET ANALYSIS BY TECHNOLOGY FIGURE 108. REST OF SOUTH AMERICA WATER SOFTENING SYSTEMS MARKET ANALYSIS BY MECHANISM FIGURE 109. REST OF SOUTH AMERICA WATER SOFTENING SYSTEMS MARKET ANALYSIS BY END USE FIGURE 110. REST OF SOUTH AMERICA WATER SOFTENING SYSTEMS MARKET ANALYSIS BY REGIONAL FIGURE 111. MEA WATER SOFTENING SYSTEMS MARKET ANALYSIS FIGURE 112. GCC COUNTRIES WATER SOFTENING SYSTEMS MARKET ANALYSIS BY APPLICATION FIGURE 113. GCC COUNTRIES WATER SOFTENING SYSTEMS MARKET ANALYSIS BY TECHNOLOGY FIGURE 114. GCC COUNTRIES WATER SOFTENING SYSTEMS MARKET ANALYSIS BY MECHANISM FIGURE 115. GCC COUNTRIES WATER SOFTENING SYSTEMS MARKET ANALYSIS BY END USE FIGURE 116. GCC COUNTRIES WATER SOFTENING SYSTEMS MARKET ANALYSIS BY REGIONAL FIGURE 117. SOUTH AFRICA WATER SOFTENING SYSTEMS MARKET ANALYSIS BY APPLICATION FIGURE 118. SOUTH AFRICA WATER SOFTENING SYSTEMS MARKET ANALYSIS BY TECHNOLOGY FIGURE 119. SOUTH AFRICA WATER SOFTENING SYSTEMS MARKET ANALYSIS BY MECHANISM FIGURE 120. SOUTH AFRICA WATER SOFTENING SYSTEMS MARKET ANALYSIS BY END USE FIGURE 121. SOUTH AFRICA WATER SOFTENING SYSTEMS MARKET ANALYSIS BY REGIONAL FIGURE 122. REST OF MEA WATER SOFTENING SYSTEMS MARKET ANALYSIS BY APPLICATION FIGURE 123. REST OF MEA WATER SOFTENING SYSTEMS MARKET ANALYSIS BY TECHNOLOGY FIGURE 124. REST OF MEA WATER SOFTENING SYSTEMS MARKET ANALYSIS BY MECHANISM FIGURE 125. REST OF MEA WATER SOFTENING SYSTEMS MARKET ANALYSIS BY END USE FIGURE 126. REST OF MEA WATER SOFTENING SYSTEMS MARKET ANALYSIS BY REGIONAL FIGURE 127. KEY BUYING CRITERIA OF WATER SOFTENING SYSTEMS MARKET FIGURE 128. RESEARCH PROCESS OF MRFR FIGURE 129. DRO ANALYSIS OF WATER SOFTENING SYSTEMS MARKET FIGURE 130. DRIVERS IMPACT ANALYSIS: WATER SOFTENING SYSTEMS MARKET FIGURE 131. RESTRAINTS IMPACT ANALYSIS: WATER SOFTENING SYSTEMS MARKET FIGURE 132. SUPPLY / VALUE CHAIN: WATER SOFTENING SYSTEMS MARKET FIGURE 133. WATER SOFTENING SYSTEMS MARKET, BY APPLICATION, 2025 (% SHARE) FIGURE 134. WATER SOFTENING SYSTEMS MARKET, BY APPLICATION, 2019 TO 2035 (USD Billions) FIGURE 135. WATER SOFTENING SYSTEMS MARKET, BY TECHNOLOGY, 2025 (% SHARE) FIGURE 136. WATER SOFTENING SYSTEMS MARKET, BY TECHNOLOGY, 2019 TO 2035 (USD Billions) FIGURE 137. WATER SOFTENING SYSTEMS MARKET, BY MECHANISM, 2025 (% SHARE) FIGURE 138. WATER SOFTENING SYSTEMS MARKET, BY MECHANISM, 2019 TO 2035 (USD Billions) FIGURE 139. WATER SOFTENING SYSTEMS MARKET, BY END USE, 2025 (% SHARE) FIGURE 140. WATER SOFTENING SYSTEMS MARKET, BY END USE, 2019 TO 2035 (USD Billions) FIGURE 141. WATER SOFTENING SYSTEMS MARKET, BY REGIONAL, 2025 (% SHARE) FIGURE 142. WATER SOFTENING SYSTEMS MARKET, BY REGIONAL, 2019 TO 2035 (USD Billions) FIGURE 143. BENCHMARKING OF MAJOR COMPETITORS
      1. \r\n

    Water Softening Systems Market Segmentation


    Water Softening Systems Market By Application (USD Billion, 2019-2035)

    Residential

    Commercial

    Industrial


    Water Softening Systems Market By Technology (USD Billion, 2019-2035)

    Ion Exchange

    Salt-Free Water Softening

    Reverse Osmosis


    Water Softening Systems Market By Mechanism (USD Billion, 2019-2035)

    Single Tank

    Dual Tank

    Single Tank with Filter


    Water Softening Systems Market By End Use (USD Billion, 2019-2035)

    Households

    Hotels

    Manufacturing Plants


    Water Softening Systems Market By Regional (USD Billion, 2019-2035)

    North America

    Europe

    South America

    Asia Pacific

    Middle East and Africa


    Water Softening Systems Market Regional Outlook (USD Billion, 2019-2035)


    North America Outlook (USD Billion, 2019-2035)

    North America Water Softening Systems Market by Application Type

    Residential

    Commercial

    Industrial

    North America Water Softening Systems Market by Technology Type

    Ion Exchange

    Salt-Free Water Softening

    Reverse Osmosis

    North America Water Softening Systems Market by Mechanism Type

    Single Tank

    Dual Tank

    Single Tank with Filter

    North America Water Softening Systems Market by End Use Type

    Households

    Hotels

    Manufacturing Plants

    North America Water Softening Systems Market by Regional Type

    US

    Canada

    US Outlook (USD Billion, 2019-2035)

    US Water Softening Systems Market by Application Type

    Residential

    Commercial

    Industrial

    US Water Softening Systems Market by Technology Type

    Ion Exchange

    Salt-Free Water Softening

    Reverse Osmosis

    US Water Softening Systems Market by Mechanism Type

    Single Tank

    Dual Tank

    Single Tank with Filter

    US Water Softening Systems Market by End Use Type

    Households

    Hotels

    Manufacturing Plants

    CANADA Outlook (USD Billion, 2019-2035)

    CANADA Water Softening Systems Market by Application Type

    Residential

    Commercial

    Industrial

    CANADA Water Softening Systems Market by Technology Type

    Ion Exchange

    Salt-Free Water Softening

    Reverse Osmosis

    CANADA Water Softening Systems Market by Mechanism Type

    Single Tank

    Dual Tank

    Single Tank with Filter

    CANADA Water Softening Systems Market by End Use Type

    Households

    Hotels

    Manufacturing Plants

    Europe Outlook (USD Billion, 2019-2035)

    Europe Water Softening Systems Market by Application Type

    Residential

    Commercial

    Industrial

    Europe Water Softening Systems Market by Technology Type

    Ion Exchange

    Salt-Free Water Softening

    Reverse Osmosis

    Europe Water Softening Systems Market by Mechanism Type

    Single Tank

    Dual Tank

    Single Tank with Filter

    Europe Water Softening Systems Market by End Use Type

    Households

    Hotels

    Manufacturing Plants

    Europe Water Softening Systems Market by Regional Type

    Germany

    UK

    France

    Russia

    Italy

    Spain

    Rest of Europe

    GERMANY Outlook (USD Billion, 2019-2035)

    GERMANY Water Softening Systems Market by Application Type

    Residential

    Commercial

    Industrial

    GERMANY Water Softening Systems Market by Technology Type

    Ion Exchange

    Salt-Free Water Softening

    Reverse Osmosis

    GERMANY Water Softening Systems Market by Mechanism Type

    Single Tank

    Dual Tank

    Single Tank with Filter

    GERMANY Water Softening Systems Market by End Use Type

    Households

    Hotels

    Manufacturing Plants

    UK Outlook (USD Billion, 2019-2035)

    UK Water Softening Systems Market by Application Type

    Residential

    Commercial

    Industrial

    UK Water Softening Systems Market by Technology Type

    Ion Exchange

    Salt-Free Water Softening

    Reverse Osmosis

    UK Water Softening Systems Market by Mechanism Type

    Single Tank

    Dual Tank

    Single Tank with Filter

    UK Water Softening Systems Market by End Use Type

    Households

    Hotels

    Manufacturing Plants

    FRANCE Outlook (USD Billion, 2019-2035)

    FRANCE Water Softening Systems Market by Application Type

    Residential

    Commercial

    Industrial

    FRANCE Water Softening Systems Market by Technology Type

    Ion Exchange

    Salt-Free Water Softening

    Reverse Osmosis

    FRANCE Water Softening Systems Market by Mechanism Type

    Single Tank

    Dual Tank

    Single Tank with Filter

    FRANCE Water Softening Systems Market by End Use Type

    Households

    Hotels

    Manufacturing Plants

    RUSSIA Outlook (USD Billion, 2019-2035)

    RUSSIA Water Softening Systems Market by Application Type

    Residential

    Commercial

    Industrial

    RUSSIA Water Softening Systems Market by Technology Type

    Ion Exchange

    Salt-Free Water Softening

    Reverse Osmosis

    RUSSIA Water Softening Systems Market by Mechanism Type

    Single Tank

    Dual Tank

    Single Tank with Filter

    RUSSIA Water Softening Systems Market by End Use Type

    Households

    Hotels

    Manufacturing Plants

    ITALY Outlook (USD Billion, 2019-2035)

    ITALY Water Softening Systems Market by Application Type

    Residential

    Commercial

    Industrial

    ITALY Water Softening Systems Market by Technology Type

    Ion Exchange

    Salt-Free Water Softening

    Reverse Osmosis

    ITALY Water Softening Systems Market by Mechanism Type

    Single Tank

    Dual Tank

    Single Tank with Filter

    ITALY Water Softening Systems Market by End Use Type

    Households

    Hotels

    Manufacturing Plants

    SPAIN Outlook (USD Billion, 2019-2035)

    SPAIN Water Softening Systems Market by Application Type

    Residential

    Commercial

    Industrial

    SPAIN Water Softening Systems Market by Technology Type

    Ion Exchange

    Salt-Free Water Softening

    Reverse Osmosis

    SPAIN Water Softening Systems Market by Mechanism Type

    Single Tank

    Dual Tank

    Single Tank with Filter

    SPAIN Water Softening Systems Market by End Use Type

    Households

    Hotels

    Manufacturing Plants

    REST OF EUROPE Outlook (USD Billion, 2019-2035)

    REST OF EUROPE Water Softening Systems Market by Application Type

    Residential

    Commercial

    Industrial

    REST OF EUROPE Water Softening Systems Market by Technology Type

    Ion Exchange

    Salt-Free Water Softening

    Reverse Osmosis

    REST OF EUROPE Water Softening Systems Market by Mechanism Type

    Single Tank

    Dual Tank

    Single Tank with Filter

    REST OF EUROPE Water Softening Systems Market by End Use Type

    Households

    Hotels

    Manufacturing Plants

    APAC Outlook (USD Billion, 2019-2035)

    APAC Water Softening Systems Market by Application Type

    Residential

    Commercial

    Industrial

    APAC Water Softening Systems Market by Technology Type

    Ion Exchange

    Salt-Free Water Softening

    Reverse Osmosis

    APAC Water Softening Systems Market by Mechanism Type

    Single Tank

    Dual Tank

    Single Tank with Filter

    APAC Water Softening Systems Market by End Use Type

    Households

    Hotels

    Manufacturing Plants

    APAC Water Softening Systems Market by Regional Type

    China

    India

    Japan

    South Korea

    Malaysia

    Thailand

    Indonesia

    Rest of APAC

    CHINA Outlook (USD Billion, 2019-2035)

    CHINA Water Softening Systems Market by Application Type

    Residential

    Commercial

    Industrial

    CHINA Water Softening Systems Market by Technology Type

    Ion Exchange

    Salt-Free Water Softening

    Reverse Osmosis

    CHINA Water Softening Systems Market by Mechanism Type

    Single Tank

    Dual Tank

    Single Tank with Filter

    CHINA Water Softening Systems Market by End Use Type

    Households

    Hotels

    Manufacturing Plants

    INDIA Outlook (USD Billion, 2019-2035)

    INDIA Water Softening Systems Market by Application Type

    Residential

    Commercial

    Industrial

    INDIA Water Softening Systems Market by Technology Type

    Ion Exchange

    Salt-Free Water Softening

    Reverse Osmosis

    INDIA Water Softening Systems Market by Mechanism Type

    Single Tank

    Dual Tank

    Single Tank with Filter

    INDIA Water Softening Systems Market by End Use Type

    Households

    Hotels

    Manufacturing Plants

    JAPAN Outlook (USD Billion, 2019-2035)

    JAPAN Water Softening Systems Market by Application Type

    Residential

    Commercial

    Industrial

    JAPAN Water Softening Systems Market by Technology Type

    Ion Exchange

    Salt-Free Water Softening

    Reverse Osmosis

    JAPAN Water Softening Systems Market by Mechanism Type

    Single Tank

    Dual Tank

    Single Tank with Filter

    JAPAN Water Softening Systems Market by End Use Type

    Households

    Hotels

    Manufacturing Plants

    SOUTH KOREA Outlook (USD Billion, 2019-2035)

    SOUTH KOREA Water Softening Systems Market by Application Type

    Residential

    Commercial

    Industrial

    SOUTH KOREA Water Softening Systems Market by Technology Type

    Ion Exchange

    Salt-Free Water Softening

    Reverse Osmosis

    SOUTH KOREA Water Softening Systems Market by Mechanism Type

    Single Tank

    Dual Tank

    Single Tank with Filter

    SOUTH KOREA Water Softening Systems Market by End Use Type

    Households

    Hotels

    Manufacturing Plants

    MALAYSIA Outlook (USD Billion, 2019-2035)

    MALAYSIA Water Softening Systems Market by Application Type

    Residential

    Commercial

    Industrial

    MALAYSIA Water Softening Systems Market by Technology Type

    Ion Exchange

    Salt-Free Water Softening

    Reverse Osmosis

    MALAYSIA Water Softening Systems Market by Mechanism Type

    Single Tank

    Dual Tank

    Single Tank with Filter

    MALAYSIA Water Softening Systems Market by End Use Type

    Households

    Hotels

    Manufacturing Plants

    THAILAND Outlook (USD Billion, 2019-2035)

    THAILAND Water Softening Systems Market by Application Type

    Residential

    Commercial

    Industrial

    THAILAND Water Softening Systems Market by Technology Type

    Ion Exchange

    Salt-Free Water Softening

    Reverse Osmosis

    THAILAND Water Softening Systems Market by Mechanism Type

    Single Tank

    Dual Tank

    Single Tank with Filter

    THAILAND Water Softening Systems Market by End Use Type

    Households

    Hotels

    Manufacturing Plants

    INDONESIA Outlook (USD Billion, 2019-2035)

    INDONESIA Water Softening Systems Market by Application Type

    Residential

    Commercial

    Industrial

    INDONESIA Water Softening Systems Market by Technology Type

    Ion Exchange

    Salt-Free Water Softening

    Reverse Osmosis

    INDONESIA Water Softening Systems Market by Mechanism Type

    Single Tank

    Dual Tank

    Single Tank with Filter

    INDONESIA Water Softening Systems Market by End Use Type

    Households

    Hotels

    Manufacturing Plants

    REST OF APAC Outlook (USD Billion, 2019-2035)

    REST OF APAC Water Softening Systems Market by Application Type

    Residential

    Commercial

    Industrial

    REST OF APAC Water Softening Systems Market by Technology Type

    Ion Exchange

    Salt-Free Water Softening

    Reverse Osmosis

    REST OF APAC Water Softening Systems Market by Mechanism Type

    Single Tank

    Dual Tank

    Single Tank with Filter

    REST OF APAC Water Softening Systems Market by End Use Type

    Households

    Hotels

    Manufacturing Plants

    South America Outlook (USD Billion, 2019-2035)

    South America Water Softening Systems Market by Application Type

    Residential

    Commercial

    Industrial

    South America Water Softening Systems Market by Technology Type

    Ion Exchange

    Salt-Free Water Softening

    Reverse Osmosis

    South America Water Softening Systems Market by Mechanism Type

    Single Tank

    Dual Tank

    Single Tank with Filter

    South America Water Softening Systems Market by End Use Type

    Households

    Hotels

    Manufacturing Plants

    South America Water Softening Systems Market by Regional Type

    Brazil

    Mexico

    Argentina

    Rest of South America

    BRAZIL Outlook (USD Billion, 2019-2035)

    BRAZIL Water Softening Systems Market by Application Type

    Residential

    Commercial

    Industrial

    BRAZIL Water Softening Systems Market by Technology Type

    Ion Exchange

    Salt-Free Water Softening

    Reverse Osmosis

    BRAZIL Water Softening Systems Market by Mechanism Type

    Single Tank

    Dual Tank

    Single Tank with Filter

    BRAZIL Water Softening Systems Market by End Use Type

    Households

    Hotels

    Manufacturing Plants

    MEXICO Outlook (USD Billion, 2019-2035)

    MEXICO Water Softening Systems Market by Application Type

    Residential

    Commercial

    Industrial

    MEXICO Water Softening Systems Market by Technology Type

    Ion Exchange

    Salt-Free Water Softening

    Reverse Osmosis

    MEXICO Water Softening Systems Market by Mechanism Type

    Single Tank

    Dual Tank

    Single Tank with Filter

    MEXICO Water Softening Systems Market by End Use Type

    Households

    Hotels

    Manufacturing Plants

    ARGENTINA Outlook (USD Billion, 2019-2035)

    ARGENTINA Water Softening Systems Market by Application Type

    Residential

    Commercial

    Industrial

    ARGENTINA Water Softening Systems Market by Technology Type

    Ion Exchange

    Salt-Free Water Softening

    Reverse Osmosis

    ARGENTINA Water Softening Systems Market by Mechanism Type

    Single Tank

    Dual Tank

    Single Tank with Filter

    ARGENTINA Water Softening Systems Market by End Use Type

    Households

    Hotels

    Manufacturing Plants

    REST OF SOUTH AMERICA Outlook (USD Billion, 2019-2035)

    REST OF SOUTH AMERICA Water Softening Systems Market by Application Type

    Residential

    Commercial

    Industrial

    REST OF SOUTH AMERICA Water Softening Systems Market by Technology Type

    Ion Exchange

    Salt-Free Water Softening

    Reverse Osmosis

    REST OF SOUTH AMERICA Water Softening Systems Market by Mechanism Type

    Single Tank

    Dual Tank

    Single Tank with Filter

    REST OF SOUTH AMERICA Water Softening Systems Market by End Use Type

    Households

    Hotels

    Manufacturing Plants

    MEA Outlook (USD Billion, 2019-2035)

    MEA Water Softening Systems Market by Application Type

    Residential

    Commercial

    Industrial

    MEA Water Softening Systems Market by Technology Type

    Ion Exchange

    Salt-Free Water Softening

    Reverse Osmosis

    MEA Water Softening Systems Market by Mechanism Type

    Single Tank

    Dual Tank

    Single Tank with Filter

    MEA Water Softening Systems Market by End Use Type

    Households

    Hotels

    Manufacturing Plants

    MEA Water Softening Systems Market by Regional Type

    GCC Countries

    South Africa

    Rest of MEA

    GCC COUNTRIES Outlook (USD Billion, 2019-2035)

    GCC COUNTRIES Water Softening Systems Market by Application Type

    Residential

    Commercial

    Industrial

    GCC COUNTRIES Water Softening Systems Market by Technology Type

    Ion Exchange

    Salt-Free Water Softening

    Reverse Osmosis

    GCC COUNTRIES Water Softening Systems Market by Mechanism Type

    Single Tank

    Dual Tank

    Single Tank with Filter

    GCC COUNTRIES Water Softening Systems Market by End Use Type

    Households

    Hotels

    Manufacturing Plants

    SOUTH AFRICA Outlook (USD Billion, 2019-2035)

    SOUTH AFRICA Water Softening Systems Market by Application Type

    Residential

    Commercial

    Industrial

    SOUTH AFRICA Water Softening Systems Market by Technology Type

    Ion Exchange

    Salt-Free Water Softening

    Reverse Osmosis

    SOUTH AFRICA Water Softening Systems Market by Mechanism Type

    Single Tank

    Dual Tank

    Single Tank with Filter

    SOUTH AFRICA Water Softening Systems Market by End Use Type

    Households

    Hotels

    Manufacturing Plants

    REST OF MEA Outlook (USD Billion, 2019-2035)

    REST OF MEA Water Softening Systems Market by Application Type

    Residential

    Commercial

    Industrial

    REST OF MEA Water Softening Systems Market by Technology Type

    Ion Exchange

    Salt-Free Water Softening

    Reverse Osmosis

    REST OF MEA Water Softening Systems Market by Mechanism Type

    Single Tank

    Dual Tank

    Single Tank with Filter

    REST OF MEA Water Softening Systems Market by End Use Type

    Households

    Hotels

    Manufacturing Plants


    Infographic

    Free Sample Request

    Kindly complete the form below to receive a free sample of this Report

    Get Free Sample

    Customer Strories

    “I am very pleased with how market segments have been defined in a relevant way for my purposes (such as "Portable Freezers & refrigerators" and "last-mile"). In general the report is well structured. Thanks very much for your efforts.”

    Victoria Milne

    Founder
    Case Study
    Chemicals and Materials