3D Cell Culture Market (2026 - 2035)

3D Cell Culture Market Research Report: Size, Share, Trend Analysis By Applications (Drug Discovery, Toxicology Testing, Regenerative Medicine, Cancer Research), By Technique (Spheroid Culture, Organ-on-a-Chip, Microfluidics, Bioreactor Systems), By End Use (Pharmaceutical Companies, Biotechnology Companies, Academic Research Institutes, CROs), By Product (Reagents, Instruments, Services) and By Regional (North America, Europe, South America, Asia Pacific, Middle East and Africa) - Growth Outlook & Industry Forecast 2025 To 2035

Forecast Period
2026-2035
CAGR
14.2%
2025 Market Size
USD 2.19 Billion
2035 Market Size
USD 8.26 Billion
Healthcare ● Updated August 24, 2026 Report ID: MRFR/HC/4472-CR | Pages: 200 | Author: Rahul Gotadki, Satyendra Maurya

3D Cell Culture Market Summary

The 3D Cell Culture Market closed 2025 at USD 2.19 billion and enters its forecast window at USD 2.50 billion in 2026, climbing to USD 8.26 billion by 2035 at a 14.2% CAGR. Two catalysts explain the acceleration. The FDA Modernization Act 2.0, signed in December 2022, removed the statutory requirement for animal testing in new drug applications, and the agency's Roadmap to Reducing Animal Testing, published in April 2025, formalized organ-on-chip and organoid data as acceptable evidence [1][2]. Capital followed policy: NIH committed roughly USD 95 million across its Complement Animal Research In Experimentation initiative in FY2025 alone [3].

Laboratories are retiring two-dimensional monolayer plates and Transwell inserts at a pace few forecast five years ago. Flat plastic simply cannot reproduce oxygen gradients, matrix stiffness, or paracrine signalling, and pharmaceutical R&D leaders have grown tired of Phase II failures traced to unrepresentative preclinical data. Ultra-low-attachment plates, hydrogel matrices, magnetic levitation systems and perfused microfluidic chips now occupy bench space once reserved for flasks. Horizon Europe allocated EUR 34 million to non-animal methodology clusters between 2023 and 2025, reinforcing the shift on the European side [4].

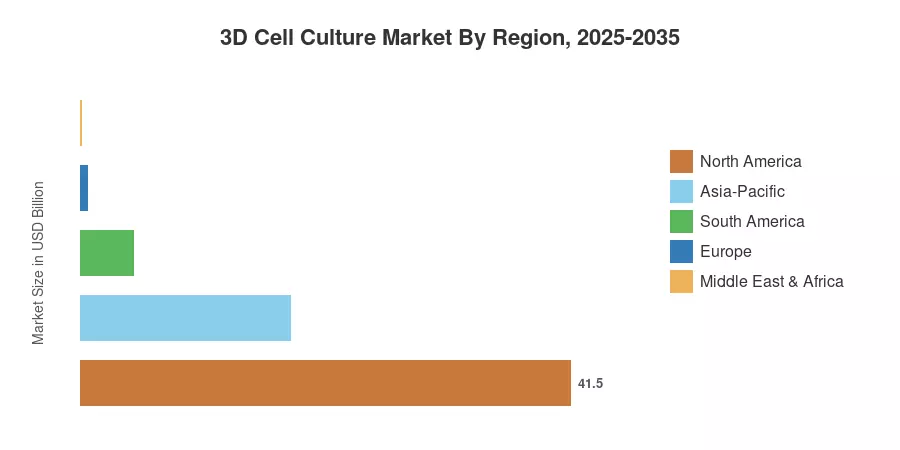
North America holds 41.5% of global revenue, anchored by an unusually dense cluster of biotech buyers in Boston and the Bay Area. Asia-Pacific grows fastest at a 17.8% CAGR, propelled by China's expanding CRO base and India's biosimilar pipeline. Europe follows North America at 27.0% share, where regulatory momentum rather than raw R&D spending sets the pace. The decade ahead belongs to platforms that pair biological fidelity with automation-ready throughput.


Key Report Takeaways

• By Technology

  • Scaffold-Based Platforms retain the largest technology position in the 3D Cell Culture Market at 39.2% revenue share in 2025
  • Microfluidics-Based Organ-On-Chip Systems post the steepest technology CAGR at 19.4% through 2035
  • Scaffold-Free Platforms generated USD 0.61 billion in 2025 revenue

• By Application


  • Cancer Research & Oncology Drug Screening commands 36.8% of application revenue.
  • Regenerative Medicine & Tissue Engineering expands at an 18.1% CAGR, the fastest application track in the 3D Cell Culture Market.


• By Region

  • North America leads with 41.5% global share
  • Asia-Pacific delivers a 17.8% regional CAGR
  • Europe contributed USD 0.59 billion in 2025


Market Size and Forecast (2021–2035)

Figures below blend bottom-up vendor revenue mapping across roughly 140 suppliers with top-down validation against pharmaceutical R&D budgets, published grant disbursements, and customs data on consumables. Historical years reflect audited disclosures where available; forecast years apply demand elasticity modelling calibrated to the 3D Cell Culture Market's installed instrument base and consumable reorder cycles.
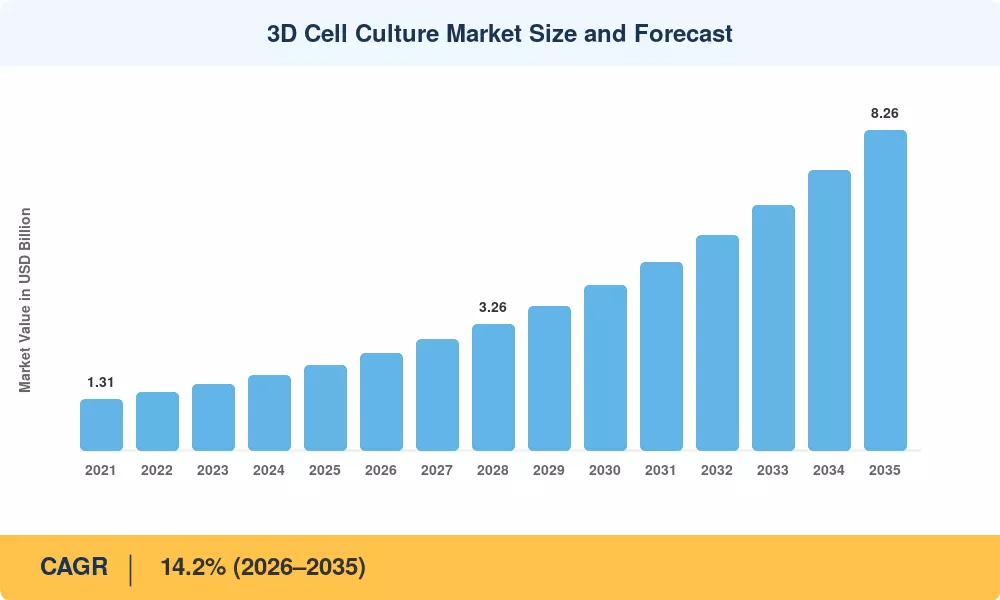
3D Cell Culture Market Size and Forecast
Our Impact
Enabled $4.3B Revenue Impact for Fortune 500 and Leading Multinationals
Partnering with 2000+ Global Organizations Each Year
30K+ Citations by Top-Tier Firms in the Industry

Driver Impact Analysis

Driver ~% Impact on CAGR Geographic Relevance Impact Timeline
Regulatory acceptance of non-animal data 3.4 Global Medium-term (2–4 yr)
Oncology drug attrition costs 2.9 North America, Europe Short-term (≤2 yr)
Public research funding expansion 2.2 North America, Europe Medium-term (2–4 yr)
Laboratory automation compatibility 1.8 Global Medium-term (2–4 yr)
Regenerative medicine pipeline growth 1.6 Asia-Pacific, North America Long-term (≥4 yr)
CRO outsourcing penetration 1.4 Asia-Pacific Short-term (≤2 yr)
Patient-derived model biobanking 1.1 Europe, North America Long-term (≥4 yr)


Regulatory Acceptance of Non-Animal Evidence

Sponsors no longer face a statutory animal-testing mandate in the United States. The FDA's April 2025 roadmap named organ-on-chip and organoid data among qualifying alternatives for monoclonal antibody programs, and the agency signalled that certain animal studies could become the exception rather than the default within three to five years [2]. Europe moved in parallel: the European Commission's 2023 response to the "Save Cruelty-Free Cosmetics" initiative committed to a roadmap phasing out animal testing in chemical safety assessment [4]. Procurement teams read these signals as permission to capitalize equipment they had previously treated as discretionary.

The Economics of Late-Stage Attrition

Roughly 90% of drug candidates entering clinical trials fail, and Tufts CSDD places capitalized cost per approved therapy near USD 2.6 billion [8]. Oncology fares worst. A single avoided Phase II failure funds several years of platform spending, which is why cancer programs became the earliest adopters and still anchor the 3D Cell Culture Market's revenue base.

Public Funding as Demand Floor

NIH's CARE initiative directed approximately USD 95 million in FY2025 toward human-based research models, while NC3Rs in the United Kingdom disbursed roughly GBP 11 million across its 2024 grant rounds [3][11]. Grant money buys instruments and consumables directly, insulating academic demand from pharmaceutical budget cycles.

Automation Compatibility

Adoption stalled for years because spheroids resisted standard liquid handling. SBS-footprint plates, automated imaging with confocal z-stacking, and robotic media exchange resolved much of that friction. Vendors reporting automation-ready SKUs grew consumable attach rates by an estimated 22% between 2023 and 2025 [9].


Restraints Impact Analysis

Restraint impacts are directional drag estimates. They describe growth suppressed relative to an unconstrained scenario and do not subtract linearly from the reported CAGR of the 3D Cell Culture Market.

Restraint ~% Drag on CAGR Geographic Relevance Impact Timeline
Assay reproducibility and standardization gaps -2.6 Global Medium-term (2–4 yr)
Cost per data point versus 2D methods -2.1 Asia-Pacific, South America Short-term (≤2 yr)
Extracellular matrix supply variability -1.5 Global Medium-term (2–4 yr)
Skilled operator shortage -1.2 Middle East & Africa, South America Long-term (≥4 yr)
Fragmented regulatory qualification pathways -0.9 Europe, Asia-Pacific Long-term (≥4 yr)


Reproducibility Remains the Gating Problem

Lot-to-lot variability in animal-derived basement membrane extracts produces coefficient-of-variation figures that routinely exceed 25% across laboratories, compared with under 10% for validated monolayer assays [12]. Regulators want qualification packages; qualification requires reproducibility; reproducibility requires defined synthetic matrices that cost more and behave differently. Several sponsors have paused platform standardization pending clearer ISO and ASTM guidance.

Cost per Data Point

Consumables for a perfused chip run land between four and nine times the cost of an equivalent plate-based screen [13]. Budget-constrained academic groups in emerging economies default to hybrid workflows, screening broadly in 2D and confirming narrowly in 3D. That behaviour caps unit volumes even where scientific enthusiasm runs high.

Talent Scarcity

Operating microphysiological systems demands fluidics literacy, imaging analysis skills, and tissue-handling experience rarely bundled in one hire. Survey data suggests median time-to-fill for such roles exceeds five months in Europe and North America [15].


3D Cell Culture Market Opportunities

Patient-Derived Tumor Avatars for Treatment Selection

Patient-derived organoids are being used in clinical laboratories to predict response to chemotherapy prior to treatment, and demonstrate concordance rates above 80% in colorectal cohorts [6]. The problem isn’t biology. It’s reimbursement. When a CPT pathway is opened, functional precision oncology takes a research assay and makes it a diagnostic line item.


Emerging-Market Localization

Both the Department of Biotechnology in India and the provincial science funding in China have targeted indigenous bioreagent capability. Local fabrication of hydrogels and low-attachment plasticware might reduce delivered cost by 30-40% across Asia-Pacific and unlock South American academic demand now priced out.


Data Monetization and Model-as-a-Service

Vendors with thousands of annotated organoid drug-response curves in their pockets are packaging them as subscription datasets for computational pharmacology teams. Recurring data sales have software-like margins and eliminate reliance on instrument replacement cycles.


Regulatory Qualification Consortia

A liver or cardiac chip qualified by a pre-competitive consortium is co-funded, so the multi-million dollar burden is shared among sponsors. Such activities are already coordinated by the working groups of the IQ Consortium, and the initial qualifications would allow wider procurement [16].


Automated Organoid Foundries

Contract research organizations building fully automated organoid production suites can serve mid-cap biotechs lacking internal capability. Capacity leasing converts capital expenditure into a service margin.


3D Cell Culture Market Future Outlook

Computational Pairing

Machine learning models trained on high-content imaging of organoids are beginning to outperform human scorers on morphological endpoints. Vendors that ship analysis software alongside hardware will capture disproportionate value, because the bottleneck has shifted from generating three-dimensional biology to interpreting it at scale [9].

Consumable-Led Platform Economics

Instrument margins compress as competition intensifies; consumables and matrices do not. Expect the revenue mix within the 3D Cell Culture Market to tilt toward recurring reagent sales, mirroring the razor-and-blade transition that reshaped flow cytometry and sequencing over the previous decade.

Regulatory Convergence

FDA, EMA, and PMDA participation in ICH discussions on non-animal methods suggests eventual mutual recognition of qualification data. Convergence would remove duplicate validation spending, which sponsors currently estimate at 30–40% of total qualification cost [16][18].

Manufacturing Rather Than Research

Regenerative medicine shifts the buyer profile from principal investigators to process engineers. Cell therapy manufacturing requires GMP-grade scaffolds and closed bioreactor systems at volumes research budgets never demanded, and the global cell and gene therapy pipeline exceeded 2,000 active programs entering 2025 [10].


3D Cell Culture Market Segmentation

By Technology

Technology adoption within the 3D Cell Culture Market splits between mature scaffold chemistry and emerging microfluidic engineering.

Segment Metric Primary Demand Driver
Scaffold-Based Platforms 39.2% share Hydrogel versatility across applications
Scaffold-Free Platforms USD 0.61 Billion (2025) Rapid spheroid formation, low setup cost
Microfluidics-Based Organ-On-Chip Systems 19.4% CAGR Regulatory qualification programs
Bioreactors 12.8% share Scale-up for therapeutic manufacturing
Bioprinting 18.6% CAGR Vascularized construct research
Others 4.1% share Magnetic levitation, hanging drop


Scaffold-based systems dominate because they are forgiving. Researchers can vary stiffness, porosity, and ligand density without redesigning workflows, and hydrogel formats slot into existing plate readers. The segment's challenge is matrix consistency rather than adoption. Organ-on-chip platforms grow fastest from a smaller base, and their trajectory depends almost entirely on whether qualification packages clear regulatory review within the next four years.

By Application

Application mix in the 3D Cell Culture Market has broadened well beyond its oncology origins.

Segment Metric Primary Demand Driver
Cancer Research & Oncology Drug Screening 36.8% share Tumor microenvironment fidelity
Drug Discovery & Toxicology USD 0.54 Billion (2025) Hepatotoxicity and cardiotoxicity screening
Regenerative Medicine & Tissue Engineering 18.1% CAGR Cell therapy pipeline expansion
Stem Cell Research 14.9% share Differentiation protocol development
Others 6.3% share Infectious disease and developmental biology


Oncology retains the largest share because tumor spheroids reproduce hypoxic cores and drug-penetration gradients that flat culture cannot. Toxicology is the more interesting growth story: liver and cardiac models directly address the two organ systems responsible for most late-stage safety failures, and organoid culture systems have proven particularly effective at detecting idiosyncratic hepatotoxicity that animal models miss [12].

By End User

Buyer composition shapes pricing and service expectations across the 3D Cell Culture Market.

Segment Metric Primary Demand Driver
Biotechnology & Pharmaceutical Companies USD 1.05 Billion (2025) Pipeline de-risking
Academic & Research Institutes 27.4% share Grant-funded methodology research
Contract Research Organizations 16.7% CAGR Outsourced preclinical demand
Hospitals & Diagnostic Labs 8.2% share Functional precision oncology pilots
Others 3.9% share Government and cosmetics testing labs


Pharmaceutical buyers purchase in validated, standardized volumes and demand documentation. Academic buyers purchase in small, exploratory lots and drive protocol innovation. Contract research organizations sit between the two and grow fastest, because outsourcing lets mid-cap sponsors access capability without capital commitment.


Regional Market Share Analysis

Region Metric Primary Investment Themes
North America 41.5% share Regulatory acceptance, oncology screening, automation retrofits
Europe USD 0.59 Billion (2025) Animal-methods phase-down, academic consortia, matrix standardization
Asia-Pacific 17.8% CAGR CRO capacity, domestic reagent manufacturing, biosimilars
South America 4.5% share Academic modernization, public health research grants
Middle East & Africa USD 0.08 Billion (2025) Sovereign biotech funds, hospital research infrastructure
Total 100% / USD 2.19 Billion

Regional performance in the 3D Cell Culture Market tracks regulatory posture more tightly than it tracks GDP. Markets where agencies have published explicit acceptance criteria convert scientific interest into purchase orders far faster than markets where sponsors must guess.


North America

Country Metric Key Driver
US 86.4% of region FDA roadmap and NIH funding
Canada USD 0.08 Billion Genome Canada organoid programs
Mexico 14.6% CAGR Contract manufacturing expansion


United States demand concentrates in roughly 40 metropolitan research clusters, with Massachusetts and California together representing an estimated 44% of national spending. The FDA's Innovative Science and Technology Approaches for New Drugs program has accepted multiple microphysiological system submissions since 2023, giving sponsors documented precedent [2][17]. Canada's contribution runs through publicly funded biobanks rather than industry. Mexico's growth reflects nearshored preclinical services rather than domestic pharmaceutical R&D.

Europe

Country Metric Key Driver
Germany 24.1% of region Fraunhofer and Max Planck platform programs
UK USD 0.12 Billion NC3Rs grant funding
France 13.6% of region Inserm translational oncology
Italy 15.9% CAGR Regional bioeconomy clusters
Spain 7.4% of region CNIO cancer model biobanks
Nordic Countries 16.8% CAGR Precision medicine initiatives
Russia 2.1% of region Domestic pharmaceutical substitution
Rest of Europe USD 0.07 Billion EU structural research funds


European buyers face a standardization-first culture that slows initial adoption but produces durable installed bases. The European Partnership for Alternative Approaches to Animal Testing coordinates validation work across member states, and EURL ECVAM's inventory of non-animal methods now catalogues several hundred entries relevant to toxicology [4][18]. Germany leads on instrumentation depth; the United Kingdom leads on grant-funded academic volume.

Asia-Pacific

Country Metric Key Driver
China 38.7% of region CRO scale and provincial biotech funds
India 19.2% CAGR Biosimilar development pipeline
Japan 21.4% of region PMDA engagement on alternative methods
South Korea USD 0.06 Billion Regenerative medicine legislation
ASEAN 16.1% CAGR Singapore and Malaysia research hubs
Rest of Asia-Pacific 5.8% of region Australian academic demand


China's contract research sector buys at volumes that reshape vendor pricing globally, and NMPA has begun accepting supplementary organoid data in oncology filings [19]. Japan's Act on the Safety of Regenerative Medicine created an early legal scaffold for cell-based products, pulling three-dimensional cell models into commercial tissue engineering rather than research alone. India's growth is cost-driven: domestic firms adopt where the assay materially de-risks a biosimilar comparability package.

South America

Country Metric Key Driver
Brazil 62.3% of region FAPESP and CNPq research grants
Argentina 18.7% of region CONICET oncology programs
Rest of South America 15.3% CAGR Chilean and Colombian university expansion


Brazilian universities anchor regional demand, with São Paulo state funding agencies underwriting most instrument purchases. Currency volatility and import duties on laboratory consumables inflate delivered cost by an estimated 25–35%, which explains why the region trails despite genuine scientific capability [20]. Regional distributors increasingly bundle service contracts to justify premiums.

Middle East & Africa

Country Metric Key Driver
Saudi Arabia 31.2% of region Vision 2030 biotech localization
UAE USD 0.02 Billion Hospital-based translational research
South Africa 18.4% of region Infectious disease research infrastructure
Egypt 15.9% CAGR University research capacity building
Rest of MEA 12.7% of region Sovereign health investment


Saudi Arabia's National Biotechnology Strategy targets a domestic sector worth SAR 130 billion by 2040, and early spending has flowed into research infrastructure at KAUST and King Faisal Specialist Hospital [21]. UAE demand centres on clinical translation rather than discovery. South African groups apply the technology to tuberculosis and HIV host-pathogen work, a use case with different procurement economics than oncology screening.


3D Cell Culture Market By Region, 2025-2035

Competitive Benchmarking

Concentration in the 3D Cell Culture Market sits in the medium band. Estimated HHI falls near 810, with the top five suppliers holding roughly 44–49% of global revenue. Large life-science conglomerates control consumables and plasticware, while specialist firms dominate microphysiological systems. That split creates persistent acquisition pressure, since the incumbents want the technology and the specialists want the distribution.

Company Est. Revenue Share Range Key Offerings for 3D Cell Culture Market Strategic Positioning
Thermo Fisher Scientific ~12–15% Nunclon Sphera plates, Gibco matrices, imaging systems Breadth leader with full workflow coverage
Corning Incorporated ~10–13% Matrigel matrix, spheroid microplates, Elplasia Matrix franchise anchors consumable stream
Merck KGaA ~7–10% Millicell inserts, hydrogel reagents, media Reagent depth with strong European base
Lonza Group ~6–8% Primary cells, RAFT 3D system, bioreactors Bridges research and GMP manufacturing
Danaher (Molecular Devices) ~5–7% Organoid Innovation Center, ImageXpress imaging Automation-plus-analytics integration
Becton Dickinson ~4–6% Cell culture inserts, flow-based characterization Instrument installed base leverage
Avantor ~3–5% Scaffolds, sera, custom bioprocess reagents Distribution reach into mid-market labs
Tecan (InSphero) ~2–4% 3D InSight liver and islet microtissues Assay-ready microtissue specialist
CN Bio Innovations ~1–3% PhysioMimix organ-on-chip systems Regulatory qualification frontrunner
Emulate Inc. ~1–3% Organ-Chips, Zoë culture module FDA collaboration credibility
Greiner Bio-One ~1–3% Cellstar low-attachment plasticware Cost-competitive consumables
REPROCELL ~1–2% Alvetex scaffolds, patient-derived models Niche translational focus


Recent News & Developments

  • US FDA (April 2025): Published its Roadmap to Reducing Animal Testing in Preclinical Safety Studies, naming organ-on-chip and organoid approaches as qualifying alternatives for monoclonal antibody development [2].
  • NIH (September 2024): Launched the Complement Animal Research In Experimentation initiative, directing roughly USD 95 million in FY2025 toward human-based model development [3].
  • Danaher / Molecular Devices (June 2024): Expanded its Organoid Innovation Center network with a European site, adding automated organoid culture and screening capacity for pharmaceutical partners [9].
  • CN Bio Innovations (March 2024): Reported multi-organ PhysioMimix data supporting a regulatory qualification submission, a first for a UK-based microphysiological system developer [16].
  • Thermo Fisher Scientific (November 2023): Broadened its Nunclon Sphera portfolio with automation-compatible formats targeting high-throughput spheroid workflows [22].
  • Merck KGaA (February 2024): Signed a co-development agreement with an academic consortium on animal-origin-free matrix chemistry to address lot-variability complaints [14].
  • Lonza Group (August 2025): Announced capacity expansion for GMP-grade primary cells and scaffolds supporting cell therapy manufacturing clients in Asia-Pacific [10].
  • European Commission (July 2023): Committed to a roadmap phasing out animal testing in chemical safety assessment, formalizing demand for validated alternative methods [4].


3D Cell Culture Market Report Scope

Parameter Detail
Market Scope Global 3D Cell Culture Market covering technology, application, end user, and geography
Study Period 2021–2035 (Historical 2021–2024; Base Year 2025; Forecast 2026–2035)
CAGR 14.2% (2026–2035)
Market Size Checkpoints USD 2.19 Billion (2025); USD 2.50 Billion (2026); USD 8.26 Billion (2035)
Fastest Growing Segments Microfluidics-Based Organ-On-Chip Systems (Technology); Regenerative Medicine & Tissue Engineering (Application); Contract Research Organizations (End User)
Companies Profiled 12 leading suppliers with competitive benchmarking
Valuation Currency USD, constant 2025 prices

FAQs

How should procurement teams evaluate total cost of ownership before entering the 3D Cell Culture Market?
Weight consumables and matrix lots at roughly 70% of five-year spend, not the instrument. Demand lot-reservation clauses in supply agreements, since matrix variability drives more hidden cost than list price does [13].
What contractual protections matter most when licensing patient-derived models?
Secure clear downstream commercialization rights and consent provenance documentation upfront. Biobank agreements frequently restrict for-profit use, and retroactive renegotiation after a hit compound emerges is expensive [6].
Which technology comparison decides most vendor selections in the 3D Cell Culture Market?
Static spheroid formats versus perfused chips. Static wins on throughput and cost; perfused wins on physiological relevance and regulatory credibility. Screening cascades typically deploy both rather than choosing one [16].
What integration challenge derails deployments most often?
Imaging and analysis, not culture. Existing plate readers cannot resolve z-axis structure, so laboratories discover mid-project that confocal upgrades and analysis software double the intended budget [9].
How do investors assess competitive moats in the 3D Cell Culture Market?
Defensibility rests on validated protocols and installed consumable lock-in, rarely on hardware patents. Companies with regulatory qualification progress command materially higher multiples than instrument-only vendors [16].
What regulatory nuance surprises first-time adopters?
Acceptance is program-specific, not blanket. Agencies review alternative-method data case by case within individual submissions, so sponsors must still justify model choice for each indication [2].
Which emerging use case deserves attention beyond drug discovery?
Cultivated meat and agricultural biotechnology. Both require scaffolds and bioreactor scale-up at volumes exceeding pharmaceutical demand, and several suppliers now report food-sector revenue separately [10].      
Author
Author
Author Profile
Rahul Gotadki LinkedIn
Research Manager
He holds an experience of about 9+ years in Market Research and Business Consulting, working under the spectrum of Life Sciences and Healthcare domains. Rahul conceptualizes and implements a scalable business strategy and provides strategic leadership to the clients. His expertise lies in market estimation, competitive intelligence, pipeline analysis, customer assessment, etc.
Co-Author
Co-Author Profile
Satyendra Maurya LinkedIn
Research Analyst
An accomplished research analyst with high proficiency in market forecasting, data visualization, competitive benchmarking, and others. He holds a pronounced track record in research and consulting projects for sectors such as life sciences, medical devices, and healthcare IT. His capabilities in qualitative and quantitative analysis have resulted in positive client outcomes. Working on niche market trends, opportunities, sales, and forecasted value is part of his skill set.
Share::
Request Free Sample

Research Approach


Secondary Research

The secondary research process involved comprehensive analysis of regulatory databases, peer-reviewed biomedical journals, clinical publications, and authoritative life sciences organizations. Key sources included the US Food & Drug Administration (FDA), European Medicines Agency (EMA), National Institutes of Health (NIH), National Center for Biotechnology Information (NCBI/PubMed), International Organization for Standardization (ISO), Organisation for Economic Co-operation and Development (OECD), National Institute of Standards and Technology (NIST), Environmental Protection Agency (EPA), American Association for Cancer Research (AACR), International Society for Cell & Gene Therapy (ISCT), European Society for Clinical Cell Analysis (ESCCA), World Health Organization (WHO) Global Health Observatory, Centers for Disease Control and Prevention (CDC) National Center for Health Statistics, Biotechnology Innovation Organization (BIO), and national biotechnology regulatory authorities including China's National Medical Products Administration (NMPA) and Japan's Pharmaceuticals and Medical Devices Agency (PMDA). These sources were used to collect procedure statistics, regulatory approval data for organ-on-a-chip and 3D spheroid models, clinical validation studies, NIH funding allocation patterns for 3D cell culture initiatives, patent landscapes, toxicity testing standards, and market landscape analysis for scaffold-based technologies, bioreactor systems, microfluidic platforms, and emerging regenerative medicine applications.


Primary Research

Qualitative and quantitative insights were obtained by interviewing supply-side and demand-side stakeholders during the primary research process. The supply-side sources consist of CEOs, VPs of Research & Development, Chief Scientific Officers, regulatory affairs chiefs, and commercial directors from 3D cell culture technology manufacturers, bioreactor system developers, scaffold material suppliers, and organ-on-a-chip platform providers. Chief Scientific Officers at pharmaceutical companies, heads of translational research at biotechnology firms, principal investigators at academic medical centers, directors of cell biology at contract research organizations (CROs), and laboratory procurement managers from research hospitals and regenerative medicine institutes comprised demand-side sources. Market segmentation was validated across spheroid culture and organ-on-a-chip techniques, product development pipeline timelines were confirmed, and insights were gathered on clinical adoption patterns in immuno-oncology research, pricing strategies for high-throughput 3D screening platforms, and funding dynamics for bioprinting technologies through primary research.

Primary Respondent Breakdown:

By Designation: C-level Primaries (28%), Director Level (42%), Others (30%)

By Region: North America (40%), Europe (25%), Asia-Pacific (28%), Rest of World (7%)


Market Size Estimation

Global market valuation was derived through revenue mapping and technology adoption volume analysis. The methodology included:

Identification of 60+ key manufacturers and technology developers across North America, Europe, Asia-Pacific, and Latin America specializing in extracellular matrices, bioreactors, microfluidic devices, and scaffold technologies

Product mapping across hydrogel scaffolds, organ-on-a-chip platforms, spheroid microplates, 3D bioprinters, and supporting reagents/consumables

Analysis of reported and modeled annual revenues specific to 3D cell culture product portfolios and service offerings

Coverage of manufacturers and technology providers representing 75-80% of global market share in 2024

Extrapolation using bottom-up (laboratory adoption volume × ASP by country/region across pharma, biotech, and academic sectors) and top-down (manufacturer revenue validation and NIH/industry R&D spend allocation) approaches to derive segment-specific valuations for drug discovery, toxicology screening, and regenerative medicine applications

Share::
Request Free Sample
Download Free Sample

Kindly complete the form below to receive a free sample of this Report

* Please use a valid business email

Share::
Request Free Sample
Download PDF ×

We do not share your information with anyone. However, we may send you emails based on your report interest from time to time. You may contact us at any time to opt-out.
















