3D Gaming Console Market (2026 - 2035)

3D Gaming Console Market Size, Share and Research Report By Component (Hardware and Software), By Console Type (Home Consoles, Handheld Consoles, Micro Consoles, and Dedicated Consoles), By Platform (Sony PlayStation, Microsoft Xbox, and Nintendo Wii), And By Region (North America, Europe, Asia-Pacific, And Rest Of The World) – Industry Forecast Till 2035.
ID: MRFR/ICT/25589-HCR
100 Pages
Kiran Jinkalwad
Last Updated: August 24, 2026
3D Gaming Console Market
Market Size
Forecast Period2026-2035
CAGR (2026-2035)16.4%
2025 Market SizeUSD 5.18 Billion
2035 Market SizeUSD 23.65 Billion
Key Players
Sony Interactive Entertainment
Microsoft Gaming
Nintendo
Valve Corporation
Meta Platforms
NVIDIA
Opportunities
  • Emerging-Market Console Penetration
  • Subscription and Data-Driven Revenue Models
  • Haptic and Spatial-Audio Accessories

3D Gaming Console Market Summary

The global 3D gaming console market reached an estimated USD 5.18 billion in 2025 and is projected to grow from USD 6.03 billion in 2026 to USD 23.65 billion by 2035, registering a CAGR of 16.4% during the forecast period. This expansion reflects a gaming ecosystem that is shifting rapidly toward depth-rich, spatially immersive experiences. Sustained capital investment from platform holders — Sony committed over USD 2.4 billion to interactive entertainment R&D in fiscal 2024 alone — is accelerating the hardware refresh cycles that keep this 3D gaming console market on an upward trajectory [1].

A fundamental technology transition underpins the growth story. Legacy 2D-rendered console architectures are giving way to real-time ray-tracing engines, volumetric display modules, and custom silicon designed to deliver frame rates above 120 fps at 4K resolution. Microsoft's USD 1.7 billion investment in its custom AMD-based GPU pipeline for the Xbox line exemplifies the scale of this shift [2]. Eighth- and ninth-generation consoles now integrate Blu-ray drives, motion-sensor arrays, and VR-ready outputs as standard, and the upcoming tenth-generation hardware previewed at industry events signals even deeper 3D integration.

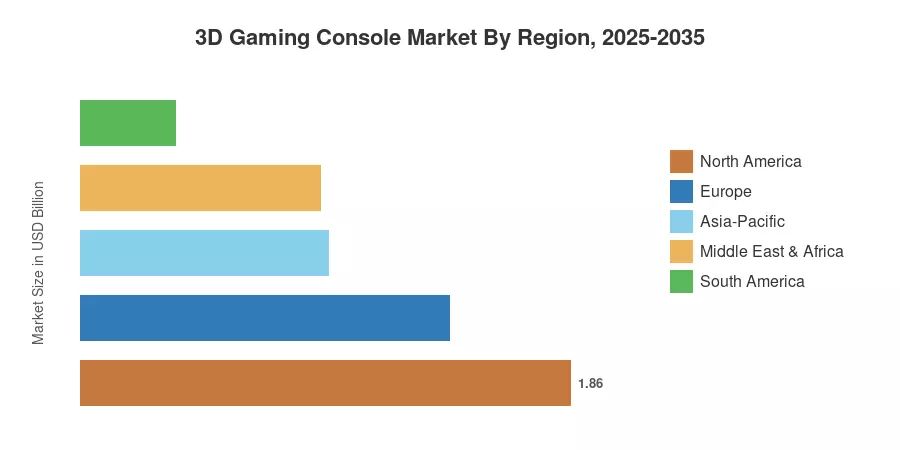
North America leads the 3D gaming console market with roughly 36% of global revenue, buoyed by high broadband penetration and strong digital storefront ecosystems. Asia-Pacific stands as the fastest-growing region, projected to expand at a CAGR above 18% through 2035 as console adoption accelerates across China, India, and Southeast Asia. Europe holds the second-largest share at approximately 27%, driven by mature gaming communities in Germany, the UK, and France. As cloud-gaming infrastructure and 5G roll-outs lower hardware entry barriers, the 3D gaming console market is positioned for broad-based global penetration through the next decade.


Key Report Takeaways

• By Component

  • Hardware remains the dominant component of the 3D gaming console market, accounting for an estimated 62% revenue share in 2025 — a position reinforced by premium pricing on next-generation consoles.
  • Software is the fastest-growing component with a projected CAGR of 18.3%, fueled by digital distribution, subscription services, and expanding 3D title libraries.

• By Console Type

  • Home consoles command approximately USD 3.22 billion in 2025 revenue, anchored by the PlayStation, Xbox, and Nintendo ecosystems.
  • Handheld consoles represent the quickest-expanding console category within the 3D gaming console market, reflecting strong demand for portable 3D gaming experiences.

• By Region

  • North America captures the largest share of the 3D gaming console market at roughly 36%, supported by early adoption cycles and robust digital retail infrastructure.
  • Asia-Pacific is growing at a CAGR exceeding 18%, with Japan and South Korea serving as design-and-manufacturing hubs while China and India drive volume.


Market Size and Forecast (2021–2035)

Market Research Future's sizing methodology combines bottom-up revenue modeling — aggregating console shipments, software attach rates, and accessory sales — with top-down cross-validation against publicly reported financials from Sony, Microsoft, and Nintendo. Historical figures are calibrated to fiscal-year disclosures; forecast values apply the calibrated CAGR of 16.4%.
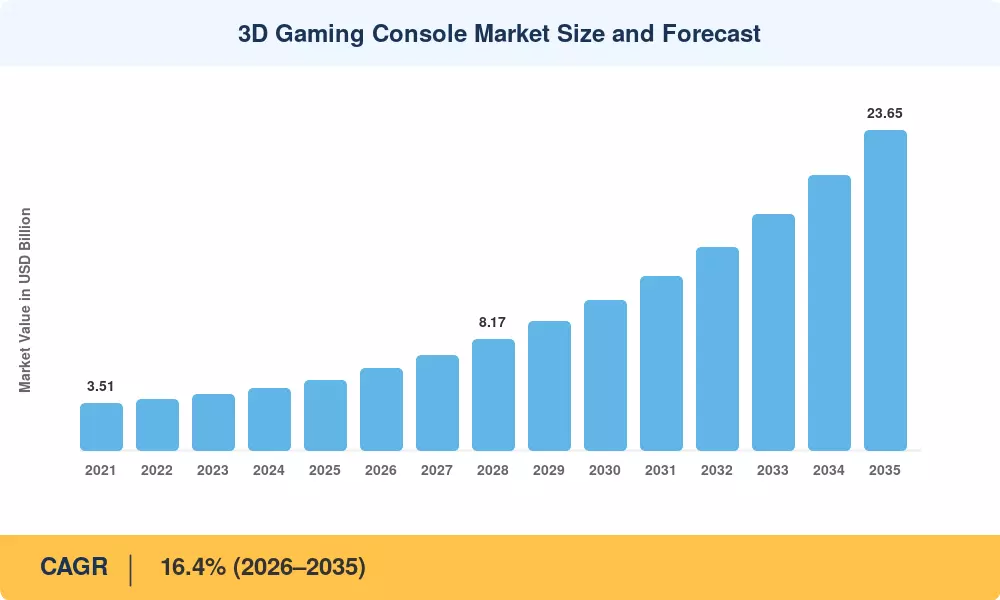
3D Gaming Console Market Size and Forecast
Our Impact
Enabled $4.3B Revenue Impact for Fortune 500 and Leading Multinationals
Partnering with 2000+ Global Organizations Each Year
30K+ Citations by Top-Tier Firms in the Industry

Driver Impact Analysis

Driver ~% Impact on CAGR Geographic Relevance Impact Timeline
Next-generation console launch cycles 25–30% Global Short-term (≤2 yr)
VR/AR integration into console platforms 15–20% North America, Asia-Pacific Medium-term (2–4 yr)
Cloud-gaming hybrid architectures 10–15% Global Medium-term (2–4 yr)
5G and broadband expansion 8–12% Asia-Pacific, South America Long-term (≥4 yr)
Digital storefront and subscription growth 10–14% North America, Europe Short-term (≤2 yr)
Rising gamer demographics globally 8–10% Asia-Pacific, MEA Long-term (≥4 yr)
Esports and competitive gaming ecosystem 5–8% Global Medium-term (2–4 yr)


Next-Generation Console Launch Cycles

Platform holders operate on roughly six- to seven-year hardware generations, and each new cycle triggers a purchasing wave that dramatically lifts the 3D gaming console market. Sony's PlayStation 5 sold over 50 million units within its first three years, generating more than USD 20 billion in hardware and launch-title revenue [5].

VR/AR Integration into Console Platforms

Sony's PlayStation VR2 headset, priced at USD 549 at launch, demonstrated that console-tethered VR can reach mainstream audiences when backed by a robust first-party title slate. As headset costs decline and passthrough AR capabilities improve, VR and AR peripherals are becoming essential 3D gaming console market growth catalysts across North America and Asia-Pacific.

Cloud-Gaming Hybrid Architectures

Hybrid models — where local hardware handles latency-sensitive 3D rendering while cloud servers manage asset streaming — reduce the upfront cost barrier and open the 3D gaming console market to price-sensitive segments in emerging economies.

Digital Storefront and Subscription Growth

Game Pass, PlayStation Plus, and Nintendo Switch Online collectively serve over 120 million subscribers as of 2024, creating recurring revenue streams that increase the lifetime value of each console sold [12]. Digital distribution now accounts for more than 65% of all game sales on major platforms, a shift that improves software margins and incentivizes publishers to invest in higher-quality 3D titles.


Restraints Impact Analysis

The restraint estimates below reflect directional drag on market expansion. They are not directly subtracted from CAGR and represent qualitative risk assessments.

Restraint ~% Negative Impact Geographic Relevance Impact Timeline
PC and mobile gaming competition –10 to –15% Global Ongoing
High game development costs –8 to –12% North America, Europe Medium-term (2–4 yr)
Semiconductor supply volatility –5 to –8% Global Short-term (≤2 yr)
Console pricing pressure in emerging markets –4 to –7% Asia-Pacific, South America Long-term (≥4 yr)
Regulatory scrutiny on in-game monetization –3 to –5% Europe, Asia-Pacific Medium-term (2–4 yr)


PC and Mobile Gaming Competition

The revenue of PC gaming was over USD 40 billion worldwide in 2024, and the peak concurrent user number of Steam was over 35 million [15]. Mobile gaming topped USD 90 billion. Both ecosystems are competing for player time and discretionary spending, restricting the ceiling of the 3D gaming console industry – especially in areas where smartphones are the major gaming device.


High Game Development Costs

AAA title expenditures are now often over USD 200 million, including marketing, with some tentpole series going over USD 300 million [16]. Rising expenses squeeze publisher profits and limit the pace at which studios greenlight new 3D-exclusive titles, and indirectly cool the software-driven growth engine of the 3D gaming console market.


Semiconductor Supply Volatility

Custom APU shortages constrained PlayStation 5 availability for over 18 months post-launch. While fab capacity has expanded — TSMC's Arizona plant targets 4 nm production by 2026 — geopolitical tensions around Taiwan and export controls on advanced lithography equipment introduce persistent uncertainty.


3D Gaming Console Market Opportunities

Emerging-Market Console Penetration

India's gaming population exceeded 500 million in 2024, yet console penetration sits below 3% of gaming households [13]. Affordable price-point consoles — positioned between USD 150 and USD 250 — could unlock substantial volume in India, Brazil, and Southeast Asia, where rising middle-class incomes intersect with improving broadband infrastructure.

Subscription and Data-Driven Revenue Models

Console makers are shifting from one-time hardware sales to recurring-revenue platforms. Game Pass-style subscriptions, in-game advertising, and anonymized gameplay-telemetry monetization create layered revenue stacks that can boost per-user lifetime value by 40–60% compared with traditional buy-to-play models [12].

Haptic and Spatial-Audio Accessories

The success of the DualSense controller's adaptive triggers — cited by developers as a differentiator in over 400 supported titles — signals a broad opportunity in peripherals that deepen 3D immersion. Haptic vests, spatial-audio headsets, and motion-tracking add-ons represent an accessory layer.

Cross-Platform 3D Content Ecosystems

Interoperability frameworks such as Epic Games' Unreal Engine 5 MetaHuman pipeline allow studios to deploy a single 3D asset base across console, PC, and VR simultaneously. This reduces per-platform development costs by an estimated 20–30% and incentivizes studios to prioritize console-optimized 3D releases.

Esports and Live-Service 3D Titles

The global esports economy is projected to surpass USD 2.5 billion by 2028 [14]. Console-native esports leagues — built around franchises that exploit 3D arenas and spectator cameras — present a monetization and brand-engagement channel that platform holders are only beginning to commercialize at scale.


3D Gaming Console Market Future Outlook

AI-Powered Game Development and Console Processing

The 3D gaming console market will be transformed by on-device AI inference engines during the forecast period. Next-gen APUs will also feature custom neural processing units that will enable real-time asset upscaling, NPC behavior modeling, and procedural world generation – all at an estimated 15-25% lower development cost with improved visual fidelity. The DLSS architecture from NVIDIA and the FSR design from AMD have already shown 2× performance increases at the same image quality [20].


Platform Economics and Walled-Garden Monetization

The console business model is shifting from a hardware margin to a platform margin. By 2030, subscription, advertising, and storefront-commission revenue is predicted to overtake hardware revenue for all three major platform holders. This pattern benefits from aggressive pricing of consoles (perhaps even loss-leader hardware) to grow the installed base of the 3D gaming console industry and expedite the compounding of software-driven revenue [12].


Sustainability and Circular-Economy Consoles

ESG-driven design is entering the console lifecycle. Sony's PlayStation 5 already incorporates post-consumer recycled plastics, and Microsoft has pledged carbon-negative operations by 2030 [21]. Trade-in refurbishment programs, modular component upgrades, and energy-efficient standby modes will become competitive differentiators — particularly in Europe.

Spatial Computing Convergence

The line between specialist gaming consoles and spatial-computing platforms is becoming blurred. Meta and Apple’s mixed-reality headsets are vying more and more for the same entertainment budget as traditional consoles. The 3D gaming console industry will evolve to integrate passthrough AR capabilities, hand tracking and eye tracking into console peripherals to create hybrid entertainment hubs that go beyond gaming to include fitness, social interaction and live event viewing [22].


3D Gaming Console Market Segmentation

By Component

Segment Key Metric Primary Demand Driver
Hardware ~62% revenue share (2025) Premium pricing on next-gen consoles
Software CAGR ~18.3% Digital distribution, subscription bundles


Hardware continues to anchor the 3D gaming console market, driven by console refresh cycles that command retail prices between USD 399 and USD 599 for flagship units. Custom APUs, high-bandwidth memory modules, and SSD storage subsystems constitute the bulk of bill-of-materials costs, giving hardware a dominant share even as unit margins remain thin.

Software is accelerating faster in percentage terms because digital storefronts have eliminated physical distribution costs and enabled day-one global launches. Subscription services such as Game Pass and PlayStation Plus Extra are expanding the addressable software TAM by converting occasional buyers into monthly payers, lifting per-console software revenue by approximately 35% over the prior generation [12].

By Console Type

Segment Key Metric Primary Demand Driver
Home Consoles ~USD 3.22 B (2025) Living-room entertainment hub positioning
Handheld Consoles CAGR ~19.1% Portable 3D gaming; Steam Deck effect
Micro Consoles ~6% revenue share (2025) Casual-gaming and streaming-stick form factors
Dedicated Consoles ~USD 0.28 B (2025) Retro-revival and niche collector demand


Home consoles remain the volume and revenue core of the 3D gaming console market. The PlayStation 5, Xbox Series X

S, and Nintendo Switch family collectively shipped over 45 million units in 2024, driven by blockbuster exclusive titles and backward-compatibility features that protect consumers' existing game libraries.

Handheld consoles are experiencing a resurgence. Valve's Steam Deck and Nintendo's next-generation portable have validated demand for high-fidelity 3D gaming outside the living room, attracting both commuters and travelers. This segment's growth trajectory suggests it could reach 20% of total console revenue by 2030.

By Platform

Segment Key Metric Primary Demand Driver
Sony PlayStation ~38% revenue share (2025) First-party studio depth; VR ecosystem
Microsoft Xbox CAGR ~17.6% Game Pass subscription flywheel; Activision portfolio
Nintendo ~USD 0.88 B (2025) Family-oriented content; hybrid console innovation


Sony PlayStation leads platform share within the 3D gaming console market, underpinned by an exclusive title library that includes franchises valued at over USD 10 billion in cumulative sales. Microsoft Xbox is the fastest-growing platform, propelled by the integration of Activision Blizzard's catalog into Game Pass and aggressive cloud-gaming expansion. Nintendo occupies a distinct niche by prioritizing gameplay innovation and family accessibility over raw graphical performance.


Regional Market Share Analysis

Region Key Metric Primary Investment Themes
North America ~36% revenue share (2025) Digital storefronts, subscription services, esports venues
Europe ~27% revenue share Regulatory harmonization, localized content, cloud gaming
Asia-Pacific CAGR ~18.2% (2026–2035) Console affordability, mobile-to-console migration, 5G
South America ~USD 0.36 B (2025) Price-sensitive hardware tiers, growing broadband
Middle East & Africa CAGR ~17.5% (2026–2035) Youth demographics, digital infrastructure investment
Total USD 5.18 B (2025)

The 3D gaming console market spans five major regions, each shaped by distinct infrastructure maturity, consumer purchasing power, and regulatory environments.


North America

Country Key Metric Key Driver
US ~78% of regional share Largest installed base; Game Pass ecosystem
Canada CAGR ~15.8% Strong broadband coverage; bilingual content demand
Mexico ~USD 0.07 B (2025) Expanding middle class; console grey-market formalization


The United States drives the North American 3D gaming console market through a combination of deep retail distribution networks, early-adopter purchasing behavior, and a mature digital storefront ecosystem anchored by the PlayStation Store and Xbox Marketplace. Canada's growth tracks the US closely, while Mexico is beginning to formalize previously informal console distribution channels, opening new volume potential [17].

Europe

Country Key Metric Key Driver
Germany ~21% of regional share Engineering R&D base; strong retail chains
UK ~20% of regional share High digital-purchase ratio; esports growth
France CAGR ~15.4% Government cultural subsidies for game development
Italy ~USD 0.10 B (2025) Growing online multiplayer communities
Spain CAGR ~14.9% Expanding fiber broadband
Nordic Countries ~8% of regional share High disposable income; early 5G adoption
Russia ~USD 0.06 B (2025) Import restrictions limiting official channels
Rest of Europe CAGR ~14.2% Varied broadband maturity


Germany and the UK together account for more than 40% of European 3D gaming console market revenue. France benefits from government subsidies for domestic game studios — the Crédit d'Impôt Jeux Vidéo provides a 30% tax credit on eligible development costs — which stimulates local content creation and drives console software attach rates [18].

Asia-Pacific

Country Key Metric Key Driver
China ~32% of regional share Domestic console manufacturing; regulatory licensing thaw
India CAGR ~21.5% Massive gamer base; sub-USD 250 console demand
Japan ~28% of regional share Home of Sony and Nintendo; cultural content powerhouse
South Korea ~USD 0.11 B (2025) Esports infrastructure; 5G penetration
ASEAN CAGR ~19.8% Youth demographics; smartphone-to-console upgraders
Rest of Asia-Pacific ~USD 0.04 B (2025) Early-stage console adoption


Asia-Pacific is the fastest-growing theater for the 3D gaming console market. Japan anchors the region as both a hardware design hub and a content exporter, while China's console segment has expanded rapidly since the 2015 lifting of the console import ban. India represents the highest single-country growth rate in this region — mobile-first gamers are transitioning to console platforms as broadband speeds exceed 50 Mbps in urban centers [11].

South America

Country Key Metric Key Driver
Brazil ~62% of regional share Largest South American gamer base; local assembly incentives
Argentina CAGR ~16.0% Currency devaluation driving grey-market to official channels
Rest of South America ~USD 0.05 B (2025) Nascent console adoption


Brazil dominates the South American 3D gaming console market, aided by the Manaus Free Trade Zone's tax incentives for electronics assembly. Import tariffs remain a constraint elsewhere in the region, pushing console prices 30–50% above US equivalents and limiting penetration to upper-income households [17].

Middle East & Africa

Country Key Metric Key Driver
Saudi Arabia ~30% of regional share Vision 2030 entertainment spending; gaming events
UAE CAGR ~18.1% High per-capita income; gaming café culture
South Africa ~USD 0.03 B (2025) Growing urban middle class
Egypt CAGR ~16.8% Youth population bulge; mobile-to-console pathway
Rest of MEA ~USD 0.04 B (2025) Infrastructure investment lag


Saudi Arabia's Savvy Games Group, backed by the Public Investment Fund, has deployed over USD 7.5 billion in gaming investments since 2022, with a portion directed at localizing console ecosystems for the MENA region [19]. The UAE complements this with gaming-tourism attractions and regulatory openness to esports betting.


3D Gaming Console Market By Region, 2025-2035

Competitive Benchmarking

The 3D gaming console market exhibits high concentration, with the top three platform holders — Sony, Microsoft, and Nintendo — collectively controlling an estimated 78–84% of global revenue. The Herfindahl-Hirschman Index for the console hardware segment exceeds 2,500, classifying it as a highly concentrated market. Competition centers on exclusive content, subscription economics, and silicon performance rather than price.

Company Est. Revenue Share Range Key Offerings Strategic Positioning  
Sony Interactive Entertainment ~22–26% PlayStation 5, PS VR2, PlayStation Plus First-party studio ecosystem; VR console leader  
Microsoft Gaming ~20–24% Xbox Series X S, Game Pass, xCloud Subscription-first model; Activision Blizzard integration
Nintendo ~18–22% Switch family, first-party franchises Family-oriented hybrid console; gameplay innovation  
Valve Corporation ~4–6% Steam Deck, SteamOS PC-console crossover; open-platform ethos  
Meta Platforms ~3–5% Quest 3, Horizon OS VR-native gaming; social metaverse positioning  
NVIDIA ~2–4% Shield, GeForce NOW Cloud-gaming infrastructure; GPU licensing  
Sega (legacy/licensing) ~1–3% Game licensing, retro consoles IP monetization; nostalgia-driven hardware  
HTC ~1–2% Vive Focus, Vive XR Elite Enterprise-grade VR with gaming crossover  
Razer ~1–2% Edge handheld, peripherals Gaming-lifestyle brand; accessories ecosystem  
Logitech ~1–2% Cloud-gaming handheld, controllers Peripheral-first; cloud-gaming hardware partnership  


Recent News & Developments

  • Sony Interactive Entertainment (September 2024): Announced a mid-generation PlayStation 5 Pro with a 45% GPU performance uplift, targeting native 8K output for select 3D titles [5].


  • Nintendo (April 2025): Officially unveiled the Nintendo Switch 2, featuring NVIDIA's custom Ampere-based SoC and backward compatibility with the existing Switch library [6].


  • Meta Platforms (October 2024): Launched Quest 3S at USD 299, lowering the VR entry price and expanding the console-adjacent gaming audience [22].


  • Saudi Arabia's Savvy Games Group (November 2023): Acquired a minority stake in a Japanese game studio for USD 250 million, signaling deepened investment in console-exclusive content for the MENA region [19].


3D Gaming Console Market Report Scope

Parameter Detail
Market Scope Global 3D gaming console market covering hardware, software, accessories, and platform ecosystems
Study Period 2021–2035
Base Year 2025
CAGR (Forecast Period) 16.4% (2026–2035)
Market Size — Base Year USD 5.18 Billion (2025)
Market Size — End of Forecast USD 23.65 Billion (2035)
Fastest Growing Segment Software (by component); Handheld Consoles (by console type)
Companies Profiled Sony, Microsoft, Nintendo, Valve, Meta, NVIDIA, Sega, HTC, Razer, Logitech
Valuation Currency USD (constant 2025 dollars)

FAQs

How do trade-in and refurbishment programs affect new console pricing strategies?
Trade-in programs compress effective retail prices by 15–25%, pressuring manufacturers to widen digital-revenue margins. Platform holders increasingly subsidize hardware cost through subscription lock-in rather than upfront retail margin [12].
What role do indie game studios play in expanding the 3D console software library?
Indies accounted for over 40% of new console titles published in 2024, diversifying the content pipeline at lower production budgets. Their rapid iteration cycles fill catalog gaps between AAA release windows [13].
How does semiconductor node advancement influence console refresh timing?
Each node shrink — from 7 nm to 4 nm to 3 nm — enables higher transistor density and lower thermal envelopes, which platform holders use to justify mid-generation and full-generation hardware refreshes [4].
What impact do loot-box and microtransaction regulations have on console software revenue?
European regulations and anti-gambling scrutiny—led by Belgium's prohibition of paid randomized loot boxes—force publishers to disable chance-based microtransactions or transition toward transparent battle passes and direct cosmetic purchases.
How are console makers addressing accessibility for gamers with disabilities?
Platform holders prioritize accessibility through modular input hardware—such as Microsoft’s Xbox Adaptive Controller and Sony’s Access Controller—alongside deep system-level software remapping, screen-reading, and visual-assist features.  
What distinguishes cloud-only gaming services from cloud-hybrid console models?
Cloud-only services stream all rendering remotely, while hybrid consoles use local silicon for latency-sensitive tasks and offload asset streaming to the cloud. Hybrid models deliver lower input latency — typically under 20 ms [10].
How significant is the retro-console and mini-console segment for the broader 3D gaming console market?
Retro and mini consoles generate roughly USD 0.28 billion annually, serving collector and nostalgia-driven audiences. They function as brand-awareness tools that funnel buyers toward flagship hardware [24].    
Author
Author
Author Profile
Kiran Jinkalwad LinkedIn
Research Associate Level - II
Kiran Jinkalwad brings over four years of experience in market research, specializing in the ICT and Semiconductor sectors. She has worked on 50+ projects, including custom studies for companies like Microsoft and Huawei, addressing complex business challenges. With a background in Electronics and Telecommunication, Kiran excels in market estimation, forecasting, and strategic analysis. His sharp analytical skills and industry knowledge consistently deliver actionable insights for diverse clients.

Research Approach


Secondary Research

The secondary research process involved comprehensive analysis of regulatory databases, industry publications, gaming industry reports, and authoritative technology organizations. Key sources included the Entertainment Software Association (ESA), International Game Developers Association (IGDA), Interactive Software Federation of Europe (ISFE), Computer Entertainment Supplier's Association (CESA) Japan, Entertainment Software Rating Board (ESRB), Pan European Game Information (PEGI), Consumer Technology Association (CTA), International Data Corporation (IDC), NPD Group/Circana, GfK Entertainment, Statista Technology Market Insights, OECD Digital Economy Outlook, World Intellectual Property Organization (WIPO) Patent Database, IEEE Xplore Digital Library, ACM Digital Library, and national communications regulatory authorities including the Federal Communications Commission (FCC), European Electronic Communications Code (EECC) implementations, and Ministry of Internal Affairs and Communications (MIC) Japan.

Hardware shipment statistics, regulatory compliance data, technology adoption studies, demographic gaming trends, and competitive landscape analysis for home, handheld, and hybrid consoles, ray tracing technologies, variable rate shading, machine learning super sampling, and virtual reality integration were gathered from these sources.


Primary Research

In order to gather both qualitative and quantitative insights, supply-side and demand-side stakeholders were interviewed during the primary research process. CEOs, VPs of Hardware Engineering, directors of platform ecosystems, and supply chain executives from OEM partners, semiconductor vendors, and game console makers were examples of supply-side sources. Game developers, esports tournament organizers, retail channel managers, and procurement leaders from consumer electronics retailers, gaming specialty stores, and digital distribution platforms were examples of demand-side suppliers. Market segmentation, product roadmap timescales, and consumer adoption patterns, pricing strategies, and content ecosystem dynamics were all corroborated by primary research.

Primary Respondent Breakdown:

By Designation: C-level Primaries (32%), Director Level (31%), Others (37%)

By Region: North America (38%), Europe (25%), Asia-Pacific (28%), Rest of World (9%)


Market Size Estimation

Unit shipment analysis and revenue mapping were used to get the global market valuation. The methodology comprised:

Finding more than thirty-five major producers and suppliers of components in North America, Europe, Asia-Pacific, and Latin America

Ray tracing, variable rate shading, machine learning super sampling, headset-based virtual reality, inside-out tracking, eye tracking, motion capture, gesture recognition, and force feedback are examples of product mapping across home consoles, portable consoles, hybrid consoles, and technology segments.

An examination of reported and projected yearly income

Download Free Sample

Kindly complete the form below to receive a free sample of this Report

* Please use a valid business email

Download PDF ×

We do not share your information with anyone. However, we may send you emails based on your report interest from time to time. You may contact us at any time to opt-out.
















