Segmentation Quick Reference
| Dimension | Sub-Segments | Dominant Segment | Fastest Growing Segment |
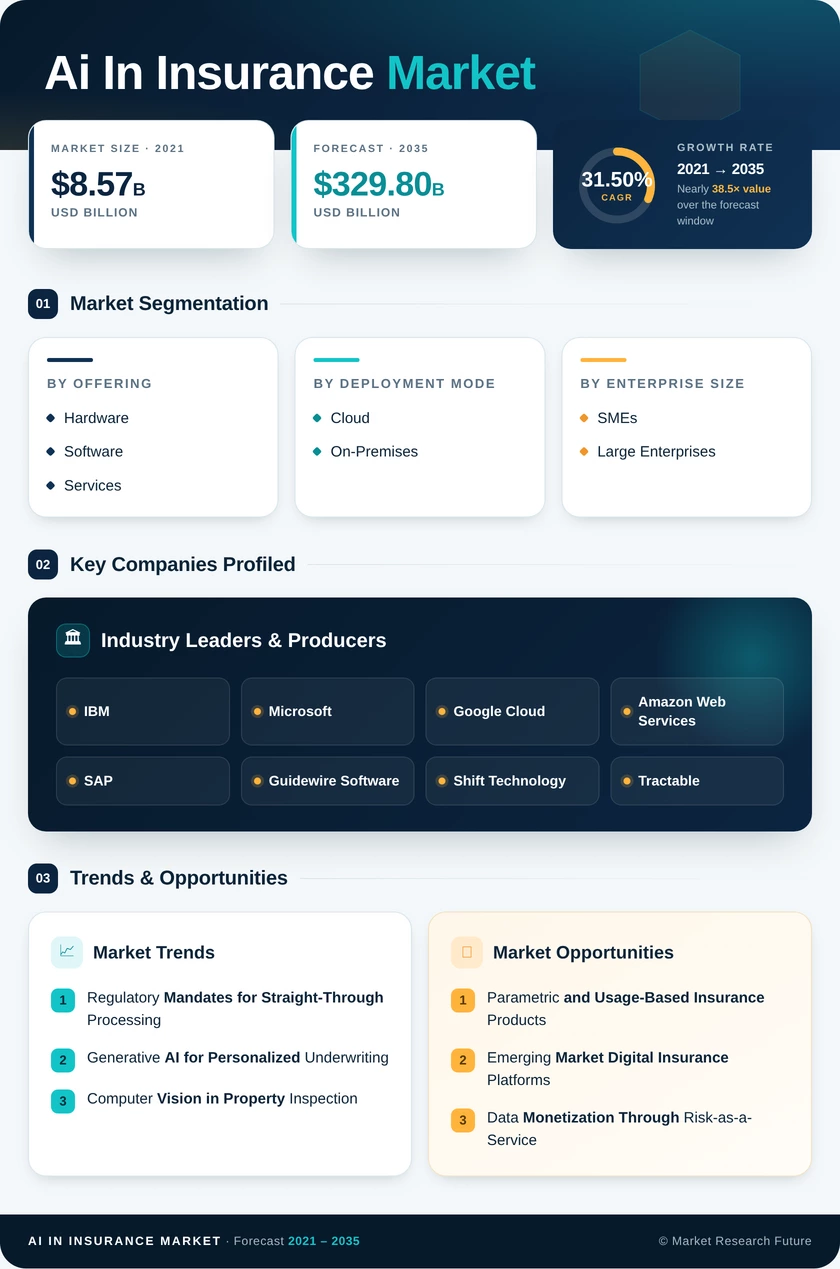
| By Offering | Hardware, Software, Services | Software (52.0% share, 2025) | Services (38.50% CAGR) |
| By Deployment Mode | Cloud, On-Premises | Cloud (65.6% share, 2025) | Cloud (33.90% CAGR) |
| By Enterprise Size | SMEs, Large Enterprises | Large Enterprises (76.0% share, 2025) | SMEs (42.0% CAGR) |
| By End-User | Life & Health Insurance, Property & Casualty Insurance | Property & Casualty (62.4% share, 2025) | Life & Health (36.20% CAGR) |
| By AI in Insurance Market | Machine Learning, Natural Language Processing, Computer Vision | Machine Learning (65.4% share, 2025) | Computer Vision (39.80% CAGR) |
Market Segmentation Overview
By Offering
| Sub-Segment | Key Trend |
| Hardware | Edge computing infrastructure for telematics and IoT-enabled insurance data processing |
| Software | Cloud-native AI platforms integrating underwriting, claims, and fraud detection workflows |
| Services | Rising demand for managed AI operations and model validation consulting |
Software remains the primary revenue contributor as carriers prioritize platform-based solutions that unify multiple AI workloads. Services growth is accelerating as implementation complexity and regulatory compliance requirements create sustained demand for specialized consulting and managed operations.
By Deployment Mode
| Sub-Segment | Key Trend |
| Cloud | API-first architectures enabling rapid model deployment and elastic scaling |
| On-Premises | Data-sovereignty requirements sustaining demand among regulated carriers |
Cloud deployment dominates due to its scalability advantages and lower upfront capital requirements. Hybrid models are gaining traction among carriers that need to balance cloud agility with regulatory data-residency mandates.
By Enterprise Size
| Sub-Segment | Key Trend |
| Small and Medium Enterprises (SMEs) | SaaS-based AI platforms eliminating the need for in-house data science teams |
| Large Enterprises | Enterprise-grade digital transformation with bespoke AI ecosystems |
Large enterprises lead overall spending, but SMEs represent the fastest adoption curve as AI-as-a-service platforms reduce cost and complexity barriers that previously limited AI access to top-tier carriers.
By End-User
| Sub-Segment | Key Trend |
| Life and Health Insurance | Generative AI processing unstructured medical records for mortality and morbidity modeling |
| Property and Casualty Insurance | Computer vision and telematics powering automated damage assessment and usage-based pricing |
Property and casualty lines drive the majority of current AI spending, given high claim volumes and mature visual-AI applications. Life and health insurance is the fastest-growing end-user segment as LLMs unlock new capabilities in medical document processing.
By AI in Insurance Market
| Sub-Segment | Key Trend |
| Machine Learning | Core predictive modeling engine for pricing, claims triage, and fraud scoring |
| Natural Language Processing | Document extraction from policy submissions, medical records, and legal filings |
| Computer Vision | Drone-based and satellite-based property damage assessment and vehicle inspection |
Machine learning underpins the broadest range of insurance AI applications. Computer vision is the fastest-growing technology segment, expanding from catastrophe-only use cases into routine underwriting and claims workflows.