-
EXECUTIVE SUMMARY
-
Market Attractiveness
- Global AI/AI/ML in Media and Entertainment Market, by Solution
- Global AI/AI/ML in Media and Entertainment Market, by Application
-
Analysis
-
Global AI/AI/ML in Media and Entertainment Market, by End User
-
Global AI/ML
-
AI/ML in Media and Entertainment Market, by Region
-
MARKET INTRODUCTION
-
Definition
-
Scope of the Study
-
Market Structure
-
Key
-
Buying Criteria
-
Macro Factor Indicator Analysis
-
RESEARCH METHODOLOGY
-
Research Process
-
Primary Research
-
Secondary Research
-
Market Size Estimation
-
Forecast Model
-
List of Assumptions
-
MARKET DYNAMICS
-
Introduction
-
Drivers
- The increasing
- The growth of streaming services
- Driver impact analysis
-
demand for personalized content
-
Restraints
- The ethical implications
- Restraint impact analysis
-
of using AI
-
Opportunities
- The potential to increase efficiency
-
The potential for new business models
-
Challenges
- Data Concern
-
Covid-19 Impact Analysis
- Impact on market
- Impact on Media and Entertainment
-
YOY growth 2020-2022
-
COVID-19 IMPACT ON SUPPLY CHAIN MARKET FACTOR ANALYSIS
-
Value Chain Analysis/Supply Chain Analysis
-
Porter’s Five
- Bargaining Power of Suppliers
- Bargaining Power
- Threat of New Entrants
- Threat of Substitutes
- Intensity of Rivalry
-
Forces Model
-
of Buyers
-
GLOBAL AI/AI/ML in Media and Entertainment Market,
-
BY SOLUTION
-
Introduction
-
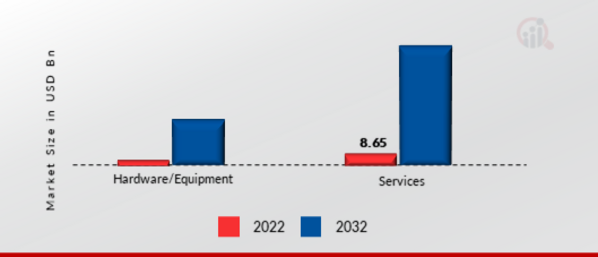
Hardware/Equipment
-
Services
-
GLOBAL AI/AI/ML in Media and Entertainment Market, BY APPLICATION
-
Introduction
-
Gaming
-
Fake Story Detection
-
Plagiarism Detection
-
Personalization
-
Production Planning & Management
-
Sales &
-
Marketing
-
Talent Identification
-
Content Capture
-
Others
-
GLOBAL AI/AI/ML in Media and Entertainment Market, BY END USER
-
Introduction
-
Film and Television
-
Music
-
Gaming
-
Sports
-
Media Agencies
-
Others
-
GLOBAL AI/ML IN MEDIA AND ENTERTAINMENT
-
MARKET SIZE ESTIMATION & AI/ML in Media and Entertainment Market, BY REGION
-
Introduction
- Market Estimates & AI/ML in Media and Entertainment Market, by Country, 2018-2032
- Market Estimates & AI/ML in Media and Entertainment Market, by Solution, 2018-2032
- Market
-
North America
-
Estimates & AI/ML in Media and Entertainment Market, by Application, 2018-2032
-
Market Estimates
-
& AI/ML in Media and Entertainment Market, by End User, 2018-2032
-
US
-
Market Estimates
-
& AI/ML in Media and Entertainment Market, by Solution, 2018-2032
-
by Application, 2018-2032
-
User, 2018-2032
-
by Solution, 2018-2032
-
Market Estimates & AI/ML in Media and Entertainment Market,
-
Market Estimates & AI/ML in Media and Entertainment Market, by End
-
Canada
-
Market Estimates & AI/ML in Media and Entertainment Market,
-
Market Estimates & AI/ML in Media and Entertainment Market, by Application,
-
Market Estimates & AI/ML in Media and Entertainment Market, by End User, 2018-2032
-
Mexico
-
Market Estimates & AI/ML in Media and Entertainment Market, by Solution, 2018-2032
-
Market Estimates & AI/ML in Media and Entertainment Market, by Application, 2018-2032
-
Market Estimates & AI/ML in Media and Entertainment Market, by End User, 2018-2032
-
Europe
-
Market Estimates & AI/ML in Media and Entertainment Market, by Country, 2018-2032
-
Market Estimates
-
& AI/ML in Media and Entertainment Market, by Solution, 2018-2032
-
by Application, 2018-2032
-
Market Estimates & AI/ML in Media and Entertainment Market,
-
Market Estimates & AI/ML in Media and Entertainment Market, by End User,
-
UK
-
Market Estimates & AI/ML in Media and Entertainment Market, by Solution,
-
Market Estimates & AI/ML in Media and Entertainment Market, by Application, 2018-2032
-
Market Estimates & AI/ML in Media and Entertainment Market, by End User, 2018-2032
-
Germany
-
Market Estimates & AI/ML in Media and Entertainment Market, by Solution, 2018-2032
-
Market Estimates & AI/ML in Media and Entertainment Market, by Application, 2018-2032
-
Market
-
Estimates & AI/ML in Media and Entertainment Market, by End User, 2018-2032
-
France
-
Market Estimates & AI/ML in Media and Entertainment Market, by Solution, 2018-2032
-
Market Estimates
-
& AI/ML in Media and Entertainment Market, by Application, 2018-2032
-
by End User, 2018-2032
-
by Solution, 2018-2032
-
Market Estimates & AI/ML in Media and Entertainment Market,
-
Italy
-
Market Estimates & AI/ML in Media and Entertainment Market,
-
Market Estimates & AI/ML in Media and Entertainment Market, by Application,
-
Market Estimates & AI/ML in Media and Entertainment Market, by End User, 2018-2032
-
Spain
-
Market Estimates & AI/ML in Media and Entertainment Market, by Solution, 2018-2032
-
Market Estimates & AI/ML in Media and Entertainment Market, by Application, 2018-2032
-
Market Estimates & AI/ML in Media and Entertainment Market, by End User, 2018-2032
-
Rest of Europe
-
Market Estimates & AI/ML in Media and Entertainment Market, by Solution, 2018-2032
-
Market Estimates & AI/ML in Media and Entertainment Market, by Application, 2018-2032
-
Market
-
Estimates & AI/ML in Media and Entertainment Market, by End User, 2018-2032
-
Asia-Pacific
-
Market Estimates & AI/ML in Media and Entertainment Market, by Country, 2018-2032
-
Market Estimates
-
& AI/ML in Media and Entertainment Market, by Solution, 2018-2032
-
by Application, 2018-2032
-
Market Estimates & AI/ML in Media and Entertainment Market,
-
Market Estimates & AI/ML in Media and Entertainment Market, by End User,
-
China
-
Market Estimates & AI/ML in Media and Entertainment Market, by Solution,
-
Market Estimates & AI/ML in Media and Entertainment Market, by Application, 2018-2032
-
Market Estimates & AI/ML in Media and Entertainment Market, by End User, 2018-2032
-
Japan
-
Market Estimates & AI/ML in Media and Entertainment Market, by Solution, 2018-2032
-
Market Estimates & AI/ML in Media and Entertainment Market, by Application, 2018-2032
-
Market
-
Estimates & AI/ML in Media and Entertainment Market, by End User, 2018-2032
-
India
-
Market Estimates & AI/ML in Media and Entertainment Market, by Solution, 2018-2032
-
Market Estimates
-
& AI/ML in Media and Entertainment Market, by Application, 2018-2032
-
by End User, 2018-2032
-
Market Estimates & AI/ML in Media and Entertainment Market,
-
South Korea
-
Market Estimates &
-
AI/ML in Media and Entertainment Market, by Solution, 2018-2032
-
by Application, 2018-2032
-
User, 2018-2032
-
Market Estimates & AI/ML in Media and Entertainment Market,
-
Market Estimates & AI/ML in Media and Entertainment Market, by End
-
Rest of Asia-Pacific
-
Market Estimates
-
& AI/ML in Media and Entertainment Market, by Solution, 2018-2032
-
by Application, 2018-2032
-
User, 2018-2032
-
by Product, 2018-2032
-
East
-
Market Estimates & AI/ML in Media and Entertainment Market,
-
Market Estimates & AI/ML in Media and Entertainment Market, by End
-
Rest of the World
- Market Estimates & AI/ML in Media and Entertainment Market,
- Market Estimates & AI/ML in Media and Entertainment Market, by Solution,
- Market Estimates & AI/ML in Media and Entertainment Market, by Application, 2018-2032
- Market Estimates & AI/ML in Media and Entertainment Market, by End User, 2018-2032
- Middle
-
Market Estimates & AI/ML in Media and Entertainment Market, by Application, 2018-2032
-
Market
-
Estimates & AI/ML in Media and Entertainment Market, by End User, 2018-2032
-
Africa
-
Market Estimates & AI/ML in Media and Entertainment Market, by Solution, 2018-2032
-
Market Estimates
-
& AI/ML in Media and Entertainment Market, by Application, 2018-2032
-
by End User, 2018-2032
-
Market Estimates & AI/ML in Media and Entertainment Market,
-
Latin America
-
Market Estimates
-
& AI/ML in Media and Entertainment Market, by Solution, 2018-2032
-
by Application, 2018-2032
-
User, 2018-2032
-
Market Estimates & AI/ML in Media and Entertainment Market,
-
Market Estimates & AI/ML in Media and Entertainment Market, by End
-
COMPETITIVE LANDSCAPE
-
Introduction
-
Key Developments & Growth Strategies
-
Competitor Benchmarking
-
Vendor Share Analysis, 2022(% Share)
-
COMPANY PROFILES
-
Amazon
- Company Overview
- Financial Overview
- Products/ Solutions/ Services Offerred
- Key Market Developments
- SWOT Analysis
- Key Strategies
-
Web Services, Inc.
-
Gearhouse South Africa
-
PTY Ltd
-
GRAVITY MEDIA
-
GrayMeta
-
IBM Corporation
-
LMG LLC
-
Matchroom Sport Ltd.
-
Production Resource Group,
-
L.L.C
-
Synthesia Ltd
-
Valossa Labs Ltd
-
VERITONE,
-
INC.
-
TAIT
-
Sportway AB
-
EVS Broadcast Equipment
-
S.A
-
Hudi
- Company Overview
- Financial Overview
- Solution/Services Offered
- Key Developments
- Key Strategies
-
SWOT Analysis
-
-
LIST OF TABLES
-
TABLE
-
MARKET SYNOPSIS
-
GLOBAL AI/AI/ML in Media and Entertainment Market, BY
-
SOLUTION, 2018–2032 (USD MILLION)
-
GLOBAL AI/ML IN MEDIA AND ENTERTAINMENT
-
AI/ML in Media and Entertainment Market, BY APPLICATION, 2018–2032 (USD MILLION)
-
GLOBAL AI/ML
-
AI/ML in Media and Entertainment Market, BY END USER, 2018–2032 (USD MILLION)
-
GLOBAL AI/AI/ML in Media and Entertainment Market, BY REGION, 2018–2032
-
(USD MILLION)
-
NORTH AMERICA AI/AI/ML in Media and Entertainment Market,
-
BY COUNTRY, 2018–2032 (USD MILLION)
-
NORTH AMERICA AI/ML IN MEDIA
-
AI/ML in Media and Entertainment Market, BY SOLUTION, 2018–2032 (USD MILLION)
-
TABLE
-
NORTH AMERICA AI/AI/ML in Media and Entertainment Market, BY APPLICATION, 2018–2032
-
(USD MILLION)
-
NORTH AMERICA AI/AI/ML in Media and Entertainment Market,
-
BY END USER, 2018–2032 (USD MILLION)
-
US AI/ML IN MEDIA AND ENTERTAINMENT
-
AI/ML in Media and Entertainment Market, BY SOLUTION, 2018–2032 (USD MILLION)
-
US AI/ML IN MEDIA
-
AI/ML in Media and Entertainment Market, BY APPLICATION, 2018–2032 (USD MILLION)
-
TABLE
-
US AI/AI/ML in Media and Entertainment Market, BY END USER, 2018–2032 (USD
-
MILLION)
-
CANADA AI/AI/ML in Media and Entertainment Market, BY SOLUTION,
-
CANADA AI/ML IN MEDIA AND ENTERTAINMENT
-
AI/ML in Media and Entertainment Market, BY APPLICATION, 2018–2032 (USD MILLION)
-
CANADA AI/ML
-
AI/ML in Media and Entertainment Market, BY END USER, 2018–2032 (USD MILLION)
-
MEXICO AI/AI/ML in Media and Entertainment Market, BY SOLUTION, 2018–2032
-
(USD MILLION)
-
MEXICO AI/AI/ML in Media and Entertainment Market, BY APPLICATION,
-
MEXICO AI/ML IN MEDIA AND ENTERTAINMENT
-
AI/ML in Media and Entertainment Market, BY END USER, 2018–2032 (USD MILLION)
-
EUROPE AI/ML IN
-
AI/ML in Media and Entertainment Market, BY COUNTRY, 2018–2032 (USD MILLION)
-
TABLE
-
EUROPE AI/AI/ML in Media and Entertainment Market, BY SOLUTION, 2018–2032
-
(USD MILLION)
-
EUROPE AI/AI/ML in Media and Entertainment Market, BY APPLICATION,
-
EUROPE AI/ML IN MEDIA AND ENTERTAINMENT
-
AI/ML in Media and Entertainment Market, BY END USER, 2018–2032 (USD MILLION)
-
UK AI/ML IN MEDIA
-
AI/ML in Media and Entertainment Market, BY SOLUTION, 2018–2032 (USD MILLION)
-
TABLE
-
UK AI/AI/ML in Media and Entertainment Market, BY APPLICATION, 2018–2032 (USD
-
MILLION)
-
UK AI/AI/ML in Media and Entertainment Market, BY END USER,
-
GERMANY AI/ML IN MEDIA AND ENTERTAINMENT
-
AI/ML in Media and Entertainment Market, BY SOLUTION, 2018–2032 (USD MILLION)
-
GERMANY AI/ML IN
-
AI/ML in Media and Entertainment Market, BY APPLICATION, 2018–2032 (USD MILLION)
-
GERMANY AI/AI/ML in Media and Entertainment Market, BY END USER, 2018–2032
-
(USD MILLION)
-
FRANCE AI/AI/ML in Media and Entertainment Market, BY SOLUTION,
-
FRANCE AI/ML IN MEDIA AND ENTERTAINMENT
-
AI/ML in Media and Entertainment Market, BY APPLICATION, 2018–2032 (USD MILLION)
-
FRANCE AI/ML
-
AI/ML in Media and Entertainment Market, BY END USER, 2018–2032 (USD MILLION)
-
SPAIN AI/AI/ML in Media and Entertainment Market, BY SOLUTION, 2018–2032
-
(USD MILLION)
-
SPAIN AI/AI/ML in Media and Entertainment Market, BY APPLICATION,
-
SPAIN AI/ML IN MEDIA AND ENTERTAINMENT
-
AI/ML in Media and Entertainment Market, BY END USER, 2018–2032 (USD MILLION)
-
ITALY AI/ML IN
-
AI/ML in Media and Entertainment Market, BY SOLUTION, 2018–2032 (USD MILLION)
-
TABLE
-
ITALY AI/AI/ML in Media and Entertainment Market, BY APPLICATION, 2018–2032
-
(USD MILLION)
-
ITALY AI/AI/ML in Media and Entertainment Market, BY END
-
USER, 2018–2032 (USD MILLION)
-
REST OF EUROPE AI/ML IN MEDIA
-
AI/ML in Media and Entertainment Market, BY SOLUTION, 2018–2032 (USD MILLION)
-
TABLE
-
REST OF EUROPE AI/AI/ML in Media and Entertainment Market, BY APPLICATION, 2018–2032
-
(USD MILLION)
-
REST OF EUROPE AI/AI/ML in Media and Entertainment Market,
-
BY END USER, 2018–2032 (USD MILLION)
-
ASIA-PACIFIC AI/ML IN MEDIA
-
AI/ML in Media and Entertainment Market, BY COUNTRY, 2018–2032 (USD MILLION)
-
TABLE 42
-
ASIA-PACIFIC AI/AI/ML in Media and Entertainment Market, BY SOLUTION, 2018–2032
-
(USD MILLION)
-
ASIA-PACIFIC AI/AI/ML in Media and Entertainment Market,
-
BY APPLICATION, 2018–2032 (USD MILLION)
-
ASIA-PACIFIC AI/ML IN
-
AI/ML in Media and Entertainment Market, BY END USER, 2018–2032 (USD MILLION)
-
TABLE
-
CHINA AI/AI/ML in Media and Entertainment Market, BY SOLUTION, 2018–2032 (USD
-
MILLION)
-
CHINA AI/AI/ML in Media and Entertainment Market, BY APPLICATION,
-
CHINA AI/ML IN MEDIA AND ENTERTAINMENT
-
AI/ML in Media and Entertainment Market, BY END USER, 2018–2032 (USD MILLION)
-
JAPAN AI/ML IN
-
AI/ML in Media and Entertainment Market, BY SOLUTION, 2018–2032 (USD MILLION)
-
TABLE
-
JAPAN AI/AI/ML in Media and Entertainment Market, BY APPLICATION, 2018–2032
-
(USD MILLION)
-
JAPAN AI/AI/ML in Media and Entertainment Market, BY END
-
USER, 2018–2032 (USD MILLION)
-
INDIA AI/ML IN MEDIA AND ENTERTAINMENT
-
AI/ML in Media and Entertainment Market, BY SOLUTION, 2018–2032 (USD MILLION)
-
INDIA AI/ML IN
-
AI/ML in Media and Entertainment Market, BY APPLICATION, 2018–2032 (USD MILLION)
-
INDIA AI/AI/ML in Media and Entertainment Market, BY END USER, 2018–2032
-
(USD MILLION)
-
SOUTH KOREA AI/AI/ML in Media and Entertainment Market,
-
BY SOLUTION, 2018–2032 (USD MILLION)
-
SOUTH KOREA AI/ML IN MEDIA
-
AI/ML in Media and Entertainment Market, BY APPLICATION, 2018–2032 (USD MILLION)
-
TABLE
-
SOUTH KOREA AI/AI/ML in Media and Entertainment Market, BY END USER, 2018–2032
-
(USD MILLION)
-
REST OF ASIA-PACIFIC AI/ML IN MEDIA AND ENTERTAINMENT
-
AI/ML in Media and Entertainment Market, BY SOLUTION, 2018–2032 (USD MILLION)
-
REST OF ASIA-PACIFIC
-
AI/AI/ML in Media and Entertainment Market, BY APPLICATION, 2018–2032 (USD MILLION)
-
REST OF ASIA-PACIFIC AI/AI/ML in Media and Entertainment Market, BY END
-
USER, 2018–2032 (USD MILLION)
-
REST OF THE WORLD AI/ML IN MEDIA
-
AI/ML in Media and Entertainment Market, BY COUNTRY, 2018–2032 (USD MILLION)
-
TABLE 61
-
REST OF THE WORLD AI/AI/ML in Media and Entertainment Market, BY SOLUTION, 2018–2032
-
(USD MILLION)
-
REST OF THE WORLD AI/AI/ML in Media and Entertainment Market,
-
BY APPLICATION, 2018–2032 (USD MILLION)
-
REST OF THE WORLD CAMERA
-
AI/ML in Media and Entertainment Market, BY END USER, 2018–2032 (USD MILLION)
-
MIDDLE EAST AI/ML
-
AI/ML in Media and Entertainment Market, BY SOLUTION, 2018–2032 (USD MILLION)
-
MIDDLE EAST AI/AI/ML in Media and Entertainment Market, BY APPLICATION,
-
MIDDLE EAST AI/ML IN MEDIA AND ENTERTAINMENT
-
AI/ML in Media and Entertainment Market, BY END USER, 2018–2032 (USD MILLION)
-
AFRICA AI/ML IN
-
AI/ML in Media and Entertainment Market, BY SOLUTION, 2018–2032 (USD MILLION)
-
TABLE
-
AFRICA AI/AI/ML in Media and Entertainment Market, BY APPLICATION, 2018–2032
-
(USD MILLION)
-
AFRICA AI/AI/ML in Media and Entertainment Market, BY END
-
USER, 2018–2032 (USD MILLION)
-
LATIN AMERICA AI/ML IN MEDIA AND
-
AI/ML in Media and Entertainment Market, BY SOLUTION, 2018–2032 (USD MILLION)
-
LATIN
-
AMERICA AI/AI/ML in Media and Entertainment Market, BY APPLICATION, 2018–2032
-
(USD MILLION)
-
LATIN AMERICA AI/AI/ML in Media and Entertainment Market,
-
BY END USER, 2018–2032 (USD MILLION)
-
BUSINESS EXPANSIONS/PRODUCT
-
LAUNCHES
-
PARTNERSHIPS/AGREEMENTS/CONTRACTS/COLLABORATIONS
-
TABLE
-
GEARHOUSE SOUTH AFRICA PTY LTD : PRODUCTS OFFERED
-
GEARHOUSE SOUTH
-
AFRICA PTY LTD : KEY DEVELOPMENT
-
GRAVITY MEDIA : PRODUCTS OFFERED
-
GRAVITY MEDIA : KEY DEVELOPMENT
-
GRAYMETA : PRODUCTS OFFERED
-
GRAYMETA : KEY DEVELOPMENT
-
IBM CORPORATION : PRODUCTS OFFERED
-
IBM CORPORATION : KEY DEVELOPMENT
-
LMG LLC : PRODUCTS OFFERED
-
LMG LLC : KEY DEVELOPMENT
-
MATCHROOM SPORT LTD. : PRODUCTS
-
OFFERED
-
MATCHROOM SPORT LTD. : KEY DEVELOPMENT
-
PRODUCTION
-
RESOURCE GROUP, L.L.C : PRODUCTS OFFERED
-
PRODUCTION RESOURCE GROUP,
-
L.L.C : KEY DEVELOPMENT
-
SYNTHESIA LTD : PRODUCTS OFFERED
-
TABLE
-
SYNTHESIA LTD : KEY DEVELOPMENT
-
VERITONE, INC. : PRODUCTS OFFERED
-
VERITONE, INC. : KEY DEVELOPMENT
-
TAIT : PRODUCTS OFFERED
-
TAIT : KEY DEVELOPMENT
-
INTELLIMIZE : PRODUCTS OFFERED
-
INTELLIMIZE : KEY DEVELOPMENT
-
VALOSSA LABS LTD : PRODUCTS
-
OFFERED
-
VALOSSA LABS LTD : KEY DEVELOPMENT
-
LIST OF FIGURES
-
MARKET ATTRACTIVENESS ANALYSIS: GLOBAL AI/ML IN MEDIA AND ENTERTAINMENT
-
MARKET
-
GLOBAL AI/ML IN MEDIA AND ENTERTAINMENT MARKET: MARKET STRUCTURE
-
BOTTOM-UP AND TOP-DOWN APPROACHES
-
NORTH AMERICA: AI/ML
-
IN MEDIA AND ENTERTAINMENT MARKET SIZE (USD MILLION) & MARKET SHARE (%), BY
-
COUNTRY (2022 VS 2032)
-
EUROPE: AI/ML IN MEDIA AND ENTERTAINMENT MARKET
-
SIZE (USD MILLION) & MARKET SHARE (%), BY COUNTRY (2022 VS 2032)
-
FIGURE
-
ASIA–PACIFIC: AI/ML IN MEDIA AND ENTERTAINMENT MARKET SIZE (USD MILLION)
-
& MARKET SHARE (%), BY COUNTRY (2022 VS 2032)
-
GLOBAL AI/ML IN
-
MEDIA AND ENTERTAINMENT MARKET SIZE (USD MILLION) & MARKET SHARE (%), BY SOLUTION
-
(2022 VS 2032)
-
GLOBAL AI/ML IN MEDIA AND ENTERTAINMENT MARKET SIZE
-
(USD MILLION) & MARKET SHARE (%), BY APPLICATION (2022 VS 2032)
-
FIGURE
-
GLOBAL AI/ML IN MEDIA AND ENTERTAINMENT MARKET SIZE (USD MILLION) & MARKET
-
SHARE (%), BY END USER (2022 VS 2032)
-
MARKET DYNAMIC ANALYSIS OF
-
THE GLOBAL AI/ML IN MEDIA AND ENTERTAINMENT MARKET
-
DRIVER IMPACT
-
ANALYSIS
-
RESTRAINT IMPACT ANALYSIS
-
VALUE CHAIN: GLOBAL
-
AI/ML IN MEDIA AND ENTERTAINMENT MARKET
-
PORTER'S FIVE FORCES ANALYSIS
-
OF THE GLOBAL AI/ML IN MEDIA AND ENTERTAINMENT MARKET
-
GLOBAL AI/ML
-
AI/ML in Media and Entertainment Market, BY SOLUTION, 2022 (% SHARE)
-
GLOBAL
-
AI/AI/ML in Media and Entertainment Market, BY SOLUTION, 2022 VS 2032 (USD MILLION)
-
GLOBAL AI/AI/ML in Media and Entertainment Market, BY APPLICATION, 2022
-
(% SHARE)
-
GLOBAL AI/AI/ML in Media and Entertainment Market, BY APPLICATION,
-
GLOBAL AI/ML IN MEDIA AND ENTERTAINMENT
-
AI/ML in Media and Entertainment Market, BY END USER, 2022 (% SHARE)
-
GLOBAL AI/ML IN MEDIA AND ENTERTAINMENT
-
AI/ML in Media and Entertainment Market, BY END USER, 2022 VS 2032 (USD MILLION)
-
GLOBAL AI/ML IN MEDIA
-
AI/ML in Media and Entertainment Market, BY REGION, 2022 (% SHARE)
-
GLOBAL AI/ML
-
AI/ML in Media and Entertainment Market, BY REGION, 2022 VS 2032 (USD MILLION)
-
FIGURE
-
NORTH AMERICA AI/AI/ML in Media and Entertainment Market, BY COUNTRY, 2022 (% SHARE)
-
NORTH AMERICA AI/AI/ML in Media and Entertainment Market, BY COUNTRY, 2022
-
VS 2032 (USD MILLION)
-
NORTH AMERICA AI/ML IN MEDIA AND ENTERTAINMENT
-
AI/ML in Media and Entertainment Market, BY SOLUTION, 2022-2032 (USD MILLION)
-
NORTH AMERICA AI/ML
-
AI/ML in Media and Entertainment Market, BY APPLICATION, 2022-2032 (USD MILLION)
-
FIGURE
-
NORTH AMERICA AI/AI/ML in Media and Entertainment Market, BY END USER, 2022-2032
-
(USD MILLION)
-
EUROPE AI/AI/ML in Media and Entertainment Market, BY
-
COUNTRY, 2022 (% SHARE)
-
EUROPE AI/AI/ML in Media and Entertainment Market,
-
BY COUNTRY, 2022 VS 2032 (USD MILLION)
-
EUROPE AI/ML IN MEDIA AND
-
AI/ML in Media and Entertainment Market, BY SOLUTION, 2022-2032 (USD MILLION)
-
EUROPE
-
AI/AI/ML in Media and Entertainment Market, BY APPLICATION, 2022-2032 (USD MILLION)
-
EUROPE AI/AI/ML in Media and Entertainment Market, BY END USER, 2022-2032
-
(USD MILLION)
-
ASIA-PACIFIC AI/AI/ML in Media and Entertainment Market,
-
BY COUNTRY, 2022 (% SHARE)
-
ASIA-PACIFIC AI/ML IN MEDIA AND ENTERTAINMENT
-
AI/ML in Media and Entertainment Market, BY COUNTRY, 2022 VS 2032 (USD MILLION)
-
ASIA-PACIFIC AI/ML
-
AI/ML in Media and Entertainment Market, BY SOLUTION, 2022-2032 (USD MILLION)
-
FIGURE
-
ASIA-PACIFIC AI/AI/ML in Media and Entertainment Market, BY APPLICATION, 2022-2032
-
(USD MILLION)
-
ASIA-PACIFIC AI/AI/ML in Media and Entertainment Market,
-
BY END USER, 2022-2032 (USD MILLION)
-
REST OF THE WORLD AI/ML IN MEDIA
-
AI/ML in Media and Entertainment Market, BY COUNTRY, 2022 (% SHARE)
-
REST OF THE
-
WORLD AI/AI/ML in Media and Entertainment Market, BY COUNTRY, 2022 VS 2032 (USD MILLION)
-
REST OF THE WORLD AI/AI/ML in Media and Entertainment Market, BY SOLUTION,
-
REST OF THE WORLD AI/ML IN MEDIA AND ENTERTAINMENT
-
AI/ML in Media and Entertainment Market, BY APPLICATION, 2022-2032 (USD MILLION)
-
REST OF THE WORLD
-
AI/AI/ML in Media and Entertainment Market, BY END USER, 2022-2032 (USD MILLION)
-
GLOBAL AI/ML IN MEDIA AND ENTERTAINMENT MARKET: COMPETITIVE BENCHMARKING
-
VENDOR SHARE ANALYSIS (2022) (%)
-
GEARHOUSE SOUTH AFRICA
-
PTY LTD : FINANCIAL OVERVIEW SNAPSHOT
-
GEARHOUSE SOUTH AFRICA PTY
-
LTD : SWOT ANALYSIS
-
GRAVITY MEDIA : FINANCIAL OVERVIEW SNAPSHOT
-
GRAVITY MEDIA : SWOT ANALYSIS
-
GRAYMETA : FINANCIAL OVERVIEW
-
SNAPSHOT
-
GRAYMETA : SWOT ANALYSIS
-
IBM CORPORATION
-
: FINANCIAL OVERVIEW SNAPSHOT
-
IBM CORPORATION : SWOT ANALYSIS
-
LMG LLC : FINANCIAL OVERVIEW SNAPSHOT
-
LMG LLC : SWOT
-
ANALYSIS
-
MATCHROOM SPORT LTD. : FINANCIAL OVERVIEW SNAPSHOT
-
FIGURE
-
MATCHROOM SPORT LTD. : SWOT ANALYSIS
-
PRODUCTION RESOURCE GROUP,
-
L.L.C : FINANCIAL OVERVIEW SNAPSHOT
-
PRODUCTION RESOURCE GROUP, L.L.C
-
: SWOT ANALYSIS
-
SYNTHESIA LTD : FINANCIAL OVERVIEW SNAPSHOT
-
FIGURE
-
SYNTHESIA LTD : SWOT ANALYSIS
-
VERITONE, INC. : FINANCIAL OVERVIEW
-
SNAPSHOT
-
VERITONE, INC. : SWOT ANALYSIS
-
TAIT : FINANCIAL
-
OVERVIEW SNAPSHOT
-
TAIT : SWOT ANALYSIS
-
INTELLIMIZE
-
: FINANCIAL OVERVIEW SNAPSHOT
-
INTELLIMIZE : SWOT ANALYSIS
-
FIGURE
-
VALOSSA LABS LTD : FINANCIAL OVERVIEW SNAPSHOT
-
VALOSSA LABS LTD
-
: SWOT ANALYSIS


Leave a Comment