Ammonium Nitrate Market (2026 - 2035)

Ammonium Nitrate Market Research Report Information By Application (Explosives, Fertilizers, and Others), By End User (Construction, Mining, Quarry, Agriculture, and Others) And By Region (North America, Europe, Asia-Pacific, And Rest Of The World) - Forecast Till 2035
ID: MRFR/CnM/3821-HCR
111 Pages
Chitranshi Jaiswal
Last Updated: July 08, 2026
Ammonium Nitrate Market
Market Size
Forecast Period2026-2035
CAGR (2026-2035)4.7%
2025 Market SizeUSD 21,800 Million
2035 Market SizeUSD 34,500 Million
Key Players
Yara International
CF Industries
OCI Global
Orica Limited
Incitec Pivot
EuroChem Group
Opportunities
  • Low-Carbon Ammonium Nitrate for Premium Markets
  • African Fertilizer Manufacturing Hubs
  • Drone- and Sensor-Enabled Application Services

Ammonium Nitrate Market Summary

The global Ammonium Nitrate Market stood at an estimated USD 21,800 Million in 2025 and is projected to reach USD 22,820 Million by 2026, climbing to USD 34,500 Million by 2035 at a compound annual growth rate (CAGR) of 4.7% during the forecast period (2026–2035). Two forces are pulling this trajectory upward: tightening carbon-border adjustment mechanisms across the EU and North America that reward low-emission feedstock producers, and a sustained cycle of copper, lithium, and nickel mine development in South America and sub-Saharan Africa that is driving bulk explosive demand [1][2]. These catalysts are supported by national food-security mandates in India and Southeast Asia that continue to underpin fertilizer consumption volumes.

Precision-agriculture platforms are reshaping how ammonium nitrate reaches the field. Variable-rate application systems now guide coated-granule placement within centimeters, reducing per-hectare nitrogen waste by up to 18% while sustaining yield targets [3]. Blue and green ammonia facilities — with an estimated USD 14 billion in committed capital globally through 2030 — are beginning to alter the upstream cost curve for nitrate production, giving producers who invest early a carbon-intensity advantage under emerging embedded-carbon reporting frameworks [4].

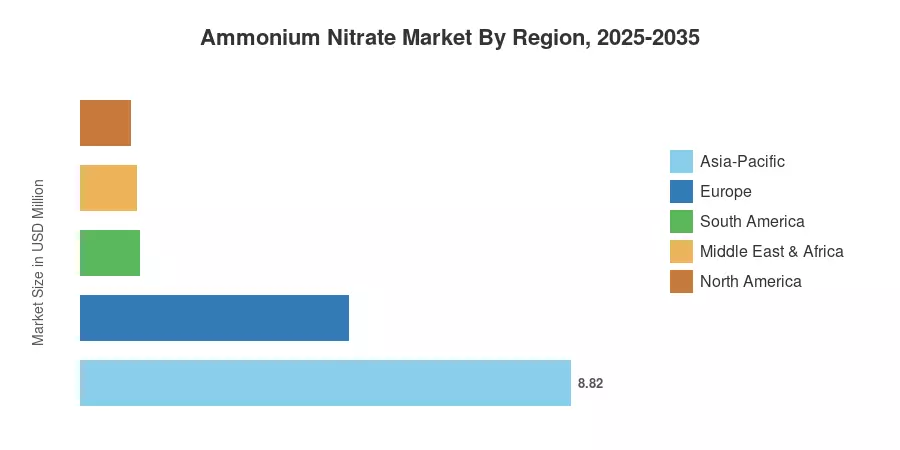
Asia-Pacific commands approximately 42% of the Ammonium Nitrate Market, anchored by China's and India's combined agricultural demand and a growing mining sector in Indonesia and Australia. The region also posts the fastest projected CAGR at 5.4%. Europe holds the second-largest share at roughly 23%, driven by established agrochemical supply chains in France, Germany, and Russia, though tighter EU REACH amendments are adding compliance costs. Africa and South America are the dark-horse regions to watch — new mine openings and fertilizer subsidy programs should accelerate volume growth beyond 2028.


Key Report Takeaways

• By Application

  • Fertilizers accounted for the dominant application share of the Ammonium Nitrate Market in 2025, reflecting entrenched use in row-crop and cereal programs worldwide.
  • The explosives segment is forecast to expand at a CAGR of 5.3% through 2035, fueled by deeper ore-body mining in copper and rare-earth projects.


• By Grade

  • Fertilizers accounted for the dominant application share of the Ammonium Nitrate Market in 2025, reflecting entrenched use in row-crop and cereal programs worldwide.
  • The explosives segment is forecast to expand at a CAGR of 5.3% through 2035, fueled by deeper ore-body mining in copper and rare-earth project
  • Agricultural grade captured the leading share of the Ammonium Nitrate Market by grade in 2025, while industrial grade is tracking the fastest growth trajectory.

• By Form

  • Porous prills held roughly 55% of total volume in 2025, driven by cost-effective production and broad compatibility with bulk blending systems.
  • The granular segment is set to register a CAGR of 6.1% as precision-agriculture coatings gain traction.


• By End-User

  • Porous prills held roughly 55% of total volume in 2025, driven by cost-effective production and broad compatibility with bulk blending systems.
  • The granular segment is set to register a CAGR of 6.1% as precision-agriculture coatings gain traction.
  • Agriculture represented the largest end-user segment of the Ammonium Nitrate Market, whereas mining is advancing at the highest end-user CAGR through 2035.

• By Region

  • Asia-Pacific held the dominant Ammonium Nitrate Market share in 2025, supported by high-volume fertilizer consumption in China and India.
  • South America is emerging as a high-growth corridor, driven by Brazilian soybean expansion and Chilean copper mine development.


Market Size and Forecast (2021–2035)

Market Research Future compiled historical revenue data from customs-trade databases, company annual reports, and industry associations for 2021–2024. Forecast values (2026–2035) apply a calibrated 4.7% CAGR, cross-referenced against IFA nitrogen-demand models and World Bank commodity price projections [1][5].
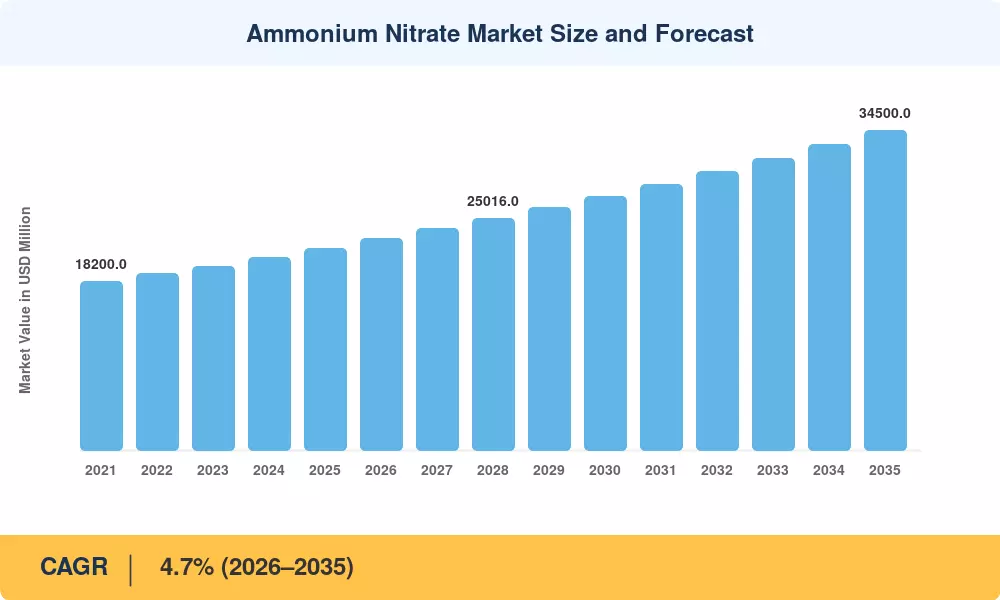
Ammonium Nitrate Market Size and Forecast
Our Impact
Enabled $4.3B Revenue Impact for Fortune 500 and Leading Multinationals
Partnering with 2000+ Global Organizations Each Year
30K+ Citations by Top-Tier Firms in the Industry

Driver Impact Analysis

Driver ~% Impact on CAGR Geographic Relevance Impact Timeline
Expanding global crop acreage and food-security mandates +1.3% Asia-Pacific, South America Long-term (≥4 yr)
Deep-ore mining capex cycle (copper, lithium, nickel) +0.9% South America, Africa, Asia-Pacific Medium-term (2–4 yr)
Green and blue ammonia feedstock investment +0.7% Europe, Middle East Long-term (≥4 yr)
Precision-agriculture adoption driving coated-granule demand +0.5% North America, Europe Medium-term (2–4 yr)
Infrastructure and defense stockpiling programs +0.4% North America, Asia-Pacific Short-term (≤2 yr)
Carbon-border adjustment mechanisms rewarding low-emission production +0.3% Europe, North America Medium-term (2–4 yr)
Emerging-market fertilizer subsidy reforms +0.3% India, Sub-Saharan Africa Short-term (≤2 yr)


Expanding Crop Acreage and Food-Security Mandates

Global harvested area expanded by roughly 4.2 million hectares between 2022 and 2024, with India's PM-KISAN program alone distributing direct benefit transfers to over 110 million farming households to encourage input adoption [1]. This program sustains baseline demand for the Ammonium Nitrate Market regardless of commodity price swings.

Deep-Ore Mining Capital Expenditure Cycle

Recent industry research indicates that mining companies would invest more than USD 45 billion on copper projects between 2025 and 2030, with the majority of this spending taking place in Chile, Peru, the DRC and Indonesia. Every new underground mine needs large quantities of bulk explosives, typically 0.3 to 0.5 kilograms of ammonium-nitrate-based emulsion per tonne of ore moved. This capex wave gives a non-agricultural development path to the Ammonium Nitrate Market in the long run.


Green and Blue Ammonia Feedstock Investment

Globally, there are about 60 green and blue ammonia projects in various phases of development, funded by around USD 14 billion in declared investment through to 2030 [4]. Projects in Saudi Arabia (NEOM), Norway (Yara Clean Ammonia) and Australia (Fortescue) are trying to manufacture low-carbon ammonia that goes directly into nitrate manufacturing. Locking in this feedstock provides producers with a competitive edge in the face of EU CBAM and other comparable carbon-pricing schemes, altering the cost structure of the Ammonium Nitrate Market.


Precision-Agriculture Coated-Granule Demand

Precision-agriculture technologies are currently in use on over 65% of US corn land, and adoption is accelerating rapidly in Brazil and Australia [3], according to the USDA. Variable rate nitrogen treatment in combination with polymer-coated ammonium nitrate granules reduces runoff losses by 15-20% without reduction in crop yields, a combination that meets both economic and environmental goals. The industry is witnessing a technological transition towards high-value product forms in the Ammonium Nitrate Market.


Restraints Impact Analysis

Restraint ~% Impact on CAGR Geographic Relevance Impact Timeline
Regulatory restrictions on ammonium nitrate storage and transport −0.5% Europe, North America Short-term (≤2 yr)
Substitution by urea and UAN solutions in certain cropping systems −0.4% South America, South Asia Medium-term (2–4 yr)
Volatile natural gas feedstock costs −0.3% Europe, Asia-Pacific Short-term (≤2 yr)
Environmental regulations on nitrogen runoff −0.3% Europe, North America Long-term (≥4 yr)
Geopolitical trade disruptions and export bans −0.2% Global Short-term (≤2 yr)


Storage and Transport Regulations

Following several high-profile incidents, jurisdictions across the EU, Australia, and North America have imposed stricter licensing, quantity limits, and site-security requirements on ammonium nitrate warehousing [11]. The EU's revised Seveso III directive reclassified storage thresholds downward in 2012, forcing mid-tier distributors to invest in compliance infrastructure or exit the supply chain entirely. These regulatory layers add an estimated 8–12% to logistics costs in affected regions, compressing margins across the Ammonium Nitrate Market.

Substitution Pressure from Urea and UAN Solutions

In tropical and subtropical cropping systems, especially Brazilian sugarcane and Indian rice paddies, urea provides a cheaper source of nitrogen with fewer handling constraints [12]. Urea accounts for more than 55% of worldwide nitrogen-fertilizer usage, and the discount of USD 30-60 per tonne over ammonium nitrate in many Asian spot markets limits the upside for the Ammonium Nitrate Market in price-sensitive agrarian nations.


Volatile Natural Gas Feedstock Costs

Natural gas constitutes 70 to 80% of the variable production cost in the typical ammonium nitrate process. European gas prices were extremely volatile throughout 2022-2024, with TTF spot prices ranging from EUR 25 to EUR 130/MWh, leading some EU producers to temporarily cut their production [7]. Prices have been stable, but the Ammonium Nitrate Market remains susceptible to any future supply interruptions.


Ammonium Nitrate Market Opportunities

Low-Carbon Ammonium Nitrate for Premium Markets

Producers that integrate green ammonia into their feedstock mix can label finished product as "low-carbon AN," commanding a 10–15% price premium from sustainability-conscious agricultural cooperatives and mining operators in Europe and Australasia. Early movers in the Ammonium Nitrate Market are already securing offtake agreements tied to embedded-carbon certificates.

African Fertilizer Manufacturing Hubs

Sub-Saharan Africa imports over 90% of its fertilizer requirements. Nigeria, Ethiopia, and Tanzania have earmarked land for integrated ammonia-urea-AN complexes, presenting a significant greenfield opportunity for the Ammonium Nitrate Market.

Drone- and Sensor-Enabled Application Services

Drone-based fertilizer spreading is expanding rapidly in Japan, South Korea, and parts of China, with the global agricultural drone fleet projected to exceed 500,000 units by 2030 [15]. This technology favors granular and coated products with consistent particle-size distribution — a product class where ammonium nitrate manufacturers can differentiate. New "application-as-a-service" business models allow AN producers to capture downstream margin by bundling product with precision delivery.

Emulsion Explosives for Underground Mining

The shift from open-pit to underground extraction in mature copper and gold districts across Australia, Canada, and Chile is driving demand for site-mixed emulsion explosives that use porous-prill ammonium nitrate as the oxidizer. This migration creates a recurring high-volume sales channel for the Ammonium Nitrate Market that is less price-sensitive than agricultural buyers.

Data-Driven Supply-Chain Platforms

Digital platforms that match regional AN supply with seasonal agricultural demand peaks can reduce distributor inventory carrying costs by 15–20% . Several start-ups in India and Brazil are piloting marketplace models that connect producers directly with farming cooperatives, bypassing traditional multi-tier distribution. Success here would open a new services-revenue stream adjacent to the core Ammonium Nitrate Market.


Ammonium Nitrate Market Future Outlook

Decarbonized Feedstock Transformation

By 2030, the IEA projects that global low-carbon ammonia capacity will reach 15 million tonnes annually, up from fewer than 1 million tonnes in 2024 [4]. Ammonium Nitrate Market incumbents that secure green-ammonia offtake early will benefit from both carbon-credit revenue and preferential procurement by ESG-mandated agricultural cooperatives.

Autonomous Mining and Smart Blasting

Autonomous haulage systems are already operational at over 40 mine sites globally, and the integration of AI-driven blast-design software is expected to optimize explosive consumption per tonne of ore by 10–15% over the next decade [17]. While this efficiency gain marginally reduces per-blast AN volumes, it expands total addressable mining activity by making previously uneconomic ore bodies viable — a net positive for the Ammonium Nitrate Market.

Digital Agriculture and Nutrient Stewardship

The FAO's Global Soil Partnership is pushing for mandatory nutrient management plans, which would require auditable nitrogen-application records [13]. This regulatory push accelerates the adoption of connected fertilizer spreaders and coated AN granules with traceable batch coding — embedding the Ammonium Nitrate Market more deeply into farm-level digital ecosystems.

Circular-Economy Integration

Emerging processes that recover ammonium nitrate from industrial wastewater and flue-gas scrubbing are moving from pilot to demonstration scale in Europe and Japan [18]. While circular-economy AN is unlikely to exceed 3–5% of total supply by 2035, it introduces a new feedstock pathway that diversifies the Ammonium Nitrate Market supply chain and aligns with extended producer responsibility regulations.


Ammonium Nitrate Market Segmentation

By Application

Segment Key Metric Primary Demand Driver
Fertilizers ~70% share (2025) Global crop-nutrient programs; staple-food production
Explosives 5.3% CAGR (2026–2035) Mining capex expansion; infrastructure tunneling
Other Applications USD 1,530 Million (2025) Specialty chemicals; gas-generating compounds


Fertilizers remain the backbone of the Ammonium Nitrate Market, driven by the compound's 34% nitrogen content and rapid plant uptake characteristics. Demand correlates closely with global cereal acreage, which the FAO projects to grow at 0.8% annually through 2035 [1]. The explosives segment, though smaller by volume, delivers higher per-tonne margins and is less susceptible to seasonal demand swings, making it a strategic priority for integrated producers.

By Form

Segment Key Metric Primary Demand Driver
Porous Prills ~55% share (2025) Cost-effective oxidizer for emulsion explosives
Granular 6.1% CAGR (2026–2035) Precision-agriculture coated products
Liquid Solution/Suspension USD 2,180 Million (2025) Fertigation systems; specialty crop nutrition


Porous prills dominate the Ammonium Nitrate Market by form because they serve dual purposes — both as a direct-application fertilizer and as the oxidizer component in ANFO and emulsion blasting agents. Granular products are gaining ground rapidly as polymer-coating technologies improve controlled-release performance, reducing application frequency from three passes to one in many temperate-cereal rotations.

By Grade

Segment Key Metric Primary Demand Driver
Agricultural Grade ~72% share (2025) Broad-acre fertilizer programs
Industrial Grade 5.3% CAGR (2026–2035) Mining, defense, and construction blasting


Agricultural grade leads the Ammonium Nitrate Market by a wide margin, reflecting the compound's established role in nitrogen-fertilizer blends across Europe, Oceania, and parts of Asia. Industrial-grade AN, produced to tighter density and porosity specifications, is tracking faster growth as mining operators seek higher-energy oxidizers for increasingly deep and hard-rock extraction.

By End-User Industry

Segment Key Metric Primary Demand Driver
Agriculture ~72% share (2025) Food production; government subsidy schemes
Mining 5.7% CAGR (2026–2035) Copper, lithium, nickel extraction boom
Defense USD 870 Million (2025) Munitions modernization; stockpile replenishment
Other End-User Industries 3.9% CAGR (2026–2035) Construction demolition; specialty chemical synthesis


Agriculture anchors the Ammonium Nitrate Market end-user landscape, but mining is closing the gap in growth-rate terms. The critical-minerals supercycle — driven by electrification and battery supply-chain buildouts — is expanding blasting-agent demand at mine sites from the Australian Pilbara to the Chilean Atacama. Defense procurement, while smaller in volume, provides counter-cyclical stability to producers with government contract portfolios.


Regional Market Share Analysis

Region Key Metric Primary Investment Themes
Asia-Pacific ~42% share (2025) Food-security subsidies; mining expansion in Indonesia and Australia
Europe ~23% share (2025) Low-carbon production; REACH compliance upgrades
North America 4.3% CAGR (2026–2035) Precision agriculture; defense stockpiling
South America 5.1% CAGR (2026–2035) Mining capex in Chile and Peru; soybean acreage growth
Middle East & Africa USD 1,960 Million (2025) Greenfield AN plants; fertilizer import substitution
Total USD 21,800 Million (2025)

The Ammonium Nitrate Market spans five major regions, with Asia-Pacific dominating both volume and growth. The table below summarizes regional standing.


North America

Country Key Metric Key Driver
US ~68% of regional share Large-scale corn belt fertilizer demand; defense procurement
Canada 4.5% CAGR Potash-belt adjacent AN blending; western mining activity
Mexico USD 340 Million (2025) Growing irrigated agriculture in Sinaloa and Sonora


North America's Ammonium Nitrate Market benefits from a mature distribution network and proximity to low-cost natural gas in the US Gulf Coast. The US Department of Defense's munitions modernization program, which earmarked USD 21 billion across FY 2024–2028, sustains a steady industrial-grade offtake channel independent of agricultural cycles [9].

Europe

Country Key Metric Key Driver
Germany ~15% of regional share Intensive cereal farming; Haber-Bosch legacy production
UK 3.8% CAGR Post-Brexit agricultural subsidy restructuring
France USD 780 Million (2025) Major wheat and barley producer
Italy ~8% of regional share Mediterranean horticulture
Spain 4.0% CAGR Olive and citrus nitrogen programs
Nordic Countries USD 410 Million (2025) Yara-anchored production base
Russia ~22% of regional share Major exporter; low-cost gas feedstock
Rest of Europe 3.6% CAGR Eastern European farm modernization


The European Ammonium Nitrate Market is shaped by the interplay between strict safety regulations and ambitious decarbonization targets. The EU Carbon Border Adjustment Mechanism, entering full implementation by 2026, will impose levies on AN imports with high embedded carbon, giving domestic green-ammonia-linked producers a structural edge [2][11].

Asia-Pacific

Country Key Metric Key Driver
China ~38% of regional share World's largest fertilizer consumer; coal-based AN production
India 5.8% CAGR Government fertilizer subsidies; expanding crop intensity
Japan USD 520 Million (2025) High-value horticulture; drone-based application growth
South Korea ~4% of regional share Controlled-release AN for greenhouse crops
ASEAN 5.5% CAGR Palm oil and rice cultivation expansion
Rest of Asia-Pacific USD 870 Million (2025) Mining growth in Australia and Central Asia


Asia-Pacific's dominance of the Ammonium Nitrate Market rests on sheer agricultural volume — China and India alone account for over 35% of global nitrogen-fertilizer consumption. India's nutrient-based subsidy (NBS) policy, revised in 2024, increased the per-tonne subsidy for complex fertilizers containing ammonium nitrate, directly incentivizing domestic production expansion [10].

South America

Country Key Metric Key Driver
Brazil ~58% of regional share Soybean and corn double-cropping; Cerrado expansion
Argentina 4.8% CAGR Vaca Muerta gas enabling low-cost AN production
Rest of South America USD 290 Million (2025) Chilean and Peruvian mining explosive demand


South America's Ammonium Nitrate Market is bifurcated between agricultural demand in Brazil and Argentina and mining-explosive demand along the Andean belt. Chile's Codelco and Peru's Antamina operations alone consume an estimated 800,000 tonnes of AN-based explosives annually.

Middle East & Africa

Country Key Metric Key Driver
Saudi Arabia ~22% of regional share Gas-advantaged production for export
UAE 4.6% CAGR Trading hub; re-export to East Africa
South Africa USD 430 Million (2025) Platinum and gold mining explosive demand
Egypt ~14% of regional share Nile Delta agriculture; Abu Qir production complex
Rest of MEA 5.2% CAGR Greenfield fertilizer projects in Nigeria, Ethiopia


The Middle East & Africa Ammonium Nitrate Market is characterized by extreme divergence: Gulf states leverage cheap gas to produce AN for export, while sub-Saharan nations rely almost entirely on imports. The African Development Bank's Feed Africa initiative, targeting USD 4 billion in agricultural investment by 2030, could catalyze local production capacity [14].


Ammonium Nitrate Market By Region, 2025-2035

Competitive Benchmarking

The Ammonium Nitrate Market exhibits medium concentration, with the top five producers estimated to hold roughly 35–42% of global revenue. An approximate Herfindahl-Hirschman Index (HHI) in the range of 800–1,100 suggests a moderately competitive structure. Large integrated players compete on feedstock cost advantages and global distribution reach, while regional specialists target niche mining and defense channels.

Company Est. Revenue Share Range Key Offerings Strategic Positioning
Yara International ~8–11% Agricultural AN, CAN, green ammonia projects Vertically integrated; low-carbon leadership
CF Industries ~7–10% AN, UAN, ammonia; North American production base Gas-cost-advantaged US Gulf producer
OCI Global ~5–8% AN, CAN, methanol; European and MENA operations Dual-market fertilizer and industrial supplier
Orica Limited ~5–7% AN-based explosives; smart blasting systems Mining-services integrated model
Incitec Pivot (Dyno Nobel) ~4–6% Porous prills, emulsion explosives, initiating systems Asia-Pacific and Americas mining focus
EuroChem Group ~4–6% AN, NPK blends; large-scale production in Russia and Belgium Low-cost production; emerging-market distribution
ENAEX S.A. ~3–5% Bulk explosives, detonation systems South American mining specialist
Austin Powder ~2–4% Custom blasting solutions; site-mixed services Niche underground mining provider
Uralchem ~3–5% AN, urea; Russian production facilities Volume exporter to Asia and South America
Deepak Fertilisers (DFPCL) ~2–4% AN, technical ammonium nitrate; Indian production Domestic Indian market leader; mining-grade specialist


Recent News & Developments

  • Yara International (September 2024): Initiated a comprehensive Fixed Cost and Capex Reduction Program to optimize corporate returns by restricting early growth projects and scaling down tail-return assets while focusing capital strictly on lower-emission ammonia facilities.
  • CF Industries (June 2024): Secured a 15-year blue-hydrogen supply agreement with ExxonMobil at its Donaldsonville, Louisiana complex, positioning the site as the largest low-carbon AN production hub in North America [19].
  • Orica Limited (March 2024): Launched its 4D bulk explosives system incorporating real-time blast-hole sensing, enabling 12% improvement in fragmentation efficiency for open-pit copper mines in Chile [17].


  • ENAEX S.A. (November 2023): Commissioned a 350,000 tonne-per-year porous-prill plant in Mejillones, Chile, increasing its capacity to serve the Atacama mining corridor.


Ammonium Nitrate Market Report Scope

Parameter Detail
Market Scope Global Ammonium Nitrate Market — fertilizers, explosives, and other applications
Study Period 2021–2035
CAGR (Forecast Period) 4.7% (2026–2035)
Market Size (2025) USD 21,800 Million
Market Size (2035) USD 34,500 Million
Fastest Growing Segment Granular (by form; 6.1% CAGR); Mining (by end-user; 5.7% CAGR)
Companies Profiled 10 major players including Yara, CF Industries, OCI, Orica, Incitec Pivot, EuroChem, ENAEX, Austin Powder, Uralchem, Deepak Fertilisers
Valuation Currency USD Million


FAQs

How does natural gas price volatility affect ammonium nitrate procurement contracts?
Gas represents 70–80% of variable production cost, so spot-price swings translate almost directly into AN price fluctuations. Buyers increasingly secure fixed-price contracts of 6–12 months or source from gas-advantaged regions like the US Gulf Coast to hedge exposure [7].
What safety certifications should buyers verify when sourcing industrial-grade ammonium nitrate?
Buyers should confirm compliance with UN Transport Classification 5.1, local Seveso III or equivalent storage thresholds, and supplier adherence to the International Fertilizer Association's product stewardship code [11].
How does the Ammonium Nitrate Market differ in pricing between agricultural and industrial grades?
Premium technical-grade Low-Density Ammonium Nitrate commands a 15–25% market premium over standard agricultural High-Density formulations due to its customized structural porosity, engineered oil absorption rates, and rigorous explosive-application quality testing.
Which emerging mining regions will drive the highest incremental demand for the Ammonium Nitrate Market by 2030?
The DRC's copper-cobalt belt and Indonesia's nickel laterite corridor are expected to generate the largest incremental explosive demand, supported by over USD 20 billion in committed mining capex [8].
Can the Ammonium Nitrate Market benefit from carbon-credit monetization?
Producers using green ammonia feedstock can generate verified carbon credits under EU ETS or voluntary registries, offsetting 40–60% of the green-premium cost and improving buyer economics [4].
What logistics considerations impact the total cost of ownership for ammonium nitrate?
AN requires climate-controlled warehousing, security perimeters, and regulatory permits at each storage node, adding 8–12% to delivered cost compared to urea in regulated markets [11].
How is the Ammonium Nitrate Market positioned relative to alternative nitrogen sources for specialty crops?
AN delivers nitrogen in both ammonium and nitrate forms, providing faster plant uptake than urea alone — an advantage in high-value horticulture where rapid nutrient availability justifies the price premium [12].    
Author
Author
Author Profile
Chitranshi Jaiswal LinkedIn
Team Lead - Research
Chitranshi is a Team Leader in the Chemicals & Materials (CnM) and Energy & Power (EnP) domains, with 6+ years of experience in market research. She leads and mentors teams to deliver cross-domain projects that equip clients with actionable insights and growth strategies. She is skilled in market estimation, forecasting, competitive benchmarking, and both primary & secondary research, enabling her to turn complex data into decision-ready insights. An engineer and MBA professional, she combines technical expertise with strategic acumen to solve dynamic market challenges. Chitranshi has successfully managed projects that support market entry, investment planning, and competitive positioning, while building strong client relationships. Certified in Advanced Excel & Power BI she leverages data-driven approaches to ensure accuracy, clarity, and impactful outcomes.

Research Approach


Secondary Research

The secondary research process involved comprehensive analysis of regulatory databases, chemical industry publications, agricultural statistics, mining safety reports, and authoritative governmental and international organizations. Key sources included the US Geological Survey (USGS), US Department of Agriculture (USDA), National Institute for Occupational Safety and Health (NIOSH), Bureau of Alcohol, Tobacco, Firearms and Explosives (ATF), US Environmental Protection Agency (EPA), European Chemicals Agency (ECHA), European Fertilizer Association (Fertilizers Europe), Food and Agriculture Organization of the United Nations (FAO), International Fertilizer Association (IFA), US Census Bureau Construction Spending Reports, Mine Safety and Health Administration (MSHA), International Monetary Fund (IMF) Commodity Price Data, World Bank Commodity Markets Outlook, Organization for Economic Co-operation and Development (OECD) Agricultural Statistics, and national mining ministries and agricultural departments from key producing and consuming countries.

These sources were employed to gather data on production capacity, regulatory compliance requirements, safety incident statistics, agricultural consumption trends, explosives usage in mining operations, trade flow analysis, and market landscape assessment for ammonium nitrate in a variety of industrial, explosive, and fertilizer applications.


Primary Research

Qualitative and quantitative insights were obtained by interviewing supply-side and demand-side stakeholders during the primary research process. CEOs, VPs of Operations, plant managers, regulatory compliance officers, and commercial directors from ammonium nitrate manufacturers, chemical producers, and explosives companies comprised supply-side sources. Procurement heads from large-scale agricultural cooperatives, mining operations managers, quarry supervisors, construction project directors, and fertilizer distributors constituted demand-side sources. Market segmentation was validated across explosives and fertilizer applications through primary research, production capacity expansion timelines were confirmed, and insights regarding regulatory compliance costs, pricing volatility patterns, seasonal demand fluctuations, and safety protocol implementations were gathered.

Primary Respondent Breakdown:

By Designation: C-level Primaries (32%), Director Level (30%), Others (38%)

By Region: North America (32%), Europe (30%), Asia-Pacific (28%), Rest of World (10%)


Market Size Estimation

Production capacity mapping and consumption volume analysis were employed to determine the global market valuation in key end-use industries. The methodology comprised the following:

Identification of over 50 significant manufacturers and producers in North America, Europe, Asia-Pacific, Latin America, and the Middle East and Africa

Product mapping for explosive-grade formulations, low-density ammonium nitrate, ammonium nitrate solution, and high-density ammonium nitrate

Examination of the annual revenues of ammonium nitrate product divisions, as reported and modeled

Coverage of manufacturers that account for 65-70% of the global production capacity in 2024

Derive segment-specific valuations for fertilizers, pyrotechnics, and other industrial applications through extrapolation using bottom-up (consumption volume × ASP by application and region) and top-down (manufacturer revenue validation) approaches.

Download Free Sample

Kindly complete the form below to receive a free sample of this Report

Download PDF ×

We do not share your information with anyone. However, we may send you emails based on your report interest from time to time. You may contact us at any time to opt-out.

















