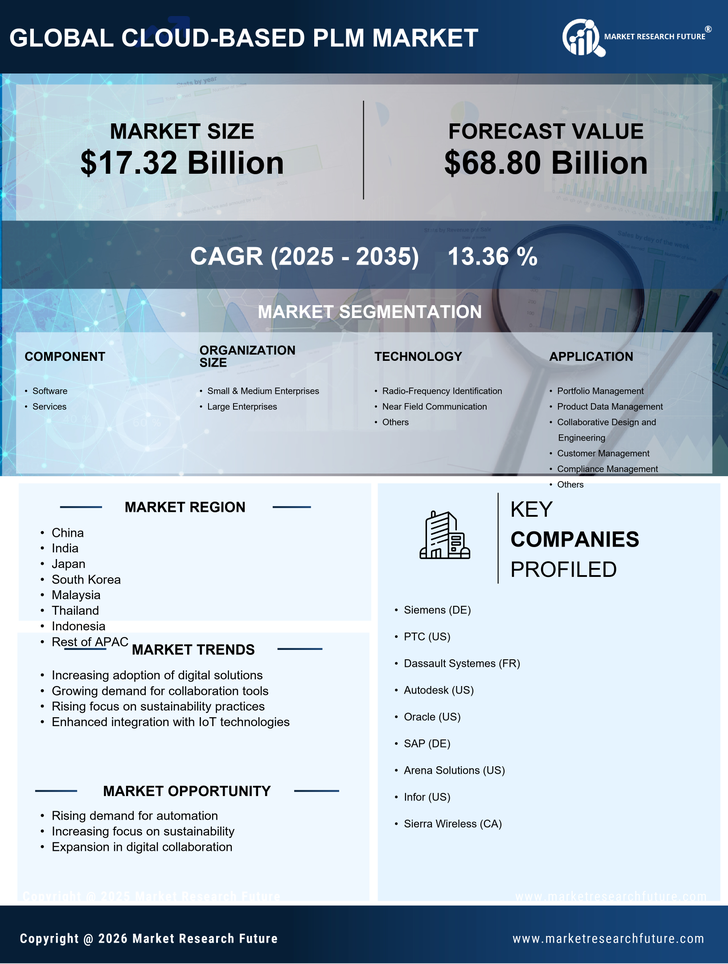
Request Free Sample ×

Kindly complete the form below to receive a free sample of this Report

* Please use a valid business email

Leading companies partner with us for data-driven Insights

clients tt-cursor
Hero Background

APAC Cloud Based PLM Market

ID: MRFR/ICT/57474-HCR
200 Pages
Ankit Gupta
Last Updated: April 24, 2026
APAC Cloud Based PLM Market Research Report: By Component (Software, Services), By Organization Size (Small & Medium Enterprises, Large Enterprises), By Technology (Radio-Frequency Identification, Near Field Communication, Others), By Application (Portfolio Management, Product Data Management, Collaborative Design and Engineering, Customer Management, Compliance Management, Others) and By Regional (China, India, Japan, South Korea, Malaysia, Thailand, Indonesia, Rest of APAC) - Forecast to 2035.
Download PDF ×

We do not share your information with anyone. However, we may send you emails based on your report interest from time to time. You may contact us at any time to opt-out.

  1. 1 SECTION I: EXECUTIVE SUMMARY AND KEY HIGHLIGHTS
    1. 1.1 EXECUTIVE SUMMARY
      1. 1.1.1 Market Overview
      2. 1.1.2 Key Findings
      3. 1.1.3 Market Segmentation
      4. 1.1.4 Competitive Landscape
      5. 1.1.5 Challenges and Opportunities
      6. 1.1.6 Future Outlook
  2. 2 SECTION II: SCOPING, METHODOLOGY AND MARKET STRUCTURE
    1. 2.1 MARKET INTRODUCTION
      1. 2.1.1 Definition
      2. 2.1.2 Scope of the study
        1. 2.1.2.1 Research Objective
        2. 2.1.2.2 Assumption
        3. 2.1.2.3 Limitations
    2. 2.2 RESEARCH METHODOLOGY
      1. 2.2.1 Overview
      2. 2.2.2 Data Mining
      3. 2.2.3 Secondary Research
      4. 2.2.4 Primary Research
        1. 2.2.4.1 Primary Interviews and Information Gathering Process
        2. 2.2.4.2 Breakdown of Primary Respondents
      5. 2.2.5 Forecasting Model
      6. 2.2.6 Market Size Estimation
        1. 2.2.6.1 Bottom-Up Approach
        2. 2.2.6.2 Top-Down Approach
      7. 2.2.7 Data Triangulation
      8. 2.2.8 Validation
  3. 3 SECTION III: QUALITATIVE ANALYSIS
    1. 3.1 MARKET DYNAMICS
      1. 3.1.1 Overview
      2. 3.1.2 Drivers
      3. 3.1.3 Restraints
      4. 3.1.4 Opportunities
    2. 3.2 MARKET FACTOR ANALYSIS
      1. 3.2.1 Value chain Analysis
      2. 3.2.2 Porter's Five Forces Analysis
        1. 3.2.2.1 Bargaining Power of Suppliers
        2. 3.2.2.2 Bargaining Power of Buyers
        3. 3.2.2.3 Threat of New Entrants
        4. 3.2.2.4 Threat of Substitutes
        5. 3.2.2.5 Intensity of Rivalry
      3. 3.2.3 COVID-19 Impact Analysis
        1. 3.2.3.1 Market Impact Analysis
        2. 3.2.3.2 Regional Impact
        3. 3.2.3.3 Opportunity and Threat Analysis
  4. 4 SECTION IV: QUANTITATIVE ANALYSIS
    1. 4.1 Information and Communications Technology, BY Component (USD Billion)
      1. 4.1.1 Software
      2. 4.1.2 Services
    2. 4.2 Information and Communications Technology, BY Organization Size (USD Billion)
      1. 4.2.1 Small & Medium Enterprises
      2. 4.2.2 Large Enterprises
    3. 4.3 Information and Communications Technology, BY Technology (USD Billion)
      1. 4.3.1 Radio-Frequency Identification
      2. 4.3.2 Near Field Communication
      3. 4.3.3 Others
    4. 4.4 Information and Communications Technology, BY Application (USD Billion)
      1. 4.4.1 Portfolio Management
      2. 4.4.2 Product Data Management
      3. 4.4.3 Collaborative Design and Engineering
      4. 4.4.4 Customer Management
      5. 4.4.5 Compliance Management
      6. 4.4.6 Others
    5. 4.5 Information and Communications Technology, BY End User (USD Billion)
      1. 4.5.1 Aerospace & Defense
      2. 4.5.2 Healthcare & Life Sciences
      3. 4.5.3 Retail & Consumer Goods
      4. 4.5.4 Energy & Utilities
      5. 4.5.5 Industrial Machinery & Heavy Equipment
      6. 4.5.6 Telecommunication & IT
      7. 4.5.7 Automotive & Transportation
      8. 4.5.8 Semiconductor & Electronics
      9. 4.5.9 Others
  5. 5 SECTION V: COMPETITIVE ANALYSIS
    1. 5.1 Competitive Landscape
      1. 5.1.1 Overview
      2. 5.1.2 Competitive Analysis
      3. 5.1.3 Market share Analysis
      4. 5.1.4 Major Growth Strategy in the Information and Communications Technology
      5. 5.1.5 Competitive Benchmarking
      6. 5.1.6 Leading Players in Terms of Number of Developments in the Information and Communications Technology
      7. 5.1.7 Key developments and growth strategies
        1. 5.1.7.1 New Product Launch/Service Deployment
        2. 5.1.7.2 Merger & Acquisitions
        3. 5.1.7.3 Joint Ventures
      8. 5.1.8 Major Players Financial Matrix
        1. 5.1.8.1 Sales and Operating Income
        2. 5.1.8.2 Major Players R&D Expenditure. 2023
    2. 5.2 Company Profiles
      1. 5.2.1 Siemens (DE)
        1. 5.2.1.1 Financial Overview
        2. 5.2.1.2 Products Offered
        3. 5.2.1.3 Key Developments
        4. 5.2.1.4 SWOT Analysis
        5. 5.2.1.5 Key Strategies
      2. 5.2.2 PTC (US)
        1. 5.2.2.1 Financial Overview
        2. 5.2.2.2 Products Offered
        3. 5.2.2.3 Key Developments
        4. 5.2.2.4 SWOT Analysis
        5. 5.2.2.5 Key Strategies
      3. 5.2.3 Dassault Systemes (FR)
        1. 5.2.3.1 Financial Overview
        2. 5.2.3.2 Products Offered
        3. 5.2.3.3 Key Developments
        4. 5.2.3.4 SWOT Analysis
        5. 5.2.3.5 Key Strategies
      4. 5.2.4 Autodesk (US)
        1. 5.2.4.1 Financial Overview
        2. 5.2.4.2 Products Offered
        3. 5.2.4.3 Key Developments
        4. 5.2.4.4 SWOT Analysis
        5. 5.2.4.5 Key Strategies
      5. 5.2.5 Oracle (US)
        1. 5.2.5.1 Financial Overview
        2. 5.2.5.2 Products Offered
        3. 5.2.5.3 Key Developments
        4. 5.2.5.4 SWOT Analysis
        5. 5.2.5.5 Key Strategies
      6. 5.2.6 SAP (DE)
        1. 5.2.6.1 Financial Overview
        2. 5.2.6.2 Products Offered
        3. 5.2.6.3 Key Developments
        4. 5.2.6.4 SWOT Analysis
        5. 5.2.6.5 Key Strategies
      7. 5.2.7 Arena Solutions (US)
        1. 5.2.7.1 Financial Overview
        2. 5.2.7.2 Products Offered
        3. 5.2.7.3 Key Developments
        4. 5.2.7.4 SWOT Analysis
        5. 5.2.7.5 Key Strategies
      8. 5.2.8 Infor (US)
        1. 5.2.8.1 Financial Overview
        2. 5.2.8.2 Products Offered
        3. 5.2.8.3 Key Developments
        4. 5.2.8.4 SWOT Analysis
        5. 5.2.8.5 Key Strategies
      9. 5.2.9 Sierra Wireless (CA)
        1. 5.2.9.1 Financial Overview
        2. 5.2.9.2 Products Offered
        3. 5.2.9.3 Key Developments
        4. 5.2.9.4 SWOT Analysis
        5. 5.2.9.5 Key Strategies
    3. 5.3 Appendix
      1. 5.3.1 References
      2. 5.3.2 Related Reports
  6. 6 LIST OF FIGURES
    1. 6.1 MARKET SYNOPSIS
    2. 6.2 APAC MARKET ANALYSIS BY COMPONENT
    3. 6.3 APAC MARKET ANALYSIS BY ORGANIZATION SIZE
    4. 6.4 APAC MARKET ANALYSIS BY TECHNOLOGY
    5. 6.5 APAC MARKET ANALYSIS BY APPLICATION
    6. 6.6 APAC MARKET ANALYSIS BY END USER
    7. 6.7 KEY BUYING CRITERIA OF INFORMATION AND COMMUNICATIONS TECHNOLOGY
    8. 6.8 RESEARCH PROCESS OF MRFR
    9. 6.9 DRO ANALYSIS OF INFORMATION AND COMMUNICATIONS TECHNOLOGY
    10. 6.10 DRIVERS IMPACT ANALYSIS: INFORMATION AND COMMUNICATIONS TECHNOLOGY
    11. 6.11 RESTRAINTS IMPACT ANALYSIS: INFORMATION AND COMMUNICATIONS TECHNOLOGY
    12. 6.12 SUPPLY / VALUE CHAIN: INFORMATION AND COMMUNICATIONS TECHNOLOGY
    13. 6.13 INFORMATION AND COMMUNICATIONS TECHNOLOGY, BY COMPONENT, 2024 (% SHARE)
    14. 6.14 INFORMATION AND COMMUNICATIONS TECHNOLOGY, BY COMPONENT, 2024 TO 2035 (USD Billion)
    15. 6.15 INFORMATION AND COMMUNICATIONS TECHNOLOGY, BY ORGANIZATION SIZE, 2024 (% SHARE)
    16. 6.16 INFORMATION AND COMMUNICATIONS TECHNOLOGY, BY ORGANIZATION SIZE, 2024 TO 2035 (USD Billion)
    17. 6.17 INFORMATION AND COMMUNICATIONS TECHNOLOGY, BY TECHNOLOGY, 2024 (% SHARE)
    18. 6.18 INFORMATION AND COMMUNICATIONS TECHNOLOGY, BY TECHNOLOGY, 2024 TO 2035 (USD Billion)
    19. 6.19 INFORMATION AND COMMUNICATIONS TECHNOLOGY, BY APPLICATION, 2024 (% SHARE)
    20. 6.20 INFORMATION AND COMMUNICATIONS TECHNOLOGY, BY APPLICATION, 2024 TO 2035 (USD Billion)
    21. 6.21 INFORMATION AND COMMUNICATIONS TECHNOLOGY, BY END USER, 2024 (% SHARE)
    22. 6.22 INFORMATION AND COMMUNICATIONS TECHNOLOGY, BY END USER, 2024 TO 2035 (USD Billion)
    23. 6.23 BENCHMARKING OF MAJOR COMPETITORS
  7. 7 LIST OF TABLES
    1. 7.1 LIST OF ASSUMPTIONS
  8. 7.1.1
    1. 7.2 APAC MARKET SIZE ESTIMATES; FORECAST
      1. 7.2.1 BY COMPONENT, 2025-2035 (USD Billion)
      2. 7.2.2 BY ORGANIZATION SIZE, 2025-2035 (USD Billion)
      3. 7.2.3 BY TECHNOLOGY, 2025-2035 (USD Billion)
      4. 7.2.4 BY APPLICATION, 2025-2035 (USD Billion)
      5. 7.2.5 BY END USER, 2025-2035 (USD Billion)
    2. 7.3 PRODUCT LAUNCH/PRODUCT DEVELOPMENT/APPROVAL
  9. 7.3.1
    1. 7.4 ACQUISITION/PARTNERSHIP
  10. 7.4.1

APAC Information and Communications Technology Market Segmentation

Information and Communications Technology By Component (USD Billion, 2025-2035)

  • Software
  • Services

Information and Communications Technology By Organization Size (USD Billion, 2025-2035)

  • Small & Medium Enterprises
  • Large Enterprises

Information and Communications Technology By Technology (USD Billion, 2025-2035)

  • Radio-Frequency Identification
  • Near Field Communication
  • Others

Information and Communications Technology By Application (USD Billion, 2025-2035)

  • Portfolio Management
  • Product Data Management
  • Collaborative Design and Engineering
  • Customer Management
  • Compliance Management
  • Others

Information and Communications Technology By End User (USD Billion, 2025-2035)

  • Aerospace & Defense
  • Healthcare & Life Sciences
  • Retail & Consumer Goods
  • Energy & Utilities
  • Industrial Machinery & Heavy Equipment
  • Telecommunication & IT
  • Automotive & Transportation
  • Semiconductor & Electronics
  • Others