×
Hero Background
English
Chinese
French
Japanese
Korean
German
Spanish

App Analytics Market Size

ID: MRFR/ICT/5139-CR
142 Pages
Ankit Gupta
August 2019

App Analytics Market Research Report Information By Platform (Web-Based, and Mobile Based), By Application (Revenue Analytics, App Performance Analytics and Operations, Crash Analytics, Cross Platform Analysis, User Analytics, In-Behavioral Analytics, Ad Monitoring and Marketing Analytics, Campaign Analytics and Others), By Industry Vertical (BFSI, Retail, Media and Entertainment, Logistics, Travel and Transport (LTT), Telecom and IT, Healthcare, Hospitality and Others) - Forecast till 2035

Share:
Download PDF ×

We do not share your information with anyone. However, we may send you emails based on your report interest from time to time. You may contact us at any time to opt-out.

App Analytics Market Infographic
Purchase Options

App Analytics Size

App Analytics Market Growth Projections and Opportunities

A lot of different things will affect the growth of the App Analytics business. One of the main things that affects market trends is how quickly the global mobile app business is growing. More and more people have smartphones, which has made the need for effective app tracking tools much greater. Mobile apps are becoming more and more important all the time. The App Analytics business also goes through a lot of changes because technology changes so quickly. Ad tools need to adapt to new systems and features just like phones and computers do. If companies want to get the most out of app tracking tools, they should work with the newest gadgets and platforms. Businesses have higher and higher standards, so analytics companies must always come up with new features to meet those needs. There are many types of analytics, such as real-time analytics, prediction analytics, and insights powered by AI. The App Analytics business is starting to feel the effects of the growing worry for data security around the world. Businesses are looking for analytics solutions that put data security and strict privacy standards first because protecting user data and following rules like the CCPA and GDPR are very important. People and businesses are more likely to trust analytics companies that follow good data security rules and practices. They will do better in the market with this. Companies are becoming more aware of how important data is when making decisions, which is growing the market for app analytics. More and more businesses are learning that analytics can help them understand how users behave, make the user experience better, and speed up apps. This is why there is a greater need for stronger app tracking tools. Analytics is a tool that many types of businesses use to make plans and find information that can help them do better, come up with new ideas, and make customers happy.

App Analytics Market Size Graph
Author
Ankit Gupta
Senior Research Analyst

Ankit Gupta is an analyst in market research industry in ICT and SEMI industry. With post-graduation in "Telecom and Marketing Management" and graduation in "Electronics and Telecommunication" vertical he is well versed with recent development in ICT industry as a whole. Having worked on more than 150+ reports including consultation for fortune 500 companies such as Microsoft and Rio Tinto in identifying solutions with respect to business problems his opinions are inclined towards mixture of technical and managerial aspects.

Leave a Comment

FAQs

What is the current valuation of the App Analytics Market as of 2024?

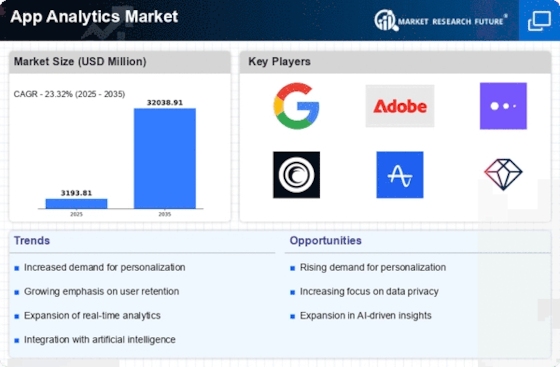
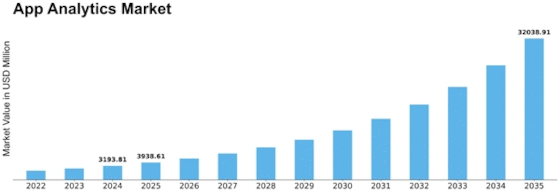
The App Analytics Market was valued at 3193.81 USD Million in 2024.

What is the projected market size for the App Analytics Market in 2035?

The market is projected to reach 32038.91 USD Million by 2035.

What is the expected CAGR for the App Analytics Market during the forecast period 2025 - 2035?

The expected CAGR for the App Analytics Market during 2025 - 2035 is 23.32%.

Which companies are considered key players in the App Analytics Market?

Key players in the market include Google, Adobe, Mixpanel, Flurry, Amplitude, App Annie, Countly, Localytics, and Heap.

What segment generated the highest revenue in the App Analytics Market in 2024?

In 2024, the segment for App Performance Analytics and Operations generated a revenue of 6407.78 USD Million.

Market Summary

As per MRFR analysis, the App Analytics Market Size was estimated at 3193.81 USD Million in 2024. The App Analytics industry is projected to grow from 3938.61 USD Million in 2025 to 32038.91 USD Million by 2035, exhibiting a compound annual growth rate (CAGR) of 23.32 during the forecast period 2025 - 2035.

Key Market Trends & Highlights

The App Analytics Market is experiencing robust growth driven by technological advancements and evolving consumer expectations.

  • The integration of AI and Machine Learning is transforming how app analytics are conducted, enhancing predictive capabilities.
  • User Analytics remains the largest segment, while Revenue Analytics is emerging as the fastest-growing segment in the market.
  • North America continues to dominate the App Analytics Market, whereas the Asia-Pacific region is recognized as the fastest-growing area.
  • The rising demand for data-driven decision making and increased mobile app usage are key drivers propelling market expansion.

Market Size & Forecast

2024 Market Size 3193.81 (USD Million)
2035 Market Size 32038.91 (USD Million)
CAGR (2025 - 2035) 23.32%
Largest Regional Market Share in 2024 North America

Major Players

<p>Google (US), Adobe (US), Mixpanel (US), Flurry (US), Amplitude (US), App Annie (US), Countly (TR), Localytics (US), Heap (US)</p>

Market Trends

The App Analytics Market is currently experiencing a transformative phase, driven by the increasing reliance on mobile applications across various sectors. Organizations are recognizing the necessity of understanding user behavior and engagement patterns to enhance their offerings. This growing awareness is leading to a surge in demand for sophisticated analytics tools that provide insights into app performance, user retention, and monetization strategies. As businesses strive to optimize their digital presence, the App Analytics Market is evolving to meet these needs, incorporating advanced technologies such as artificial intelligence and machine learning to deliver more precise and actionable insights. Moreover, the competitive landscape within the App Analytics Market is becoming increasingly dynamic. Companies are not only focusing on traditional metrics but are also exploring innovative ways to analyze user interactions and preferences. This shift indicates a broader trend towards personalization, where analytics tools are expected to provide tailored recommendations based on individual user data. As the market continues to mature, it appears that the integration of real-time analytics and cross-platform capabilities will play a crucial role in shaping future developments, ensuring that businesses remain agile and responsive to changing consumer demands.

Integration of AI and Machine Learning

The incorporation of artificial intelligence and machine learning technologies into app analytics tools is becoming more prevalent. These advancements enable deeper insights into user behavior, allowing businesses to predict trends and enhance user experiences.

Focus on User Privacy and Data Security

As concerns regarding data privacy intensify, the App Analytics Market is witnessing a shift towards solutions that prioritize user consent and data protection. Companies are increasingly adopting analytics frameworks that comply with stringent regulations.

Emphasis on Real-Time Analytics

The demand for real-time analytics is on the rise, as businesses seek immediate insights to make informed decisions. This trend reflects a broader need for agility in responding to user interactions and market changes.

App Analytics Market Market Drivers

Increased Mobile App Usage

The App Analytics Market is significantly influenced by the rising usage of mobile applications across various sectors. With the proliferation of smartphones and tablets, users are increasingly engaging with apps for diverse purposes, from shopping to social networking. Recent statistics indicate that mobile app downloads have surpassed 200 billion annually, underscoring the growing reliance on mobile technology. This trend compels businesses to invest in app analytics solutions to monitor user behavior, track engagement metrics, and identify areas for improvement. As the number of mobile applications continues to escalate, the demand for sophisticated analytics tools that can provide insights into user interactions is likely to intensify, further propelling the growth of the App Analytics Market.

Adoption of Cloud-Based Solutions

The App Analytics Market is witnessing a shift towards cloud-based analytics solutions, which offer scalability and flexibility for businesses. As organizations increasingly migrate their operations to the cloud, the demand for cloud-based app analytics tools is on the rise. These solutions enable companies to access real-time data and insights from anywhere, facilitating better decision-making processes. Market Research Future suggests that the cloud segment is expected to capture a significant share of the app analytics market, driven by the need for cost-effective and efficient data management. Furthermore, the ability to integrate cloud analytics with other business applications enhances the overall functionality and usability of app analytics tools, making them indispensable for modern enterprises. This trend indicates a transformative phase for the App Analytics Market as cloud adoption continues to grow.

Focus on Customer Experience Enhancement

The App Analytics Market is increasingly focused on enhancing customer experience, which has become a critical differentiator for businesses. Companies are leveraging app analytics to gain insights into user preferences and behaviors, allowing them to tailor their offerings accordingly. Research indicates that organizations that prioritize customer experience are likely to see a 10-15% increase in customer loyalty and retention rates. By utilizing analytics tools, businesses can identify pain points in the user journey and implement targeted improvements, thereby fostering a more engaging and satisfying experience. This emphasis on customer-centric strategies is driving the demand for advanced app analytics solutions, as companies strive to create personalized experiences that resonate with their users. As a result, the App Analytics Market is evolving to meet these growing expectations.

Regulatory Compliance and Data Governance

The App Analytics Market is increasingly shaped by the need for regulatory compliance and robust data governance frameworks. As data privacy regulations become more stringent, businesses are compelled to adopt analytics solutions that ensure compliance with legal standards. This trend is particularly evident in regions where data protection laws are being enforced more rigorously. Companies are investing in app analytics tools that not only provide insights but also adhere to data governance protocols, thereby mitigating risks associated with data breaches and non-compliance. The market is likely to see a rise in demand for analytics solutions that incorporate features for data security and privacy management. Consequently, the App Analytics Market is adapting to these regulatory challenges, positioning itself as a critical component in the broader landscape of data management and compliance.

Rising Demand for Data-Driven Decision Making

The App Analytics Market is experiencing a notable surge in demand for data-driven decision making. Organizations are increasingly recognizing the value of leveraging analytics to enhance user engagement and optimize app performance. According to recent estimates, the market for app analytics is projected to grow at a compound annual growth rate of approximately 20% over the next five years. This growth is largely attributed to businesses seeking to harness actionable insights from user data, thereby improving their overall strategic initiatives. As companies strive to remain competitive, the integration of robust analytics tools becomes essential, enabling them to make informed decisions that drive user retention and satisfaction. Consequently, the App Analytics Market is poised for substantial expansion as more enterprises adopt data-centric approaches.
Market Segment Insights

By Application Type: User Analytics (Largest) vs. Revenue Analytics (Fastest-Growing)

<p>In the App Analytics Market, User Analytics holds the largest share, reflecting its critical role in understanding user behavior and preferences. Following closely is Revenue Analytics, which has emerged as the fastest-growing segment. Together, these application types highlight the evolving focus of businesses on leveraging user data to boost revenues and enhance app performance. The market dynamics indicate a growing reliance on analytics tools that offer actionable insights into user engagement and monetization strategies. The increasing importance of personalized user experiences is propelling the demand for Revenue Analytics. Furthermore, technological advancements and competitive pressures encourage companies to adopt sophisticated analytics solutions to stay ahead in the fast-paced app landscape.</p>

<p>User Analytics (Dominant) vs. Revenue Analytics (Emerging)</p>

<p>User Analytics is a dominant force in the App Analytics Market, offering comprehensive insights into how users interact with applications. It enables companies to track user behavior, preferences, and engagement metrics, thereby facilitating data-driven decisions to optimize user experiences. On the other hand, Revenue Analytics is an emerging area that focuses on understanding revenue generation through in-app purchases, subscriptions, and advertising. As businesses aim to maximize profits, the significance of Revenue Analytics is growing rapidly, driven by the need to analyze revenue streams efficiently. Both segments play a crucial role in shaping strategies, with User Analytics providing the foundational insights and Revenue Analytics focusing on monetization opportunities.</p>

By Platform Type: Web-Based (Largest) vs. Mobile-Based (Fastest-Growing)

<p>In the App Analytics Market, the Platform Type segment shows a clear distinction in market share between Web-Based and Mobile-Based analytics. Web-Based platforms currently hold the largest share, benefiting from established user bases and robust functionalities that cater to comprehensive analytics needs. Conversely, Mobile-Based platforms have emerged as formidable contenders, increasingly attracting users as mobile app usage surges, reflecting changing consumer behaviors in digital consumption.</p>

<p>Platform Type: Web-Based (Dominant) vs. Mobile-Based (Emerging)</p>

<p>Web-Based analytics tools are characterized by their extensive data processing capabilities, ideal for complex applications and large-scale enterprises. They offer rich features including cross-platform tracking, detailed reporting, and integration with various business intelligence tools. On the other hand, Mobile-Based analytics are seen as essential for capturing real-time user interactions within mobile applications. As mobile usage continues to rise, these platforms are quickly adapting to provide advanced features like app performance tracking and user engagement analysis, thereby becoming increasingly vital for businesses focusing on mobile-first strategies.</p>

By Industry Vertical: BFSI (Largest) vs. Media and Entertainment (Fastest-Growing)

<p>Among various industry verticals, the BFSI (Banking, Financial Services, and Insurance) segment holds the largest market share in the app analytics market. This sector leverages app analytics to gain insights into customer behaviors, optimize services, and enhance user engagement. The retail sector follows closely, with significant investments in app-based solutions to drive sales and improve customer experiences. Other sectors like Telecom and IT, Healthcare, and Hospitality are also vying for a significant share but have yet to reach the levels of BFSI and Retail.</p>

<p>BFSI (Dominant) vs. Media and Entertainment (Emerging)</p>

<p>The BFSI sector thrives on comprehensive app analytics to refine customer interactions and optimize operational efficiencies. With a focus on security and regulatory compliance, banks and financial institutions utilize app analytics to mitigate risks and personalize offerings. Meanwhile, the Media and Entertainment sector is rapidly emerging, driven by the increasing consumption of digital content and the demand for user-centric experiences. As streaming services and online media platforms grow, these players are harnessing app analytics to better understand viewer preferences, optimize content delivery, and increase engagement.</p>

Get more detailed insights about App Analytics Market Report-Forecast till 2035

Regional Insights

North America : Innovation and Leadership Hub

North America leads the app analytics market, driven by a robust tech ecosystem and high smartphone penetration. The region accounts for approximately 45% of the global market share, with the United States being the largest contributor, followed by Canada. Regulatory support for data privacy and analytics innovation further fuels growth, as companies seek to enhance user engagement and retention through data-driven insights. The competitive landscape is characterized by major players like Google, Adobe, and Mixpanel, which dominate the market with advanced analytics solutions. The presence of numerous startups also fosters innovation, creating a dynamic environment for app developers. As businesses increasingly rely on data analytics to inform their strategies, the demand for sophisticated app analytics tools continues to rise, solidifying North America's position as a leader in this sector.

Europe : Emerging Analytics Powerhouse

Europe is rapidly emerging as a significant player in the app analytics market, holding approximately 30% of the global share. The region benefits from stringent data protection regulations, such as GDPR, which drive demand for compliant analytics solutions. Countries like Germany and the UK are at the forefront, leveraging their strong tech infrastructure to enhance app performance and user experience through data insights. The competitive landscape features a mix of established firms and innovative startups, with key players like Adobe and local companies gaining traction. The focus on user privacy and data security is reshaping the market, prompting companies to adopt analytics tools that align with regulatory standards. As European businesses increasingly recognize the value of data-driven decision-making, the app analytics market is poised for substantial growth in the coming years.

Asia-Pacific : Rapid Growth and Adoption

Asia-Pacific is witnessing rapid growth in the app analytics market, driven by increasing smartphone adoption and a burgeoning app ecosystem. The region holds about 20% of the global market share, with countries like China and India leading the charge. The demand for app analytics is fueled by the need for businesses to understand user behavior and optimize their applications for better engagement and retention. The competitive landscape is diverse, with both The App Analytics Market share. Companies like Flurry and Amplitude are making significant inroads, while local firms are innovating to cater to regional needs. As the digital economy expands, the focus on data analytics is becoming crucial for businesses aiming to enhance their app offerings and drive user satisfaction, positioning Asia-Pacific as a key player in the global market.

Middle East and Africa : Emerging Market Dynamics

The Middle East and Africa region is gradually emerging in the app analytics market, currently holding around 5% of the global share. The growth is driven by increasing smartphone penetration and a rising number of mobile applications. Countries like South Africa and the UAE are leading the way, with a growing emphasis on digital transformation and data-driven decision-making in various sectors. The competitive landscape is still developing, with a mix of international and local players. Companies are beginning to recognize the importance of app analytics for enhancing user engagement and optimizing app performance. As the region continues to invest in technology and infrastructure, the potential for growth in the app analytics market is significant, paving the way for future advancements and innovations.

Key Players and Competitive Insights

Major market players are spending money on marketing activities, which will help the App Analytics Market grow even more. Market participants are also taking various strategic initiatives to grow their worldwide footprint, including new technology integrations, contractual agreements, mergers and acquisitions, increased investments, and collaboration with other organizations. Competitors in the App Analytics industry must offer cost-effective items to expand and survive in an increasingly competitive and rising market environment.

One of the primary business strategies adopted by App Analytics industry solution providers is to benefit and make clients knowledgeable. In recent years, App Analytics Market has shown a tremendous boost due to e-commerce market acceptance and focus on going online. The App Analytics Market is partially fragmented, with the presence of big players having nearly 30% share in 2021. The major companies in the market are Amazon.com Inc., Facebook Inc., Google LLC, Microsoft Corporation, and Content square SaaS.

Key Companies in the App Analytics Market market include

Industry Developments

The MDM Analytics team is pleased to declare the April 2024 release of Market Prospector 4.0, a robust market profiling software service that has been utilized for over three decades by leading North American distributors and manufacturers of electrical, industrial, construction, and facilities maintenance supplies. Using its proprietary market profiling models, Market Prospector has assisted hundreds of electrical, industrial, construction, and facility maintenance product marketers in sizing, segmenting, and forecasting product markets, expanding market share, and targeting high-potential prospect accounts.

In addition to serving manufacturers and distributors as our primary clientele, MDM Analytics also provides services to international consulting firms, financial experts, and M&A specialists. The majority of market research firms offer national-level market size estimates for product categories. MDM Analytics provides clients with the "DNA" of estimated market and account potential across distinct product category, territory, and customer segmentation dimensions by employing a more precise top-down and bottom-up modeling methodology.

In November 2023, Salesforce introduced Service Intelligence, an analytics application designed to improve customer satisfaction and agent efficiency. Data Cloud, the real-time hyperscale data engine developed by Salesforce, provides Service Intelligence with the capability to provide users with direct access to their business data within Service Cloud. This eliminates the superfluous nature of navigating between displays in search of information. Businesses can bridge the gap between data and action with AI-powered Service Intelligence, which transforms raw data into valuable consumer insights.

This provides service personnel with the necessary information to effectively carry out their primary objective, which is to provide outstanding customer experiences. Service Intelligence provides a view of critical metrics, including average time to close, customer satisfaction, and individual and team obligations, via pre-built, customizable dashboards. This facilitates comprehension and visibility for agents and managers, bolstered by the insights generated by AI.

Future Outlook

App Analytics Market Future Outlook

<p>The App Analytics Market is projected to grow at a 23.32% CAGR from 2024 to 2035, driven by increasing mobile app usage, data-driven decision-making, and enhanced user engagement strategies.</p>

New opportunities lie in:

  • <p>Integration of AI-driven predictive analytics tools for user behavior forecasting.</p>
  • <p>Development of real-time analytics dashboards for immediate decision-making.</p>
  • <p>Expansion into emerging markets with localized app analytics solutions.</p>

<p>By 2035, the App Analytics Market is expected to be robust, reflecting substantial growth and innovation.</p>

Market Segmentation

App Analytics Market Platform Type Outlook

  • Web-Based
  • Mobile-Based

App Analytics Market Application Type Outlook

  • Revenue Analytics
  • App Performance Analytics and Operations
  • Crash Analytics
  • Cross-Platform Analysis
  • User Analytics
  • In-Behavioral Analytics
  • Ad Monitoring and Marketing Analytics
  • Campaign Analytics
  • Others

App Analytics Market Industry Vertical Outlook

  • BFSI
  • Retail
  • Media and Entertainment
  • Logistics, Travel, and Transport (LTT)
  • Telecom and IT
  • Healthcare
  • Hospitality
  • Others

Report Scope

MARKET SIZE 20243193.81(USD Million)
MARKET SIZE 20253938.61(USD Million)
MARKET SIZE 203532038.91(USD Million)
COMPOUND ANNUAL GROWTH RATE (CAGR)23.32% (2024 - 2035)
REPORT COVERAGERevenue Forecast, Competitive Landscape, Growth Factors, and Trends
BASE YEAR2024
Market Forecast Period2025 - 2035
Historical Data2019 - 2024
Market Forecast UnitsUSD Million
Key Companies ProfiledMarket analysis in progress
Segments CoveredMarket segmentation analysis in progress
Key Market OpportunitiesIntegration of artificial intelligence for enhanced user behavior analysis in the App Analytics Market.
Key Market DynamicsRising demand for data-driven insights drives competition and innovation in the App Analytics Market.
Countries CoveredNorth America, Europe, APAC, South America, MEA

FAQs

What is the current valuation of the App Analytics Market as of 2024?

The App Analytics Market was valued at 3193.81 USD Million in 2024.

What is the projected market size for the App Analytics Market in 2035?

The market is projected to reach 32038.91 USD Million by 2035.

What is the expected CAGR for the App Analytics Market during the forecast period 2025 - 2035?

The expected CAGR for the App Analytics Market during 2025 - 2035 is 23.32%.

Which companies are considered key players in the App Analytics Market?

Key players in the market include Google, Adobe, Mixpanel, Flurry, Amplitude, App Annie, Countly, Localytics, and Heap.

What segment generated the highest revenue in the App Analytics Market in 2024?

In 2024, the segment for App Performance Analytics and Operations generated a revenue of 6407.78 USD Million.

  1. SECTION I: EXECUTIVE SUMMARY AND KEY HIGHLIGHTS
    1. EXECUTIVE SUMMARY
      1. Market Overview
      2. Key Findings
      3. Market Segmentation
      4. Competitive Landscape
      5. Challenges and Opportunities
      6. Future Outlook
  2. SECTION II: SCOPING, METHODOLOGY AND MARKET STRUCTURE
    1. MARKET INTRODUCTION
      1. Definition
      2. Scope of the study
    2. RESEARCH METHODOLOGY
      1. Overview
      2. Data Mining
      3. Secondary Research
      4. Primary Research
      5. Forecasting Model
      6. Market Size Estimation
      7. Data Triangulation
      8. Validation
  3. SECTION III: QUALITATIVE ANALYSIS
    1. MARKET DYNAMICS
      1. Overview
      2. Drivers
      3. Restraints
      4. Opportunities
    2. MARKET FACTOR ANALYSIS
      1. Value chain Analysis
      2. Porter's Five Forces Analysis
      3. COVID-19 Impact Analysis
  4. SECTION IV: QUANTITATIVE ANALYSIS
    1. Information and Communications Technology, BY Application Type (USD Million)
      1. Revenue Analytics
      2. App Performance Analytics and Operations
      3. Crash Analytics
      4. Cross-Platform Analysis
      5. User Analytics
      6. In-Behavioral Analytics
      7. Ad Monitoring and Marketing Analytics
      8. Campaign Analytics
      9. Others
    2. Information and Communications Technology, BY Platform Type (USD Million)
      1. Web-Based
      2. Mobile-Based
    3. Information and Communications Technology, BY Industry Vertical (USD Million)
      1. BFSI
      2. Retail
      3. Media and Entertainment
      4. Logistics, Travel, and Transport (LTT)
      5. Telecom and IT
      6. Healthcare
      7. Hospitality
      8. Others
    4. Information and Communications Technology, BY Region (USD Million)
      1. North America
      2. Europe
      3. APAC
      4. South America
      5. MEA
  5. SECTION V: COMPETITIVE ANALYSIS
    1. Competitive Landscape
      1. Overview
      2. Competitive Analysis
      3. Market share Analysis
      4. Major Growth Strategy in the Information and Communications Technology
      5. Competitive Benchmarking
      6. Leading Players in Terms of Number of Developments in the Information and Communications Technology
      7. Key developments and growth strategies
      8. Major Players Financial Matrix
    2. Company Profiles
      1. Google (US)
      2. Adobe (US)
      3. Mixpanel (US)
      4. Flurry (US)
      5. Amplitude (US)
      6. App Annie (US)
      7. Countly (TR)
      8. Localytics (US)
      9. Heap (US)
    3. Appendix
      1. References
      2. Related Reports
  6. LIST OF FIGURES
    1. MARKET SYNOPSIS
    2. NORTH AMERICA MARKET ANALYSIS
    3. US MARKET ANALYSIS BY APPLICATION TYPE
    4. US MARKET ANALYSIS BY PLATFORM TYPE
    5. US MARKET ANALYSIS BY INDUSTRY VERTICAL
    6. CANADA MARKET ANALYSIS BY APPLICATION TYPE
    7. CANADA MARKET ANALYSIS BY PLATFORM TYPE
    8. CANADA MARKET ANALYSIS BY INDUSTRY VERTICAL
    9. EUROPE MARKET ANALYSIS
    10. GERMANY MARKET ANALYSIS BY APPLICATION TYPE
    11. GERMANY MARKET ANALYSIS BY PLATFORM TYPE
    12. GERMANY MARKET ANALYSIS BY INDUSTRY VERTICAL
    13. UK MARKET ANALYSIS BY APPLICATION TYPE
    14. UK MARKET ANALYSIS BY PLATFORM TYPE
    15. UK MARKET ANALYSIS BY INDUSTRY VERTICAL
    16. FRANCE MARKET ANALYSIS BY APPLICATION TYPE
    17. FRANCE MARKET ANALYSIS BY PLATFORM TYPE
    18. FRANCE MARKET ANALYSIS BY INDUSTRY VERTICAL
    19. RUSSIA MARKET ANALYSIS BY APPLICATION TYPE
    20. RUSSIA MARKET ANALYSIS BY PLATFORM TYPE
    21. RUSSIA MARKET ANALYSIS BY INDUSTRY VERTICAL
    22. ITALY MARKET ANALYSIS BY APPLICATION TYPE
    23. ITALY MARKET ANALYSIS BY PLATFORM TYPE
    24. ITALY MARKET ANALYSIS BY INDUSTRY VERTICAL
    25. SPAIN MARKET ANALYSIS BY APPLICATION TYPE
    26. SPAIN MARKET ANALYSIS BY PLATFORM TYPE
    27. SPAIN MARKET ANALYSIS BY INDUSTRY VERTICAL
    28. REST OF EUROPE MARKET ANALYSIS BY APPLICATION TYPE
    29. REST OF EUROPE MARKET ANALYSIS BY PLATFORM TYPE
    30. REST OF EUROPE MARKET ANALYSIS BY INDUSTRY VERTICAL
    31. APAC MARKET ANALYSIS
    32. CHINA MARKET ANALYSIS BY APPLICATION TYPE
    33. CHINA MARKET ANALYSIS BY PLATFORM TYPE
    34. CHINA MARKET ANALYSIS BY INDUSTRY VERTICAL
    35. INDIA MARKET ANALYSIS BY APPLICATION TYPE
    36. INDIA MARKET ANALYSIS BY PLATFORM TYPE
    37. INDIA MARKET ANALYSIS BY INDUSTRY VERTICAL
    38. JAPAN MARKET ANALYSIS BY APPLICATION TYPE
    39. JAPAN MARKET ANALYSIS BY PLATFORM TYPE
    40. JAPAN MARKET ANALYSIS BY INDUSTRY VERTICAL
    41. SOUTH KOREA MARKET ANALYSIS BY APPLICATION TYPE
    42. SOUTH KOREA MARKET ANALYSIS BY PLATFORM TYPE
    43. SOUTH KOREA MARKET ANALYSIS BY INDUSTRY VERTICAL
    44. MALAYSIA MARKET ANALYSIS BY APPLICATION TYPE
    45. MALAYSIA MARKET ANALYSIS BY PLATFORM TYPE
    46. MALAYSIA MARKET ANALYSIS BY INDUSTRY VERTICAL
    47. THAILAND MARKET ANALYSIS BY APPLICATION TYPE
    48. THAILAND MARKET ANALYSIS BY PLATFORM TYPE
    49. THAILAND MARKET ANALYSIS BY INDUSTRY VERTICAL
    50. INDONESIA MARKET ANALYSIS BY APPLICATION TYPE
    51. INDONESIA MARKET ANALYSIS BY PLATFORM TYPE
    52. INDONESIA MARKET ANALYSIS BY INDUSTRY VERTICAL
    53. REST OF APAC MARKET ANALYSIS BY APPLICATION TYPE
    54. REST OF APAC MARKET ANALYSIS BY PLATFORM TYPE
    55. REST OF APAC MARKET ANALYSIS BY INDUSTRY VERTICAL
    56. SOUTH AMERICA MARKET ANALYSIS
    57. BRAZIL MARKET ANALYSIS BY APPLICATION TYPE
    58. BRAZIL MARKET ANALYSIS BY PLATFORM TYPE
    59. BRAZIL MARKET ANALYSIS BY INDUSTRY VERTICAL
    60. MEXICO MARKET ANALYSIS BY APPLICATION TYPE
    61. MEXICO MARKET ANALYSIS BY PLATFORM TYPE
    62. MEXICO MARKET ANALYSIS BY INDUSTRY VERTICAL
    63. ARGENTINA MARKET ANALYSIS BY APPLICATION TYPE
    64. ARGENTINA MARKET ANALYSIS BY PLATFORM TYPE
    65. ARGENTINA MARKET ANALYSIS BY INDUSTRY VERTICAL
    66. REST OF SOUTH AMERICA MARKET ANALYSIS BY APPLICATION TYPE
    67. REST OF SOUTH AMERICA MARKET ANALYSIS BY PLATFORM TYPE
    68. REST OF SOUTH AMERICA MARKET ANALYSIS BY INDUSTRY VERTICAL
    69. MEA MARKET ANALYSIS
    70. GCC COUNTRIES MARKET ANALYSIS BY APPLICATION TYPE
    71. GCC COUNTRIES MARKET ANALYSIS BY PLATFORM TYPE
    72. GCC COUNTRIES MARKET ANALYSIS BY INDUSTRY VERTICAL
    73. SOUTH AFRICA MARKET ANALYSIS BY APPLICATION TYPE
    74. SOUTH AFRICA MARKET ANALYSIS BY PLATFORM TYPE
    75. SOUTH AFRICA MARKET ANALYSIS BY INDUSTRY VERTICAL
    76. REST OF MEA MARKET ANALYSIS BY APPLICATION TYPE
    77. REST OF MEA MARKET ANALYSIS BY PLATFORM TYPE
    78. REST OF MEA MARKET ANALYSIS BY INDUSTRY VERTICAL
    79. KEY BUYING CRITERIA OF INFORMATION AND COMMUNICATIONS TECHNOLOGY
    80. RESEARCH PROCESS OF MRFR
    81. DRO ANALYSIS OF INFORMATION AND COMMUNICATIONS TECHNOLOGY
    82. DRIVERS IMPACT ANALYSIS: INFORMATION AND COMMUNICATIONS TECHNOLOGY
    83. RESTRAINTS IMPACT ANALYSIS: INFORMATION AND COMMUNICATIONS TECHNOLOGY
    84. SUPPLY / VALUE CHAIN: INFORMATION AND COMMUNICATIONS TECHNOLOGY
    85. INFORMATION AND COMMUNICATIONS TECHNOLOGY, BY APPLICATION TYPE, 2024 (% SHARE)
    86. INFORMATION AND COMMUNICATIONS TECHNOLOGY, BY APPLICATION TYPE, 2024 TO 2035 (USD Million)
    87. INFORMATION AND COMMUNICATIONS TECHNOLOGY, BY PLATFORM TYPE, 2024 (% SHARE)
    88. INFORMATION AND COMMUNICATIONS TECHNOLOGY, BY PLATFORM TYPE, 2024 TO 2035 (USD Million)
    89. INFORMATION AND COMMUNICATIONS TECHNOLOGY, BY INDUSTRY VERTICAL, 2024 (% SHARE)
    90. INFORMATION AND COMMUNICATIONS TECHNOLOGY, BY INDUSTRY VERTICAL, 2024 TO 2035 (USD Million)
    91. BENCHMARKING OF MAJOR COMPETITORS
  7. LIST OF TABLES
    1. LIST OF ASSUMPTIONS
    2. North America MARKET SIZE ESTIMATES; FORECAST
      1. BY APPLICATION TYPE, 2025-2035 (USD Million)
      2. BY PLATFORM TYPE, 2025-2035 (USD Million)
      3. BY INDUSTRY VERTICAL, 2025-2035 (USD Million)
    3. US MARKET SIZE ESTIMATES; FORECAST
      1. BY APPLICATION TYPE, 2025-2035 (USD Million)
      2. BY PLATFORM TYPE, 2025-2035 (USD Million)
      3. BY INDUSTRY VERTICAL, 2025-2035 (USD Million)
    4. Canada MARKET SIZE ESTIMATES; FORECAST
      1. BY APPLICATION TYPE, 2025-2035 (USD Million)
      2. BY PLATFORM TYPE, 2025-2035 (USD Million)
      3. BY INDUSTRY VERTICAL, 2025-2035 (USD Million)
    5. Europe MARKET SIZE ESTIMATES; FORECAST
      1. BY APPLICATION TYPE, 2025-2035 (USD Million)
      2. BY PLATFORM TYPE, 2025-2035 (USD Million)
      3. BY INDUSTRY VERTICAL, 2025-2035 (USD Million)
    6. Germany MARKET SIZE ESTIMATES; FORECAST
      1. BY APPLICATION TYPE, 2025-2035 (USD Million)
      2. BY PLATFORM TYPE, 2025-2035 (USD Million)
      3. BY INDUSTRY VERTICAL, 2025-2035 (USD Million)
    7. UK MARKET SIZE ESTIMATES; FORECAST
      1. BY APPLICATION TYPE, 2025-2035 (USD Million)
      2. BY PLATFORM TYPE, 2025-2035 (USD Million)
      3. BY INDUSTRY VERTICAL, 2025-2035 (USD Million)
    8. France MARKET SIZE ESTIMATES; FORECAST
      1. BY APPLICATION TYPE, 2025-2035 (USD Million)
      2. BY PLATFORM TYPE, 2025-2035 (USD Million)
      3. BY INDUSTRY VERTICAL, 2025-2035 (USD Million)
    9. Russia MARKET SIZE ESTIMATES; FORECAST
      1. BY APPLICATION TYPE, 2025-2035 (USD Million)
      2. BY PLATFORM TYPE, 2025-2035 (USD Million)
      3. BY INDUSTRY VERTICAL, 2025-2035 (USD Million)
    10. Italy MARKET SIZE ESTIMATES; FORECAST
      1. BY APPLICATION TYPE, 2025-2035 (USD Million)
      2. BY PLATFORM TYPE, 2025-2035 (USD Million)
      3. BY INDUSTRY VERTICAL, 2025-2035 (USD Million)
    11. Spain MARKET SIZE ESTIMATES; FORECAST
      1. BY APPLICATION TYPE, 2025-2035 (USD Million)
      2. BY PLATFORM TYPE, 2025-2035 (USD Million)
      3. BY INDUSTRY VERTICAL, 2025-2035 (USD Million)
    12. Rest of Europe MARKET SIZE ESTIMATES; FORECAST
      1. BY APPLICATION TYPE, 2025-2035 (USD Million)
      2. BY PLATFORM TYPE, 2025-2035 (USD Million)
      3. BY INDUSTRY VERTICAL, 2025-2035 (USD Million)
    13. APAC MARKET SIZE ESTIMATES; FORECAST
      1. BY APPLICATION TYPE, 2025-2035 (USD Million)
      2. BY PLATFORM TYPE, 2025-2035 (USD Million)
      3. BY INDUSTRY VERTICAL, 2025-2035 (USD Million)
    14. China MARKET SIZE ESTIMATES; FORECAST
      1. BY APPLICATION TYPE, 2025-2035 (USD Million)
      2. BY PLATFORM TYPE, 2025-2035 (USD Million)
      3. BY INDUSTRY VERTICAL, 2025-2035 (USD Million)
    15. India MARKET SIZE ESTIMATES; FORECAST
      1. BY APPLICATION TYPE, 2025-2035 (USD Million)
      2. BY PLATFORM TYPE, 2025-2035 (USD Million)
      3. BY INDUSTRY VERTICAL, 2025-2035 (USD Million)
    16. Japan MARKET SIZE ESTIMATES; FORECAST
      1. BY APPLICATION TYPE, 2025-2035 (USD Million)
      2. BY PLATFORM TYPE, 2025-2035 (USD Million)
      3. BY INDUSTRY VERTICAL, 2025-2035 (USD Million)
    17. South Korea MARKET SIZE ESTIMATES; FORECAST
      1. BY APPLICATION TYPE, 2025-2035 (USD Million)
      2. BY PLATFORM TYPE, 2025-2035 (USD Million)
      3. BY INDUSTRY VERTICAL, 2025-2035 (USD Million)
    18. Malaysia MARKET SIZE ESTIMATES; FORECAST
      1. BY APPLICATION TYPE, 2025-2035 (USD Million)
      2. BY PLATFORM TYPE, 2025-2035 (USD Million)
      3. BY INDUSTRY VERTICAL, 2025-2035 (USD Million)
    19. Thailand MARKET SIZE ESTIMATES; FORECAST
      1. BY APPLICATION TYPE, 2025-2035 (USD Million)
      2. BY PLATFORM TYPE, 2025-2035 (USD Million)
      3. BY INDUSTRY VERTICAL, 2025-2035 (USD Million)
    20. Indonesia MARKET SIZE ESTIMATES; FORECAST
      1. BY APPLICATION TYPE, 2025-2035 (USD Million)
      2. BY PLATFORM TYPE, 2025-2035 (USD Million)
      3. BY INDUSTRY VERTICAL, 2025-2035 (USD Million)
    21. Rest of APAC MARKET SIZE ESTIMATES; FORECAST
      1. BY APPLICATION TYPE, 2025-2035 (USD Million)
      2. BY PLATFORM TYPE, 2025-2035 (USD Million)
      3. BY INDUSTRY VERTICAL, 2025-2035 (USD Million)
    22. South America MARKET SIZE ESTIMATES; FORECAST
      1. BY APPLICATION TYPE, 2025-2035 (USD Million)
      2. BY PLATFORM TYPE, 2025-2035 (USD Million)
      3. BY INDUSTRY VERTICAL, 2025-2035 (USD Million)
    23. Brazil MARKET SIZE ESTIMATES; FORECAST
      1. BY APPLICATION TYPE, 2025-2035 (USD Million)
      2. BY PLATFORM TYPE, 2025-2035 (USD Million)
      3. BY INDUSTRY VERTICAL, 2025-2035 (USD Million)
    24. Mexico MARKET SIZE ESTIMATES; FORECAST
      1. BY APPLICATION TYPE, 2025-2035 (USD Million)
      2. BY PLATFORM TYPE, 2025-2035 (USD Million)
      3. BY INDUSTRY VERTICAL, 2025-2035 (USD Million)
    25. Argentina MARKET SIZE ESTIMATES; FORECAST
      1. BY APPLICATION TYPE, 2025-2035 (USD Million)
      2. BY PLATFORM TYPE, 2025-2035 (USD Million)
      3. BY INDUSTRY VERTICAL, 2025-2035 (USD Million)
    26. Rest of South America MARKET SIZE ESTIMATES; FORECAST
      1. BY APPLICATION TYPE, 2025-2035 (USD Million)
      2. BY PLATFORM TYPE, 2025-2035 (USD Million)
      3. BY INDUSTRY VERTICAL, 2025-2035 (USD Million)
    27. MEA MARKET SIZE ESTIMATES; FORECAST
      1. BY APPLICATION TYPE, 2025-2035 (USD Million)
      2. BY PLATFORM TYPE, 2025-2035 (USD Million)
      3. BY INDUSTRY VERTICAL, 2025-2035 (USD Million)
    28. GCC Countries MARKET SIZE ESTIMATES; FORECAST
      1. BY APPLICATION TYPE, 2025-2035 (USD Million)
      2. BY PLATFORM TYPE, 2025-2035 (USD Million)
      3. BY INDUSTRY VERTICAL, 2025-2035 (USD Million)
    29. South Africa MARKET SIZE ESTIMATES; FORECAST
      1. BY APPLICATION TYPE, 2025-2035 (USD Million)
      2. BY PLATFORM TYPE, 2025-2035 (USD Million)
      3. BY INDUSTRY VERTICAL, 2025-2035 (USD Million)
    30. Rest of MEA MARKET SIZE ESTIMATES; FORECAST
      1. BY APPLICATION TYPE, 2025-2035 (USD Million)
      2. BY PLATFORM TYPE, 2025-2035 (USD Million)
      3. BY INDUSTRY VERTICAL, 2025-2035 (USD Million)
    31. PRODUCT LAUNCH/PRODUCT DEVELOPMENT/APPROVAL
    32. ACQUISITION/PARTNERSHIP

App Analytics Market Segmentation

App Analytics Platform Outlook (USD Million, 2018-2030)

  • Web-Based
  • Mobile-Based

App Analytics Application Outlook (USD Million, 2018-2030)

  • Revenue Analytics
  • App Performance Analytics and Operations
  • Crash Analytics
  • Cross Platform Analysis
  • User Analytics
  • In-Behavioral Analytics
  • Ad Monitoring and Marketing Analytics
  • Campaign Analytics
  • Others

App Analytics Industry Verticals Outlook (USD Million, 2018-2030)

  • BFSI
  • Retail
  • Media and Entertainment
  • Logistics, Travel, and Transport (LTT)
  • Telecom and IT
  • Healthcare
  • Hospitality
  • Others

App Analytics Regional Outlook (USD Million, 2018-2030)

  • North America Outlook (USD Million, 2018-2030)

    • North America App Analytics by Platform
      • Web-Based
      • Mobile-Based
    • North America App Analytics by Application
      • Revenue Analytics
      • App Performance Analytics and Operations
      • Crash Analytics
      • Cross Platform Analysis
      • User Analytics
      • In-Behavioral Analytics
      • Ad Monitoring and Marketing Analytics
      • Campaign Analytics
      • Others
    • North America App Analytics by Industry Vertical
      • BFSI
      • Retail
      • Media and Entertainment
      • Logistics, Travel, and Transport (LTT)
      • Telecom and IT
      • Healthcare
      • Hospitality
      • Others
    • US Outlook (USD Million, 2018-2030)

    • US App Analytics by Platform
      • Web-Based
      • Mobile-Based
    • US App Analytics by Application
      • Revenue Analytics
      • App Performance Analytics and Operations
      • Crash Analytics
      • Cross Platform Analysis
      • User Analytics
      • In-Behavioral Analytics
      • Ad Monitoring and Marketing Analytics
      • Campaign Analytics
      • Others
    • US App Analytics by Industry Vertical
      • BFSI
      • Retail
      • Media and Entertainment
      • Logistics, Travel, and Transport (LTT)
      • Telecom and IT
      • Healthcare
      • Hospitality
      • Others
    • CANADA Outlook (USD Million, 2018-2030)

    • CANADA App Analytics by Platform
      • Web-Based
      • Mobile-Based
    • CANADA App Analytics by Application
      • Revenue Analytics
      • App Performance Analytics and Operations
      • Crash Analytics
      • Cross Platform Analysis
      • User Analytics
      • In-Behavioral Analytics
      • Ad Monitoring and Marketing Analytics
      • Campaign Analytics
      • Others
    • CANADA App Analytics by Industry Vertical
      • BFSI
      • Retail
      • Media and Entertainment
      • Logistics, Travel, and Transport (LTT)
      • Telecom and IT
      • Healthcare
      • Hospitality
      • Others
  • Europe Outlook (USD Million, 2018-2030)

    • Europe App Analytics by Platform
      • Web-Based
      • Mobile-Based
    • Europe App Analytics by Application
      • Revenue Analytics
      • App Performance Analytics and Operations
      • Crash Analytics
      • Cross Platform Analysis
      • User Analytics
      • In-Behavioral Analytics
      • Ad Monitoring and Marketing Analytics
      • Campaign Analytics
      • Others
    • Europe App by Industry Vertical
      • BFSI
      • Retail
      • Media and Entertainment
      • Logistics, Travel, and Transport (LTT)
      • Telecom and IT
      • Healthcare
      • Hospitality
      • Others
    • Germany Outlook (USD Million, 2018-2030)

    • Germany App Analytics by Platform
      • Web-Based
      • Mobile-Based
    • Germany App Analytics by Application
      • Revenue Analytics
      • App Performance Analytics and Operations
      • Crash Analytics
      • Cross Platform Analysis
      • User Analytics
      • In-Behavioral Analytics
      • Ad Monitoring and Marketing Analytics
      • Campaign Analytics
      • Others
    • Germany App Analytics by Industry Vertical
      • BFSI
      • Retail
      • Media and Entertainment
      • Logistics, Travel, and Transport (LTT)
      • Telecom and IT
      • Healthcare
      • Hospitality
      • Others
    • France Outlook (USD Million, 2018-2030)

    • France App Analytics by Platform
      • Web-Based
      • Mobile-Based
    • France App Analytics by Application
      • Revenue Analytics
      • App Performance Analytics and Operations
      • Crash Analytics
      • Cross Platform Analysis
      • User Analytics
      • In-Behavioral Analytics
      • Ad Monitoring and Marketing Analytics
      • Campaign Analytics
      • Others
    • France App Analytics by Industry Vertical
      • BFSI
      • Retail
      • Media and Entertainment
      • Logistics, Travel, and Transport (LTT)
      • Telecom and IT
      • Healthcare
      • Hospitality
      • Others
    • UK Outlook (USD Million, 2018-2030)

    • UK App Analytics by Platform
      • Web-Based
      • Mobile-Based
    • UK App Analytics by Application
      • Revenue Analytics
      • App Performance Analytics and Operations
      • Crash Analytics
      • Cross Platform Analysis
      • User Analytics
      • In-Behavioral Analytics
      • Ad Monitoring and Marketing Analytics
      • Campaign Analytics
      • Others
    • UK App Analytics by Industry Vertical
      • BFSI
      • Retail
      • Media and Entertainment
      • Logistics, Travel, and Transport (LTT)
      • Telecom and IT
      • Healthcare
      • Hospitality
      • Others
    • ITALY Outlook (USD Million, 2018-2030)

    • ITALY App Analytics by Platform
      • Web-Based
      • Mobile-Based
    • ITALY App Analytics by Application
      • Revenue Analytics
      • App Performance Analytics and Operations
      • Crash Analytics
      • Cross Platform Analysis
      • User Analytics
      • In-Behavioral Analytics
      • Ad Monitoring and Marketing Analytics
      • Campaign Analytics
      • Others
    • ITALY App Analytics by Industry Vertical
      • BFSI
      • Retail
      • Media and Entertainment
      • Logistics, Travel, and Transport (LTT)
      • Telecom and IT
      • Healthcare
      • Hospitality
    • Others SPAIN Outlook (USD Million, 2018-2030)

    • Spain App Analytics by Platform
      • Web-Based
      • Mobile-Based
    • Spain App Analytics by Application
      • Revenue Analytics
      • App Performance Analytics and Operations
      • Crash Analytics
      • Cross Platform Analysis
      • User Analytics
      • In-Behavioral Analytics
      • Ad Monitoring and Marketing Analytics
      • Campaign Analytics
      • Others
    • Spain App Analytics by Industry Vertical
      • BFSI
      • Retail
      • Media and Entertainment
      • Logistics, Travel, and Transport (LTT)
      • Telecom and IT
      • Healthcare
      • Hospitality
      • Others
    • Rest Of Europe Outlook (USD Million, 2018-2030)

    • Rest Of Europe App Analytics by Platform
      • Web-Based
      • Mobile-Based
    • REST OF EUROPE App Analytics by Application
      • Revenue Analytics
      • App Performance Analytics and Operations
      • Crash Analytics
      • Cross Platform Analysis
      • User Analytics
      • In-Behavioral Analytics
      • Ad Monitoring and Marketing Analytics
      • Campaign Analytics
      • Others
    • REST OF EUROPE App Analytics by Industry Vertical
      • BFSI
      • Retail
      • Media and Entertainment
      • Logistics, Travel, and Transport (LTT)
      • Telecom and IT
      • Healthcare
      • Hospitality
      • Others
  • Asia-Pacific Outlook (USD Million, 2018-2030)

    • Asia-Pacific App Analytics by Platform
      • Web-Based
      • Mobile-Based
    • Asia-Pacific App Analytics by Application
      • Revenue Analytics
      • App Performance Analytics and Operations
      • Crash Analytics
      • Cross Platform Analysis
      • User Analytics
      • In-Behavioral Analytics
      • Ad Monitoring and Marketing Analytics
      • Campaign Analytics
      • Others
    • Asia-Pacific App Analytics by Industry Vertical
      • BFSI
      • Retail
      • Media and Entertainment
      • Logistics, Travel, and Transport (LTT)
      • Telecom and IT
      • Healthcare
      • Hospitality
      • Others
    • China Outlook (USD Million, 2018-2030)

    • China App Analytics by Platform
      • Web-Based
      • Mobile-Based
    • China App Analytics by Application
      • Revenue Analytics
      • App Performance Analytics and Operations
      • Crash Analytics
      • Cross Platform Analysis
      • User Analytics
      • In-Behavioral Analytics
      • Ad Monitoring and Marketing Analytics
      • Campaign Analytics
      • Others
    • China App Analytics by Industry Vertical
      • BFSI
      • Retail
      • Media and Entertainment
      • Logistics, Travel, and Transport (LTT)
      • Telecom and IT
      • Healthcare
      • Hospitality
      • Others
    • Japan Outlook (USD Million, 2018-2030)

    • Japan App Analytics by Platform
      • Web-Based
      • Mobile-Based
    • Japan App Analytics by Application
      • Revenue Analytics
      • App Performance Analytics and Operations
      • Crash Analytics
      • Cross Platform Analysis
      • User Analytics
      • In-Behavioral Analytics
      • Ad Monitoring and Marketing Analytics
      • Campaign Analytics
      • Others
    • Japan App Analytics by Industry Vertical
      • BFSI
      • Retail
      • Media and Entertainment
      • Logistics, Travel, and Transport (LTT)
      • Telecom and IT
      • Healthcare
      • Hospitality
      • Others
    • India Outlook (USD Million, 2018-2030)

    • India App Analytics by Platform
      • Web-Based
      • Mobile-Based
    • India App Analytics by Application
      • Revenue Analytics
      • App Performance Analytics and Operations
      • Crash Analytics
      • Cross Platform Analysis
      • User Analytics
      • In-Behavioral Analytics
      • Ad Monitoring and Marketing Analytics
      • Campaign Analytics
      • Others
    • India App Analytics by Industry Vertical
      • BFSI
      • Retail
      • Media and Entertainment
      • Logistics, Travel, and Transport (LTT)
      • Telecom and IT
      • Healthcare
      • Hospitality
      • Others
    • Australia Outlook (USD Million, 2018-2030)

    • Australia App Analytics by Platform
      • Web-Based
      • Mobile-Based
    • Australia App Analytics by Application
      • Revenue Analytics
      • App Performance Analytics and Operations
      • Crash Analytics
      • Cross Platform Analysis
      • User Analytics
      • In-Behavioral Analytics
      • Ad Monitoring and Marketing Analytics
      • Campaign Analytics
      • Others
    • Australia App Analytics by Industry Vertical
      • BFSI
      • Retail
      • Media and Entertainment
      • Logistics, Travel, and Transport (LTT)
      • Telecom and IT
      • Healthcare
      • Hospitality
      • Others
    • Rest of Asia-Pacific Outlook (USD Million, 2018-2030)

    • Rest of Asia-Pacific App Analytics by Platform
      • Web-Based
      • Mobile-Based
    • Rest of Asia-Pacific App Analytics by Application
      • Revenue Analytics
      • App Performance Analytics and Operations
      • Crash Analytics
      • Cross Platform Analysis
      • User Analytics
      • In-Behavioral Analytics
      • Ad Monitoring and Marketing Analytics
      • Campaign Analytics
      • Others
    • Rest of Asia-Pacific App Analytics by Industry Vertical
      • BFSI
      • Retail
      • Media and Entertainment
      • Logistics, Travel, and Transport (LTT)
      • Telecom and IT
      • Healthcare
      • Hospitality
      • Others
  • Rest of the World Outlook (USD Million, 2018-2030)

    • Rest of the World App Analytics by Platform
      • Web-Based
      • Mobile-Based
    • Rest of the World App Analytics by Application
      • Revenue Analytics
      • App Performance Analytics and Operations
      • Crash Analytics
      • Cross Platform Analysis
      • User Analytics
      • In-Behavioral Analytics
      • Ad Monitoring and Marketing Analytics
      • Campaign Analytics
      • Others
    • Rest of the World App Analytics by Industry Vertical
      • BFSI
      • Retail
      • Media and Entertainment
      • Logistics, Travel, and Transport (LTT)
      • Telecom and IT
      • Healthcare
      • Hospitality
      • Others
    • Middle East Outlook (USD Million, 2018-2030)

    • Middle East App Analytics by Platform
      • Web-Based
      • Mobile-Based
    • Middle East App Analytics by Application
      • Revenue Analytics
      • App Performance Analytics and Operations
      • Crash Analytics
      • Cross Platform Analysis
      • User Analytics
      • In-Behavioral Analytics
      • Ad Monitoring and Marketing Analytics
      • Campaign Analytics
      • Others
    • Middle East App Analytics by Industry Vertical
      • BFSI
      • Retail
      • Media and Entertainment
      • Logistics, Travel, and Transport (LTT)
      • Telecom and IT
      • Healthcare
      • Hospitality
      • Others
    • Africa Outlook (USD Million, 2018-2030)

    • Africa App Analytics by Platform
      • Web-Based
      • Mobile-Based
    • Africa App Analytics by Application
      • Revenue Analytics
      • App Performance Analytics and Operations
      • Crash Analytics
      • Cross Platform Analysis
      • User Analytics
      • In-Behavioral Analytics
      • Ad Monitoring and Marketing Analytics
      • Campaign Analytics
      • Others
    • Africa App Analytics by Industry Vertical
      • BFSI
      • Retail
      • Media and Entertainment
      • Logistics, Travel, and Transport (LTT)
      • Telecom and IT
      • Healthcare
      • Hospitality
      • Others
    • Latin America Outlook (USD Million, 2018-2030)

    • Latin America App Analytics by Platform
      • Web-Based
      • Mobile-Based
    • Latin America App Analytics by Application
      • Revenue Analytics
      • App Performance Analytics and Operations
      • Crash Analytics
      • Cross Platform Analysis
      • User Analytics
      • In-Behavioral Analytics
      • Ad Monitoring and Marketing Analytics
      • Campaign Analytics
      • Others
    • Latin America App Analytics by Industry Vertical
      • BFSI
      • Retail
      • Media and Entertainment
      • Logistics, Travel, and Transport (LTT)
      • Telecom and IT
      • Healthcare
      • Hospitality
      • Others
Infographic

Free Sample Request

Kindly complete the form below to receive a free sample of this Report

Get Free Sample

Customer Strories

“I am very pleased with how market segments have been defined in a relevant way for my purposes (such as "Portable Freezers & refrigerators" and "last-mile"). In general the report is well structured. Thanks very much for your efforts.”

Victoria Milne

Founder

Compare Licence

×
Features License Type
Single User Multiuser License Enterprise User
Price $4,950 $5,950 $7,250
Maximum User Access Limit 1 User Upto 10 Users Unrestricted Access Throughout the Organization
Free Customization
Direct Access to Analyst
Deliverable Format
Platform Access
Discount on Next Purchase 10% 15% 15%
Printable Versions