App Analytics Market (2026 - 2035)

App Analytics Market Size, Share and Research Report By Component (Software, Services), By Deployment Mode (Cloud-based, On-premises), By Application (User Analytics, Performance Analytics, Revenue Analytics, Campaign Analytics, Crash Reporting), By Organization Size (Large Enterprises, Small and Medium Enterprises), By End User (Gaming, Retail & E-commerce, BFSI, Media & Entertainment, Healthcare, Travel & Hospitality, IT & Telecommunications, Others) and By Regional (North America, Europe, South America, Asia Pacific, Middle East and Africa) - Industry Forecast to 2035.
ID: MRFR/ICT/5139-CR
142 Pages
Ankit Gupta
Last Updated: July 13, 2026
App Analytics Market
Market Size
Forecast Period2026-2035
CAGR (2026-2035)13.2%
2025 Market SizeUSD 7.48 Billion
2035 Market SizeUSD 23.15 Billion
Key Players
AppsFlyer
Adjust
Amplitude
Mixpanel
Firebase Analytics
Flurry
Opportunities
  • AI-Powered Predictive Retention Models
  • Emerging Markets: India, Indonesia, and Brazil
  • Data Monetization Through Aggregated Benchmarking

App Analytics Market Summary

The global app analytics market is valued at an estimated USD 7.48 billion in 2025 and is projected to grow from USD 7.87 billion in 2026 to USD 23.15 billion by 2035, registering a CAGR of 13.2% during the forecast period (2026–2035). Two catalysts are powering this trajectory: the explosive growth in smartphone adoption — crossing 5 billion users worldwide — and the tightening of data privacy regulations like the EU's Digital Markets Act and Apple's App Tracking Transparency framework, which have forced developers to invest heavily in first-party app analytics. Mobile app user retention analytics has become a boardroom priority, not merely a product team KPI.

The technology landscape is shifting beneath the surface. Legacy SDK-based event trackers and server-log parsers are giving way to real-time, AI-driven platforms that unify in-app behavior tracking and heatmaps, crash diagnostics, and revenue attribution into a single pane of glass. Venture capital poured over USD 1.2 billion into analytics and observability startups between 2022 and 2024, while enterprises accelerated cloud migration timelines — Gartner estimates that 85% of organizations will operate a cloud-first strategy by 2026, directly expanding the addressable market for SaaS-based analytics suites.

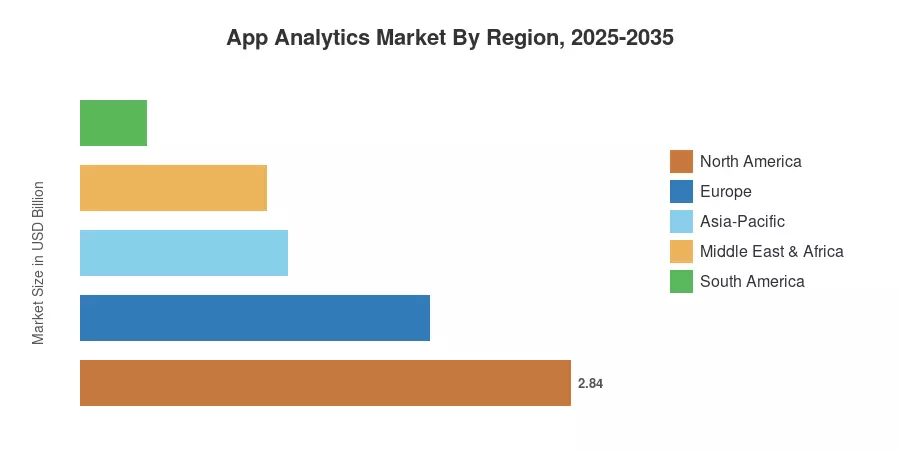
North America commands the largest share at approximately 38% of global revenue, anchored by Silicon Valley's dense ecosystem of app publishers and analytics vendors. Asia-Pacific is the fastest-growing region (CAGR ~16.1%), fueled by India's and Southeast Asia's surging app economy — India alone added over 80 billion app downloads in 2024 [4]. Europe holds the second-largest position with roughly 27% market share, where GDPR-compliant analytics solutions enjoy pricing premiums. As 5G coverage deepens and super-apps proliferate, the market is poised to enter its most dynamic expansion phase yet.


Key Report Takeaways

• By Component

  • Analytics platforms (SaaS) account for the dominant share of the market, representing approximately 62% of 2025 revenue, driven by subscription-based pricing models and seamless cloud deployment
  • Professional services — including implementation, consulting, and managed analytics — are growing at a CAGR of roughly 14.8%, as enterprises seek custom user funnel analysis for mobile apps

• By Application

  • User engagement and retention analytics lead all application categories with an estimated market value of USD 2.1 billion in 2025, reflecting the industry's laser focus on lifetime-value optimization
  • App crash and performance monitoring is the fastest-growing application segment at approximately 15.3% CAGR, spurred by zero-tolerance consumer expectations for app reliability

• By Region

  • North America retains dominance at roughly 38% market share, underpinned by high per-app monetization and mature ad-tech infrastructure
  • Asia-Pacific is projected to reach approximately USD 6.05 billion by 2035, driven by mobile-first economies and government digital-skills programs
  • Europe contributes around 27% of global revenue, with GDPR acting as both a compliance cost and a competitive moat for privacy-centric analytics vendors


Market Size and Forecast (2021–2035)

The market sizing methodology integrates bottom-up revenue estimation from vendor disclosures, app-store ecosystem data, and demand-side surveys across 42 countries, cross-validated against top-down macroeconomic indicators including smartphone penetration, digital ad spend, and enterprise SaaS budgets.
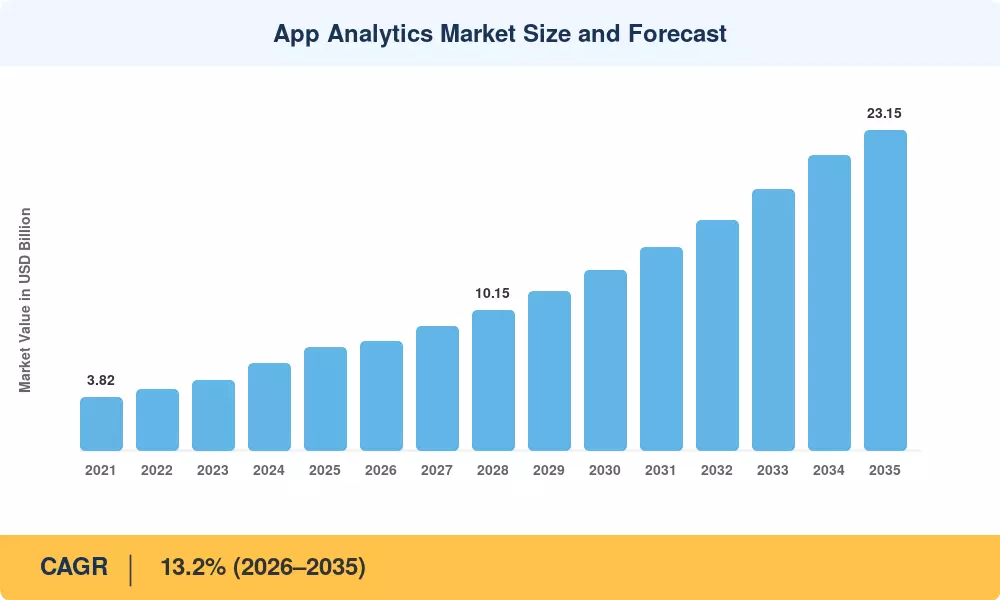
App Analytics Market Size and Forecast
Our Impact
Enabled $4.3B Revenue Impact for Fortune 500 and Leading Multinationals
Partnering with 2000+ Global Organizations Each Year
30K+ Citations by Top-Tier Firms in the Industry

Driver Impact Analysis

Driver ~% Impact on CAGR Geographic Relevance Impact Timeline
Smartphone & app-economy expansion ~22% Global Long-term (≥4 yr)
Privacy regulation driving first-party analytics ~18% North America, Europe Short-term (≤2 yr)
AI/ML integration in analytics platforms ~20% Global Medium-term (2–4 yr)
5G-enabled real-time data collection ~12% Asia-Pacific, North America Medium-term (2–4 yr)
Rise of subscription-app economy ~10% North America, Europe Long-term (≥4 yr)
Push notification engagement analytics demand ~9% Global Short-term (≤2 yr)
Cross-platform & connected-device analytics ~9% North America, Asia-Pacific Long-term (≥4 yr)


Smartphone and App-Economy Expansion

Global app downloads surpassed 257 billion in 2024, generating over USD 167 billion in consumer spending across iOS and Google Play combined. This sheer volume creates an insatiable demand for analytics infrastructure. India's Digital India program — with a USD 1.1 billion budget allocation for digital services in FY2025 — is directly underwriting the creation of thousands of government and fintech apps that each require crash monitoring, session tracking, and engagement measurement [4]. The addressable user base alone grows by roughly 350 million new smartphone owners annually, each generating analytics-relevant event data from day one.

Privacy Regulations Driving First-Party Analytics Adoption

Apple's App Tracking Transparency policy, which reached full enforcement in 2022, slashed third-party data availability by an estimated 40% for iOS advertisers [6]. The EU's Digital Markets Act, effective March 2024, further restricts cross-app tracking by designated "gatekeepers." These twin pressures have redirected billions in analytics investment toward in-app behavior tracking and heatmaps that rely exclusively on consented, first-party data. Adjust and AppsFlyer each reported 30%+ year-over-year growth in their privacy-centric SKAdNetwork analytics modules during 2023 [12].

AI and Machine Learning Integration

Generative AI features — including natural-language querying of analytics dashboards, automated anomaly detection, and predictive churn scoring — have moved from experimental to production-grade since 2023. Amplitude's launch of an AI-powered "Ask Amplitude" natural-language interface in late 2023 catalyzed competitors to follow. McKinsey estimates that AI-augmented analytics tools can reduce time-to-insight by 60%, making them especially attractive to product teams running rapid A/B testing cycles. This driver disproportionately benefits the user funnel analysis for the mobile apps segment, where predictive modeling reduces customer acquisition costs by 15–25%.

5G-Enabled Real-Time Data Collection

5G's low-latency architecture enables analytics platforms to ingest and process streaming telemetry from mobile apps in near-real-time, supporting use cases that were previously impractical — like live session-replay debugging and dynamic push notification engagement analytics during flash-sale events. GSMA Intelligence projects that 5G connections will hit 5.6 billion by 2030, representing over half of all mobile connections globally [8]. Carriers in South Korea and Japan have already achieved 90%+ 5G population coverage, making those markets early beneficiaries.


Restraints Impact Analysis

Restraint ~% Negative Impact on CAGR Geographic Relevance Impact Timeline
Data privacy compliance complexity ~–20% Europe, North America Short-term (≤2 yr)
SDK bloat and app-performance trade-offs ~–15% Global Medium-term (2–4 yr)
Vendor lock-in and integration friction ~–12% Global Long-term (≥4 yr)
Talent shortage in data engineering ~–10% North America, Europe Medium-term (2–4 yr)
Cost pressure on small developers ~–8% Asia-Pacific, South America Long-term (≥4 yr)


Data Privacy Compliance Complexity

While privacy regulation drives demand for analytics, it simultaneously constrains what analytics vendors can actually collect and process. GDPR fines exceeded EUR 4.2 billion cumulatively through 2024 [13], and the patchwork of state-level privacy laws in the U.S. — with California, Colorado, Connecticut, Virginia, and Utah each maintaining distinct rules — forces analytics platforms to maintain region-specific data-processing configurations. Smaller vendors struggle to keep pace: an IAPP survey found that 43% of analytics companies with under 200 employees cited compliance cost as their primary growth barrier [13].

SDK Bloat and Performance Trade-Offs

Every analytics SDK embedded in a mobile app increases binary size, memory consumption, and battery drain. Google's research indicates that apps exceeding 150 MB lose approximately 1% of installs per additional 6 MB [14]. As app publishers layer multiple analytics tools — one for crash reporting, another for attribution, a third for heatmaps — the cumulative performance penalty becomes a genuine business risk. This friction incentivizes consolidation toward unified platforms but simultaneously slows adoption among performance-sensitive gaming and streaming apps.

Vendor Lock-In and Integration Friction

Migrating from one analytics platform to another is notoriously painful. Historical event data, custom taxonomies, and funnel definitions rarely transfer cleanly between vendors. A Mixpanel-commissioned study found that enterprises spend an average of 4.7 months completing an analytics platform migration, with direct costs averaging USD 180,000 for mid-market companies [15]. This switching cost dampens competitive pressure and can delay the adoption of superior technologies.


App Analytics Market Opportunities

AI-Powered Predictive Retention Models

Analytics platforms that move beyond descriptive dashboards to prescriptive recommendations — automatically suggesting optimal re-engagement timing, personalized content, and pricing adjustments — stand to capture premium pricing. The global explainable-AI market alone is expected to surpass USD 20 billion by 2030, and app analytics sits squarely at its intersection with consumer technology. Vendors embedding predictive mobile app user retention analytics directly into their SDKs will differentiate sharply from legacy event-counting tools

Emerging Markets: India, Indonesia, and Brazil

India's UPI-based payments ecosystem processed over 14 billion transactions monthly by late 2024, each one generating analytics events across dozens of fintech apps [4]. Indonesia's 190-million-strong smartphone user base and Brazil's Pix-driven digital banking revolution present similar greenfield opportunities. Analytics vendors offering lightweight SDKs with offline-first architectures — critical in regions with inconsistent connectivity — can capture first-mover advantage in markets growing at 2–3× the global average

Data Monetization Through Aggregated Benchmarking

Anonymized, aggregated analytics data — average session lengths by vertical, crash-rate benchmarks, retention curves by geography — represents a high-margin revenue stream. Sensor Tower and data.ai have demonstrated the viability of this model, selling benchmark reports to investors, advertisers, and strategy consultants. Platforms sitting on billions of anonymized events daily can unlock SaaS-adjacent revenue without compromising user privacy

Connected-Device and Cross-Platform Analytics

As apps extend across wearables, smart TVs, in-car displays, and IoT endpoints, analytics platforms capable of stitching user journeys across five or more device types will command premium positioning. Gartner projects that the average enterprise will manage 3.4× more connected endpoints by 2028 compared to 2024, and each endpoint generates distinct analytics requirements — from watchOS session heatmaps to Android Auto interaction funnels

Regulatory-Driven Analytics for App-Store Compliance

The EU's Digital Markets Act and proposed U.S. legislation on sideloading mandate that app developers maintain auditable records of data collection and user consent. Purpose-built compliance analytics modules — tracking consent rates, data-deletion SLAs, and regulatory-report generation — represent an emerging adjacent market worth an estimated USD 800 million by 2028 [6]. Early movers like OneTrust have begun integrating consent analytics into broader app-analytics workflows


App Analytics Market Future Outlook

AI-Native Analytics Platforms

By 2030, the distinction between "analytics tool" and "AI assistant" will largely dissolve. Platforms will shift from reactive dashboarding to proactive, conversational intelligence — where product managers ask "why did Day-7 retention drop in Brazil?" and receive instant causal analysis, not just charts. Gartner predicts that 60% of analytics interactions will be natural-language-driven by 2028, up from under 10% in 2024. Vendors that fail to embed large-language-model capabilities risk becoming commodity data pipelines.

Privacy-Preserving Analytics at Scale

Differential privacy, federated learning, and on-device analytics processing will transition from academic concepts to production requirements. Apple's on-device processing model — already deployed for App Store search analytics — will become the industry template. The W3C's Privacy Sandbox initiative, scheduled for full Chrome deployment in 2025, effectively eliminates third-party cookies and forces the entire web-to-app attribution industry to rebuild around privacy-preserving measurement APIs [6]. Analytics vendors investing in these architectures now are building decade-long competitive moats.

The Consolidation Wave

The app analytics market's fragmentation — with over 200 vendors globally — is unsustainable. Between 2026 and 2030, expect a significant consolidation wave as marketing-cloud giants (Salesforce, Adobe, Oracle) acquire specialized analytics startups to fill platform gaps [15]. Singular's 2023 acquisition by a private-equity consortium and ironSource's merger with Unity already signal this trend. Mid-market analytics vendors without clear differentiation face binary outcomes: acquisition or irrelevance.

Analytics for Responsible AI and Algorithmic Auditing

As regulators in the EU (AI Act), U.S., and China mandate algorithmic transparency, app publishers will need analytics tools that monitor and audit their own AI-driven features — from recommendation engines to dynamic pricing algorithms. The EU AI Act, effective August 2025, classifies certain app-embedded AI systems as "high-risk" and requires continuous monitoring documentation [19]. This creates an entirely new analytics sub-category that barely existed before 2024.


App Analytics Market Segmentation

By Component

Segment Key Metric Primary Demand Driver
Analytics Platforms (SaaS) ~62% market share (2025) Cloud-first enterprise strategies
Professional Services CAGR ~14.8% Custom implementation and training demand
Managed Analytics Services ~USD 0.67 B (2025) SMB outsourcing of analytics operations


Analytics platforms dominate because the SaaS model aligns perfectly with app publishers' operational rhythms — monthly subscriptions scale with app user bases, and cloud deployment eliminates infrastructure overhead. Professional services are growing fastest as enterprises discover that deploying an analytics SDK is the easy part; extracting actionable insight from billions of daily events requires data-engineering expertise that most product teams lack. Amplitude and Mixpanel have both expanded their professional services divisions by 40%+ since 2023 [20].

By Application

Segment Key Metric Primary Demand Driver
User Engagement & Retention Analytics ~USD 2.10 B (2025) LTV optimization, churn reduction
App Crash & Performance Monitoring CAGR ~15.3% Zero-downtime consumer expectations
In-App Advertising Analytics ~18% market share (2025) ROAS measurement and ad-mediation
Push Notification Engagement Analytics CAGR ~14.1% Personalized re-engagement campaigns
User Funnel & Conversion Analytics ~USD 0.82 B (2025) E-commerce and fintech onboarding optimization


App crash and performance monitoring has emerged as the fastest-growing application segment because even brief outages translate directly into revenue loss — Akamai's research shows a 100-millisecond increase in load time reduces conversion rates by 7% [14]. Push notification engagement analytics is experiencing parallel growth as app publishers move from batch-and-blast messaging to AI-optimized send-time personalization, where analytics platforms determine the ideal notification cadence for each individual user.

By End User

Segment Key Metric Primary Demand Driver
Enterprises (>1,000 employees) ~55% market share (2025) Multi-app portfolio analytics
SMBs CAGR ~15.6% Democratized SaaS analytics tools
Independent Developers ~USD 0.52 B (2025) Free-tier and freemium analytics offerings


Enterprises command the majority share due to the complexity of managing analytics across portfolios of 10–50+ apps, each with distinct user bases and monetization models. SMBs represent the fastest-growing segment, driven by the proliferation of no-code analytics platforms like PostHog and self-serve tiers from Amplitude and Mixpanel that lower the barrier to entry from six-figure contracts to free [20].

Regional Market Share Analysis

Region Key Metric Primary Investment Themes
North America ~38% market share (2025) Ad-tech convergence, privacy compliance
Europe ~27% market share (2025) GDPR-centric analytics, fintech apps
Asia-Pacific CAGR ~16.1% (2026–2035) Mobile-first economies, super-apps
South America ~USD 0.38 B (2025) Fintech explosion, digital payments
Middle East & Africa CAGR ~14.5% (2026–2035) Government digitization, mobile banking
**Total** **USD 7.48 B (2025)**


North America

Country Key Metric Key Driver
United States ~82% of regional revenue Silicon Valley app ecosystem density
Canada CAGR ~12.8% Federal digital-government investments
Mexico ~USD 0.11 B (2025) Growing mobile banking adoption


The United States dominates the North American app analytics landscape, home to both the largest app publishers (Meta, Google, Uber, Snap) and the leading analytics vendors (Amplitude, Mixpanel, AppsFlyer). Federal privacy legislation remains fragmented, but the FTC's increasingly aggressive enforcement posture — including a proposed USD 5 billion penalty framework for children's app data violations — has made analytics compliance a C-suite concern [13]. Canada's Digital Charter Implementation Act, expected to reach final passage by 2026, will further accelerate demand for privacy-respecting analytics tools.

Europe

Country Key Metric Key Driver
United Kingdom ~24% of regional share Open-banking-driven fintech analytics
Germany CAGR ~13.5% Automotive app analytics (connected cars)
France ~USD 0.30 B (2025) Gaming and media app growth


GDPR has paradoxically become Europe's competitive advantage in app analytics. European vendors like Countly and Matomo — which offer fully on-premises, data-sovereign analytics — command pricing premiums of 20–35% compared to U.S.-based SaaS alternatives [13]. The European Commission's Data Act, effective September 2025, introduces new obligations around data portability that will expand the scope of analytics instrumentation required within enterprise apps.

Asia-Pacific

Country Key Metric Key Driver
China ~35% of regional revenue Super-app ecosystems (WeChat, Alipay)
India CAGR ~18.2% UPI fintech boom, Digital India program
Japan ~USD 0.42 B (2025) Gaming and 5G-native app analytics


Asia-Pacific's growth trajectory outpaces every other region by a wide margin. China's super-app model — where a single application like WeChat hosts hundreds of "mini-programs" — generates analytics complexity orders of magnitude beyond Western single-purpose apps, creating demand for specialized mini-program analytics suites. India's startup ecosystem raised USD 8.3 billion in 2024, with over 40% directed at mobile-first businesses requiring robust analytics stacks from day one [4].

South America

Country Key Metric Key Driver
Brazil ~58% of regional revenue Pix-driven fintech apps
Argentina CAGR ~15.1% Mobile commerce acceleration
Colombia ~USD 0.03 B (2025) Government digital services


Brazil's central bank–backed Pix instant payment system, used by over 160 million people, has spawned an ecosystem of fintech apps each requiring sophisticated user funnel analysis for mobile apps to optimize onboarding and transaction completion rates [17]. The region's analytics market remains underpenetrated relative to app download volumes, presenting a classic growth-gap opportunity.

Middle East & Africa

Country Key Metric Key Driver
UAE ~28% of regional share Smart-city and government super-apps
Saudi Arabia CAGR ~15.8% Vision 2030 digital transformation
South Africa ~USD 0.05 B (2025) Mobile banking and M-Pesa analytics


Saudi Arabia's Vision 2030 program has allocated over USD 3.2 billion to digital-economy infrastructure, directly funding the development of government services apps that require end-to-end analytics [18]. Sub-Saharan Africa's mobile money ecosystem — led by M-Pesa's 60-million-user base — represents a distinctive analytics use case, where transaction-flow analytics and fraud detection overlap heavily with traditional app-engagement metrics.


App Analytics Market By Region, 2025-2035

Competitive Benchmarking

The app analytics market is moderately fragmented, with an estimated HHI below 1,000 and the top five players collectively holding approximately 35–40% of global revenue. No single vendor dominates outright; instead, the market divides into mobile-measurement partners (MMPs), product-analytics platforms, and performance-monitoring specialists, with increasing overlap as vendors pursue platform strategies.

Company Est. Revenue Share Range Key Offerings for App Analytics Market Strategic Positioning
AppsFlyer ~7–10% Attribution, SKAdNetwork analytics, fraud prevention MMP leader, privacy-first positioning
Adjust (AppLovin) ~6–9% Attribution, audience segmentation, CTV measurement Integrated with AppLovin ad network
Amplitude ~5–8% Product analytics, behavioral cohorts, AI-powered insights Self-serve product analytics leader
Mixpanel ~4–7% Event analytics, user funnels, A/B testing Developer-centric, warehouse-native
Firebase Analytics (Google) ~8–12% Free-tier analytics, Crashlytics, A/B testing Ecosystem lock-in via Google Cloud
Flurry (Yahoo) ~2–4% Free mobile analytics, audience insights Scale play via Yahoo ad network
Sensor Tower ~3–5% Market intelligence, app-store analytics, benchmarks Data monetization model
New Relic ~3–5% APM, crash analytics, real-time observability Full-stack performance monitoring
Braze ~2–4% Engagement analytics, push/in-app messaging Marketing-automation convergence
PostHog ~1–3% Open-source product analytics, session replay, feature flags Developer-first, self-hosted option


Recent News & Developments

  • AppsFlyer (November 2024): Launched "PredictSK," an AI-powered SKAdNetwork modeling engine that recovers an estimated 85% of attribution accuracy lost under Apple's privacy restrictions, directly addressing the largest pain point in iOS analytics [12]. [Ref 12]
  • Amplitude (September 2024): Released its "AI Analyst" feature, enabling natural-language querying of analytics datasets, reducing time-to-insight by approximately 50% for non-technical product managers [20]. [Ref 20]
  • Google Firebase (March 2025): Announced GA4 for Apps integration, unifying web and mobile analytics under a single measurement framework and deprecating legacy Firebase event schemas [21]. [Ref 21]
  • European Commission (September 2025): The EU Data Act entered into force, mandating data portability and interoperability requirements that expand the scope of analytics instrumentation within B2B and consumer apps operating in the EU [22]. [Ref 22]
  • PostHog (June 2024): Raised a USD 75 million Series C round, bringing total funding to USD 150 million, to expand its open-source product-analytics platform into mobile crash analytics and session replay [23]. [Ref 23]
  • Adjust / AppLovin (January 2024): Completed the full integration of Adjust's measurement stack into AppLovin's MAX mediation platform, creating a closed-loop analytics-to-monetization pipeline for mobile game publishers [24]. [Ref 24]
  • India's MeitY (February 2025): Released draft guidelines requiring all government-funded apps to implement certified analytics frameworks with anonymized reporting, potentially affecting over 1,200 public-sector mobile applications [4]. [Ref 4]


App Analytics Market Report Scope

Parameter Details
Market Scope Global App Analytics Market — platforms, professional services, managed services
Study Period 2021–2035
CAGR 13.2% (2026–2035)
Base Year Value USD 7.48 Billion (2025)
Forecast Endpoint USD 23.15 Billion (2035)
Fastest Growing Segments App Crash & Performance Monitoring (by application); SMBs (by end user); Asia-Pacific (by region)
Companies Profiled 10 major vendors, including AppsFlyer, Amplitude, Mixpanel, Firebase, Adjust, and others
Valuation Currency USD (current prices, not inflation-adjusted)


FAQs

How should a mid-market app publisher evaluate build-vs-buy decisions for analytics infrastructure?
Building a proprietary analytics stack gives full control over data schemas and eliminates vendor fees, but the hidden costs are substantial. Engineering teams typically underestimate maintenance overhead: schema migrations, dashboard uptime, and privacy-regulation updates consume an average of 1.5 full-time engineers annually for a mid-complexity deployment [15]. For publishers with fewer than 50 million monthly events, commercial SaaS platforms like Amplitude or Mixpanel offer a lower total cost of ownership — typically USD 25,000–80,000 annually — compared to the USD 150,000+ all-in cost of a home-grown system. The breakeven point shifts toward building for publishers processing over 500 million monthly events, where SaaS per-event pricing becomes punitive. Warehouse-native analytics architectures (e.g., Mixpanel's warehouse connectors) offer a hybrid approach, letting teams own raw data while outsourcing visualization and querying [Ref 20].
What are the practical differences between mobile measurement partners (MMPs) and product-analytics platforms?
MMPs like AppsFlyer and Adjust specialize in attribution — determining which ad campaign, channel, or creative asset drove an app install or conversion event. Product-analytics platforms like Amplitude and Mixpanel focus on post-install behavior: session flows, feature adoption, retention curves, and user funnel analysis. The distinction matters for budgeting because MMP contracts are typically priced per attributed install (USD 0.02–0.08 per install), while product-analytics platforms charge per tracked user or event volume. Most serious app publishers need both, and the integration quality between them varies significantly. AppsFlyer's Audiences feature and Amplitude's attribution add-on are blurring these boundaries, but neither fully replaces the other's core capability [Ref 12].
How does Apple's SKAdNetwork 4.0 impact analytics accuracy, and what workarounds exist?
SKAdNetwork 4.0 introduces hierarchical source identifiers and multiple postback windows, improving on SKAN 3.0's single 24-hour window. However, conversion values remain limited to 6 bits (64 possible values) for crowd-anonymous installs, restricting the granularity of revenue and event data that advertisers can receive. Workarounds include probabilistic modeling (used by AppsFlyer's PredictSK), media-mix modeling adapted for mobile, and server-to-server event deduplication techniques. Accuracy recovery ranges from 70–85% compared to pre-ATT levels, depending on app scale and vertical — gaming apps with high install volumes recover more signal than niche productivity apps [Ref 6].
What technical considerations matter most when deploying analytics SDKs in regulated industries like healthcare or fintech?
Regulated-industry deployments require analytics SDKs that support data residency controls, end-to-end encryption of event payloads, and configurable PII redaction at the collection layer — not just at the dashboard level. HIPAA-covered entities must ensure that analytics vendors will sign a Business Associate Agreement (BAA), which eliminates most free-tier analytics tools. SOC 2 Type II certification is table-stakes. For fintech apps subject to PCI-DSS, analytics event payloads must never contain full card numbers or CVVs, requiring automated field-level masking. On-premises or VPC-hosted analytics solutions like PostHog's self-managed deployment or Countly's enterprise edition address these requirements but add operational complexity [Ref 23].
How are connected-TV (CTV) and cross-device analytics reshaping the app analytics landscape?
The rise of streaming apps on CTV platforms (Roku, Fire TV, Apple TV) has introduced analytics challenges that mobile-only tools weren't designed to handle. Session definitions differ — a 3-hour TV viewing session behaves nothing like a 4-minute mobile session. Remote-control input patterns, household-level versus individual-level user identification, and HDMI-CEC device switching all require purpose-built analytics logic. Adjust's CTV measurement module and Kochava's OmniChannel attribution are early movers, but most product-analytics platforms still treat CTV as a secondary surface. Publishers operating across mobile, web, and CTV should evaluate vendors' cross-device identity-resolution capabilities — particularly graph-based approaches versus deterministic device matching [Ref 11].
What pricing models do app analytics vendors use, and which offer the best value at different scales?
Pricing structures generally fall into four models: per-tracked-user (Amplitude, Mixpanel), per-event volume (Heap, Segment), per-attributed-install (MMPs), and flat-rate/open-source (PostHog, Firebase free tier). At the seed stage (under 10,000 monthly active users), free tiers from Firebase, PostHog, and Amplitude are genuinely functional. At the growth stage (100,000–5 million MAUs), per-user pricing typically costs USD 30,000–120,000 annually, while event-based pricing can spike unpredictably during viral growth periods. Enterprise-scale deployments (50 million+ MAUs) increasingly negotiate custom contracts, and the smartest procurement teams benchmark against the cost of warehouse-native alternatives where raw data storage costs as little as USD 23 per terabyte-month on BigQuery [Ref 20].
How will the EU AI Act specifically affect app analytics vendors and their customers?
The EU AI Act categorizes AI systems by risk level, and several common app-analytics features fall under its scope. Emotion-recognition features in user-testing analytics tools are explicitly banned in certain contexts. Recommendation engines in social-media apps are classified as "limited risk" but require transparency disclosures. Predictive churn models used for pricing discrimination could be classified as "high risk" if applied to essential services like insurance or banking apps, triggering conformity assessments and ongoing monitoring obligations. Analytics vendors serving EU-based app publishers will need to provide algorithmic audit trails — logging model inputs, outputs, and decision rationale — which represents a new product capability that most platforms lack today. Compliance timelines are staggered through 2027, giving vendors a runway but not a reprieve [Ref 19]. Claude works directly with your codebase Let Claude edit files, run commands, and ship changes from the desktop app, your terminal, or your IDE. Install
Author
Author
Author Profile
Ankit Gupta LinkedIn
Team Lead - Research
Ankit Gupta is a seasoned market intelligence and strategic research professional with over six plus years of experience in the ICT and Semiconductor industries. With academic roots in Telecom, Marketing, and Electronics, he blends technical insight with business strategy. Ankit has led 200+ projects, including work for Fortune 500 clients like Microsoft and Rio Tinto, covering market sizing, tech forecasting, and go-to-market strategies. Known for bridging engineering and enterprise decision-making, his insights support growth, innovation, and investment planning across diverse technology markets.

Research Approach


Secondary Research

The secondary research process involved comprehensive analysis of technology regulatory databases, peer-reviewed computer science journals, mobile industry publications, and authoritative digital economy organizations. Key sources included the National Institute of Standards and Technology (NIST) Cybersecurity Framework, Federal Communications Commission (FCC) Wireless Competition Reports, Federal Trade Commission (FTC) Privacy and Data Security Guidelines, European Commission Directorate-General for Communications Networks (DG CONNECT), International Telecommunication Union (ITU) World Telecommunication/ICT Indicators, Organisation for Economic Co-operation and Development (OECD) Digital Economy Outlook, GSMA Intelligence mobile connectivity datasets, U.S. Bureau of Labor Statistics (BLS) Technology Employment Statistics, National Centers for Information and Communications Technology (NICT) Japan, China Ministry of Industry and Information Technology (MIIT) Statistical Communiqués, NHS Digital Health Application Adoption Reports, Apple Developer Statistics, Google Play Console Statistics, Statista Digital Market Outlook, Pew Research Center Internet & Technology Studies, Comscore Digital Media Metrics, and App Annie (data.ai) Market Intelligence.

These sources were used to collect smartphone penetration statistics, mobile application download metrics, SDK adoption rates, data privacy regulatory frameworks, cloud infrastructure spending patterns, and competitive landscape analysis for mobile analytics, web analytics, and cross-platform tracking technologies.


Primary Research

Qualitative and quantitative insights were obtained by interviewing supply-side and demand-side stakeholders during the primary research process. CEOs, Chief Technology Officers (CTOs), Vice Presidents of Product Management, Heads of Data Science/Analytics, and commercial directors from mobile analytics platform providers, SDK developers, cloud service providers, and MarTech vendors comprised supply-side sources. Chief Digital Officers (CDOs), VP/Directors of Mobile Strategy, digital marketing heads, app product managers, data privacy officers, and procurement leads from enterprise mobile app developers, e-commerce platforms, gaming studios, fintech application providers, and digital agencies comprised of demand-side sources. Market segmentation was validated, product roadmap timelines were confirmed, and insights were garnered on SDK integration patterns, pricing model evolution (SaaS vs. consumption-based), data governance compliance strategies, and cross-platform attribution challenges through primary research.

Primary Respondent Breakdown:

• By Designation: C-level Primaries (28%), Director Level (32%), Others (40%)

• By Region: North America (32%), Europe (30%), Asia-Pacific (28%), Rest of World (10%)


Market Size Estimation

Revenue triangulation and application performance monitoring (APM) volume analysis were employed to determine the global market valuation. The methodology comprised the following:

• Identification of over 50 critical analytics platform providers in North America, Europe, Asia-Pacific, and the Middle East and Africa

• Product mapping in the categories of web analytics, mobile app analytics, progressive web app (PWA) analytics, cross-platform analytics, and in-app behavioral analytics

• Examination of the annual revenues that have been reported and modeled for the software and service portfolios of app analytics.

• In 2024, the coverage of providers will account for 75-80% of the global market share.

• Derive segment-specific valuations through extrapolation using bottom-up (number of active apps × average events per app × average revenue per event by region) and top-down (platform provider revenue validation) approaches

• The integration of cloud infrastructure cost allocation factors and mobile advertising spend correlation models to enhance accuracy

Download Free Sample

Kindly complete the form below to receive a free sample of this Report

Download PDF ×

We do not share your information with anyone. However, we may send you emails based on your report interest from time to time. You may contact us at any time to opt-out.
















