• Cat-intel
  • MedIntelliX
  • Resources
  • About Us
  • Hero Background
    English
    Chinese
    French
    Japanese
    Korean
    German
    Spanish

    Armored Personnel Carrier Market Analysis

    ID: MRFR/A&D/9197-CR
    148 Pages
    Sejal Akre
    September 2021

    Armoured Personnel Carrier Market Research Report By Application (Military Operations, Civilian Protection, Peacekeeping Missions, Counter-Terrorism Operations), By Armour Type (Composite Armour, Steel Armour, Ceramic Armour, Soft Armour), By Vehicle Capacity (2-4 Personnel, 5-10 Personnel, 11-20 Personnel, 21+ Personnel), By End Use (Defense Forces, Law Enforcement Agencies, Private Security)...

    Share:
    Download PDF ×

    We do not share your information with anyone. However, we may send you emails based on your report interest from time to time. You may contact us at any time to opt-out.

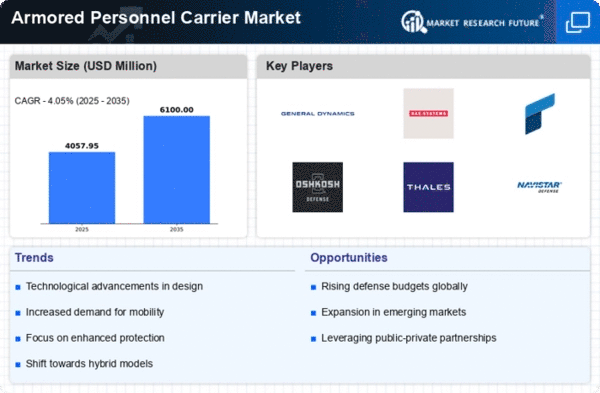
    Armored Personnel Carrier Market Infographic
    $ 4,950.0
    $ 5,950.0
    $ 7,250.0

    Market Analysis

    In-depth Analysis of Armored Personnel Carrier Market Industry Landscape

    The Armored Personnel Carrier (APC) market is influenced by many factors that make up its dynamics and trajectory trends, which are evolving and collectively shaping this market structure. Geopolitical tensions and security concerns play significant roles here. The demand for APCs is driven by what countries perceive to be threats as well as their strategic considerations; they aim at bolstering their military capacity and guarding their borders. On the other hand, defense technology advancements are defining forces of the Armored Personnel Carrier market drivers. Advanced features in this sector of defense technologies require modern APCs to meet the rising demand for these vehicles with cutting-edge characteristics. Market dynamics shift due to innovations in armor materials, communication systems, and electronic warfare capabilities, which all become vital market factors. Manufacturers strive to keep pace with technological advancement, resulting in more sophisticated and technologically advanced APCs that suit today's demanding military operations. Defense budgets and procurement strategies form another key factor influencing the Armored Personnel Carrier market. Military expenditures set by government allocations directly determine APC purchases. This can be attributed to various aspects of armed conflicts that dictate how APs should look in terms of design, making it a significant factor influencing the market factors for armored personnel carriers (APCs). Asymmetric warfare, counter-insurgencies, or the need for quick reaction force calls upon manufacturers to consider specific details when designing an APC (Armored Personnel Carrier). The market responds by emphasizing the development of flexible APCs capable of addressing different kinds of threats ranging from conventional war scenarios to counter-terrorism tasks. Therefore, adaptability to different threat environments became one of the main factors determining current trends in the market. Global partnerships and geopolitical alliances also shape the market factors of the Armored Personnel Carrier (APC) industry. The specifications and designs of APCs are influenced by joint development programs and cooperation among countries, thereby promoting interoperability between allied forces. Additionally, research and development are among the market factors that affect armed personnel carriers. This means that the quest for technological advancement always drives innovation within the industry. Market factors of Armored Personal Carriers are increasingly shaped by humanitarian concerns and ethical use of military technology as well. As civilian populations around the world become more aware of how armed conflicts affect them, there has been a rapid growth in the number of APCs with features designed to prioritize the safety of non-combatants as well as military personnel.

    Market Summary

    As per Market Research Future Analysis, the Armoured Personnel Carrier Market was valued at 10.91 USD Billion in 2022 and is projected to grow to 15.22 USD Billion by 2032, reflecting a CAGR of 3.39% from 2024 to 2032. The market is driven by increasing geopolitical tensions, military modernization, and technological advancements in vehicle design.

    Key Market Trends & Highlights

    Key trends influencing the Armoured Personnel Carrier Market include advancements in technology and rising defense budgets.

    • Military Operations segment valued at 5.05 USD Billion in 2023, highlighting its dominance in the market. Civilian Protection segment reached 2.59 USD Billion in 2023, emphasizing the importance of safety during civil unrest. North America leads the market with a valuation of 4.1 USD Billion in 2023, expected to grow to 5.5 USD Billion by 2032. Technological advancements are driving demand for lighter, more durable vehicles with enhanced capabilities.

    Market Size & Forecast

    2022 Market Size USD 10.91 Billion
    2023 Market Size USD 11.28 Billion
    2032 Market Size USD 15.22 Billion
    CAGR (2024-2032) 3.39%
    Largest Regional Market Share in 2023 North America.

    Major Players

    <p>Key players include Navistar International, General Dynamics, Krauss-Maffei Wegmann, FNSS Defense Systems, and BAE Systems.</p>

    Market Trends

    The desire for improved military capabilities and growing geopolitical tensions are the main drivers of the market for armored personnel carriers worldwide. The need for sophisticated and durable armored vehicles has grown as a result of governments all over the world investing in defense systems to safeguard their armed troops and citizens.

    Since forces need dependable mobility that can withstand harsh conditions, the need for quick military deployment in conflict areas and disaster relief efforts also affects market growth. There are many opportunities in this industry, especially in the creation of armored personnel carriers of the future that incorporate state-of-the-art technologies.

    Improved mobility solutions, stronger armor materials, and artificial intelligence enable manufacturers to produce vehicles that fulfill the demands of contemporary warfare. Partnerships between government organizations and commercial companies to promote innovation in this field are also becoming more and more possible.

    Additionally, the trend towards modernization of existing fleets opens avenues for upgrades and retrofitting services, allowing the current equipment to meet contemporary operational standards.

    Trends in recent times show a shift toward modular designs, which allow for customization based on mission requirements. An emphasis on lighter, more fuel-efficient vehicles is becoming apparent as forces seek to improve mobility without sacrificing protection.

    Additionally, there's a marked increase in hybrid and electric power options, highlighting efforts toward sustainability in defense systems. As military budgets prioritize effective, versatile solutions, the market is poised for transformative developments to adapt to the changing landscape of warfare and peacekeeping missions.

    Overall, the evolving nature of threats and the advancements in technology are setting the stage for a dynamic future in the armored personnel carrier sector.


    <p>The ongoing geopolitical tensions and the increasing emphasis on national security are driving a notable surge in the demand for advanced armored personnel carriers, reflecting a strategic shift in defense priorities across various nations.</p>

    U.S. Department of Defense

    Armored Personnel Carrier Market Market Drivers

    Increasing Defense Budgets

    The Global Armored Personnel Carrier Market Industry is experiencing growth driven by rising defense budgets across various nations. Countries are prioritizing military modernization and enhancing their defense capabilities, leading to increased procurement of armored vehicles. For instance, nations like the United States and India have allocated substantial portions of their budgets to upgrade their military fleets. In 2024, the market is projected to reach 11.6 USD Billion, reflecting the urgency for advanced armored personnel carriers that can withstand modern warfare challenges. This trend indicates a robust demand for innovative designs and technologies in the armored personnel carrier segment.

    Market Segment Insights

    Armored Personnel Carrier Market Application Insights

    <p>The Armoured Personnel Carrier Market revenue was significantly influenced by its diverse application areas, primarily comprising Military Operations, Civilian Protection, Peacekeeping Missions, and Counter-Terrorism Operations.</p>

    <p>In 2023, the Military Operations application alone held a valuation of 5.05 USD Billion, indicating its majority holding within the market, showcasing its essential role in enhancing combat readiness and troop mobility in hostile environments. This segment was crucial due to the increasing investments by governments worldwide in defense capabilities, thereby necessitating advanced armored vehicles for frontline troops.</p>

    <p>Civilian Protection, with a market valuation of 2.59 USD Billion in the same year, represents a significant portion of the market, underscoring the growing emphasis on ensuring safety during civil unrest or natural disasters. The increasing demand for these vehicles for disaster response and civil protection operations aids in reinforcing their importance in a broader societal context.</p>

    Armoured Personnel Carrier Market Armour Type Insights

    <p>Armoured Personnel Carrier Market Armour Type Insights</p>

    <p>Within this market segmentation, Armour Type plays a crucial role, delineating various materials like Composite Armour, Steel Armour, Ceramic Armour, and Soft Armour. Composite Armour is gaining traction due to its lightweight and effective protection, appealing to modern warfare's need for mobility. Steel Armour, well-known for its durability, remains significant for heavy-duty vehicles, offering robust defense against ballistic threats.</p>

    <p>Ceramic Armour has carved a niche for itself with its advanced protective features, generally used alongside other materials to enhance defense capabilities. Soft Armour, while not as formidable as its counterparts, provides crucial protection for personnel and tactical operations.</p>

    Armored Personnel Carrier Market Vehicle Capacity Insights

    <p>The Armoured Personnel Carrier Market exhibits a diverse segmentation based on vehicle capacity, which plays a crucial role in addressing varying military and peacekeeping needs. The segments of 2-4 Personnel and 5-10 Personnel are particularly significant in urban warfare scenarios, where agility and speed are essential.</p>

    <p>These categories are designed for rapid deployment in complex environments, catering to specialized units. In contrast, the 11-20 Personnel and 21+ Personnel segments dominate larger deployment strategies, often utilized for squad-based missions and troop transport during operations</p>

    <p>The ability to accommodate a higher number of soldiers enhances mission effectiveness and ensures ample support during conflict situations. The market growth is driven by rising defense budgets and the ongoing need for the modernization of military fleets, although challenges such as budget constraints and technological advancements persist.</p>

    Armoured Personnel Carrier Market End Use Insights

    <p>The Armoured Personnel Carrier Market showcases a significant valuation, with expectations for growth driven by its end-use applications in various sectors. Among these, Defense Forces remain a critical segment, primarily due to increasing military investments worldwide and rising geopolitical tensions.</p>

    <p>This investment ensures modernization and enhancement of capabilities, making the use of armored personnel carriers pivotal in operational readiness. Law Enforcement Agencies also play a vital role in this market, responding to higher security challenges stemming from urban violence and civil unrest, thereby necessitating advanced armored solutions for public safety.</p>

    <p>Furthermore, the Private Security sector has garnered attention as businesses seek to protect assets and personnel, reflecting a growing demand for versatile and secure transport options. Overall, the Armoured Personnel Carrier Market data reveals a trend of expanding capacities and customized solutions tailored for each end-use segment, contributing significantly to the market's overall growth trajectory while facing challenges such as budget constraints and procurement delays.</p>

    Get more detailed insights about Armored Personnel Carrier Market Research Report—Global Forecast till 2032

    Regional Insights

    The Armoured Personnel Carrier Market revenue showcased a diverse regional landscape, with North America leading the segment, valued at 4.1 USD Billion in 2023 and expected to reach 5.5 USD Billion by 2032, signifying its dominant position.

    Following closely was Europe, with a valuation of 3.2 USD Billion in 2023 anticipated to grow to 4.2 USD Billion, reflecting strong defense expenditures and modernization efforts. The APAC region contributed a significant portion as well, projected at 2.4 USD Billion in 2023 and expanding to 3.2 USD Billion, driven by increasing military investments among countries such as India and China.

    South America and MEA held smaller shares, valued at 0.8 USD Billion and 0.78 USD Billion in 2023, respectively, but were growing due to rising security concerns and regional conflicts.

    The market growth in these regions was largely influenced by modernization drives and strategic geopolitical interests that necessitated enhanced armored capabilities. Overall, the Armoured Personnel Carrier Market segmentation reflected varied dynamics, with North America and Europe dominating, while APAC showcases significant growth potential amid evolving defense strategies. Armoured Personnel Carrier Market ,By Regional Analysis 2023 & 2032

    Source Primary Research, Secondary Research, Market Research Future Database and Analyst Review

    Key Players and Competitive Insights

    The Armoured Personnel Carrier Market is characterized by intense competition and innovation among various manufacturers and suppliers striving to meet the evolving demands of defense forces globally. This market has seen significant advancements in technology, armor capabilities, and design, driven by the need for enhanced protection, mobility, and versatility in modern warfare.

    Various players are investing heavily in research and development to introduce next-generation armored personnel carriers that incorporate cutting-edge technology, superior tactical capabilities, and better survivability features.

    Competitive strategies include mergers and acquisitions, partnerships, and collaborations aimed at expanding product portfolios and strengthening market presence. The increasing geopolitical tensions and the necessity for improved defense capabilities are further fueling growth, with demand rising from developing nations prioritizing military modernization.

    Navistar International holds a significant position in the Armoured Personnel Carrier Market, known primarily for its robust designs and reliable performance. The company leverages its extensive experience in manufacturing and engineering to develop armored vehicles that meet stringent military requirements. With a strong focus on customer-driven innovations, Navistar International has been able to tailor its products to suit the specific needs of armed forces around the world.

    Its commitment to quality, coupled with an efficient supply chain management approach, enables the company to deliver effective solutions in a timely manner.

    The robust reputation for durability and operational reliability enhances Navistar International's competitive standing in a market that values performance under harsh conditions. Furthermore, the company continues to focus on both vehicle capability and operator safety, making it a trusted brand in the field of armored personnel carriers.

    General Dynamics is a prominent player in the Armoured Personnel Carrier Market, recognized for its advanced defense technology solutions and comprehensive service offerings. The company operates a diverse portfolio of heavily armored vehicles equipped with state-of-the-art features that meet the demanding needs of military operations.

    General Dynamics prides itself on its commitment to innovation, continually enhancing its product lines to incorporate the latest technological advancements in armor protection, firepower, and situational awareness. The company's strategic approach to research and development allows it to stay ahead of emerging trends in warfare and defense requirements, positioning it as a leader in the market.

    Additionally, General Dynamics benefits from a strong legacy in defense contracting, cultivated over decades, which bolsters its credibility and attracts long-term partnerships with military organizations worldwide. This strong market presence reflects the company's adaptability and resilience in addressing the challenges faced within the armored personnel carrier sector.

    Key Companies in the Armored Personnel Carrier Market market include

    Industry Developments

    An uptick in defense spending globally has catalyzed advancements within the Armoured Personnel Carrier Market, with companies such as BAE Systems, General Dynamics, and Rheinmetall recently unveiling new models featuring enhanced technologies like autonomous systems and improved armor capabilities.

    Navistar International and Oshkosh Corporation continue to engage in fruitful partnerships to innovate logistics and sustainment solutions. Notably, FNSS Defense Systems has expanded its footprint in Asia, signing contracts worth millions to supply armored vehicles, which reflects the increasing demand in that region.

    Mergers and acquisitions have also shaped the market, with Lockheed Martin eyeing strategic collaborations to bolster its capabilities in armored systems. Elbit Systems has recently merged with a smaller tech firm focused on defense electronics, streamlining its production processes.

    On the valuation front, the market has seen significant growth, projected to expand at a noteworthy CAGR over the coming years, bolstered by increasing geopolitical tensions and military modernization initiatives. This growth trajectory is impacting companies like Textron and Hanwha Defense as they position themselves to capitalize on emerging opportunities within diverse international markets.

    Future Outlook

    Armored Personnel Carrier Market Future Outlook

    <p>The Global Armored Personnel Carrier Market is projected to grow at a 3.4% CAGR from 2024 to 2035, driven by increasing defense budgets and modernization initiatives.</p>

    New opportunities lie in:

    • <p>Invest in advanced materials for enhanced protection and weight reduction. Develop hybrid and electric APCs to meet sustainability goals. Leverage AI for improved situational awareness and operational efficiency.</p>

    <p>By 2035, the market is expected to exhibit robust growth, reflecting evolving defense needs and technological advancements.</p>

    Market Segmentation

    Armored Personnel Carrier Market End Use Outlook

    • Defense Forces
    • Law Enforcement Agencies
    • Private Security

    Armored Personnel Carrier Market Regional Outlook

    • North America
    • Europe
    • South America
    • Asia Pacific
    • Middle East and Africa

    Armored Personnel Carrier Market Application Outlook

    • Military Operations
    • Civilian Protection
    • Peacekeeping Missions
    • Counter-Terrorism Operations

    Armored Personnel Carrier Market Armour Type Outlook

    • Composite Armour
    • Steel Armour
    • Ceramic Armour
    • Soft Armour

    Armored Personnel Carrier Market Vehicle Capacity Outlook

    • 2-4 Personnel
    • 5-10 Personnel
    • 11-20 Personnel
    • 21+ Personnel

    Report Scope

    Market Highlights

    Author

    Sejal Akre
    Senior Research Analyst

    She holds an experience of about 6+ years in market research and business consulting, working under the spectrum of information communication technology, telecommunications and semiconductor domains. aarti conceptualizes and implements a scalable business strategy and provides strategic leadership to the clients. her expertise lies in market estimation, competitive intelligence, pipeline analysis, customer assessment, etc.

    Leave a Comment

    Latest Comments

    John Doe
    john@example.com

    This is a great article! Really helped me understand the topic better.

    Posted on July 23, 2025, 10:15 AM
    Jane Smith
    jane@domain.com

    Thanks for sharing this. I’ve bookmarked it for later reference.

    Posted on July 22, 2025, 7:45 PM

    FAQs

    What is the estimated market size of the Armoured Personnel Carrier Market in 2032?

    The Armoured Personnel Carrier Market is expected to reach a valuation of 15.22 USD Billion in 2032.

    What is the expected CAGR for the Armoured Personnel Carrier Market from 2024 to 2032?

    The market is projected to grow at a CAGR of 3.39% from 2024 to 2032.

    Which region is anticipated to hold the largest market share in the Armoured Personnel Carrier Market by 2032?

    North America is expected to hold the largest market share, valued at 5.5 USD Billion in 2032.

    What applications are driving the Armoured Personnel Carrier Market?

    The market is driven by applications in military operations, civilian protection, peacekeeping missions, and counter-terrorism operations.

    What is the market size for military operations within the Armoured Personnel Carrier Market in 2032?

    The market size for military operations is expected to reach 6.82 USD Billion in 2032.

    Who are the key players in the Armoured Personnel Carrier Market?

    Key players in the market include Navistar International, General Dynamics, KraussMaffei Wegmann, FNSS Defense Systems, and BAE Systems.

    What is the projected market size for Europe in the Armoured Personnel Carrier Market by 2032?

    The market size for Europe is projected to be 4.2 USD Billion by 2032.

    What is the anticipated growth rate for the APAC region in the Armoured Personnel Carrier Market?

    The APAC region is anticipated to grow to 3.2 USD Billion by 2032.

    How much is the Counter-Terrorism Operations segment valued in 2032?

    The Counter-Terrorism Operations segment is expected to be valued at 2.13 USD Billion in 2032.

    What is the expected market size for civilian protection in the Armoured Personnel Carrier Market by 2032?

    The market for civilian protection is anticipated to reach 3.42 USD Billion by 2032.

    1. --- Table of Contents
    2. Executive Summary 
      1. Market Overview 
      2. Key Findings 
      3. Market Segmentation 
      4. Competitive Landscape 
      5. Challenges and Opportunities 
      6. Future Outlook 
    3. Market Introduction 
      1. Definition 
      2. Scope of the Study 
        1. Research Objective 
        2. Assumption 
        3. Limitations 
    4. Research Methodology 
      1. Overview 
      2. Data Mining 
      3. Secondary Research 
      4. Primary Research 
        1. Primary Interviews and Information Gathering Process 
        2. Breakdown of Primary Respondents 
      5. Forecasting Model 
      6. Market Size Estimation 
        1. Bottom-up Approach 
        2. Top-Down Approach 
      7. Data Triangulation 
      8. Validation 
    5. MARKET DYNAMICS 
      1. Overview 
      2. Drivers 
      3. Restraints 
      4. Opportunities 
    6. MARKET FACTOR ANALYSIS 
      1. Value chain Analysis 
      2. Porter's Five Forces Analysis 
        1. Bargaining Power of Suppliers 
        2. Bargaining Power of Buyers 
        3. Threat of New Entrants 
        4. Threat of Substitutes 
        5. Intensity of Rivalry 
      3. COVID-19 Impact Analysis 
        1. Market Impact Analysis 
        2. Regional Impact 
        3. Opportunity and Threat Analysis 
    7. ARMOURED PERSONNEL CARRIER MARKET, BY APPLICATION (USD BILLION) 
      1. Military Operations 
      2. Civilian Protection 
      3. Peacekeeping Missions 
      4. Counter-Terrorism Operations 
    8. ARMOURED PERSONNEL CARRIER MARKET, BY ARMOUR TYPE (USD BILLION) 
      1. Composite Armour 
      2. Steel Armour 
      3. Ceramic Armour 
      4. Soft Armour 
    9. ARMOURED PERSONNEL CARRIER MARKET, BY VEHICLE CAPACITY (USD BILLION) 
      1. 2-4 Personnel 
      2. 5-10 Personnel 
      3. 11-20 Personnel 
      4. 21+ Personnel 
    10. ARMOURED PERSONNEL CARRIER MARKET, BY END USE (USD BILLION) 
      1. Defense Forces 
      2. Law Enforcement Agencies 
      3. Private Security 
    11. ARMOURED PERSONNEL CARRIER MARKET, BY REGIONAL (USD BILLION) 
      1. North America 
        1. US 
        2. Canada 
      2. Europe 
        1. Germany 
        2. UK 
        3. France 
        4. Russia 
        5. Italy 
        6. Spain 
        7. Rest of Europe 
      3. APAC 
        1. China 
        2. India 
        3. Japan 
        4. South Korea 
        5. Malaysia 
        6. Thailand 
        7. Indonesia 
        8. Rest of APAC 
      4. South America 
        1. Brazil 
        2. Mexico 
        3. Argentina 
        4. Rest of South America 
      5. MEA 
        1. GCC Countries 
        2. South Africa 
        3. Rest of MEA 
    12. Competitive Landscape 
      1. Overview 
      2. Competitive Analysis 
      3. Market share Analysis 
      4. Major Growth Strategy in the Armoured Personnel Carrier Market 
      5. Competitive Benchmarking 
      6. Leading Players in Terms of Number of Developments in the Armoured Personnel Carrier Market 
      7. Key developments and growth strategies 
        1. New Product Launch/Service Deployment 
        2. Merger & Acquisitions 
        3. Joint Ventures 
      8. Major Players Financial Matrix 
        1. Sales and Operating Income 
        2. Major Players R&D Expenditure. 2023 
    13. COMPANY PROFILES 
      1. Navistar International 
        1. Financial Overview 
        2. Products Offered 
        3. Key Developments 
        4. SWOT Analysis 
        5. Key Strategies 
      2. General Dynamics 
        1. Financial Overview 
        2. Products Offered 
        3. Key Developments 
        4. SWOT Analysis 
        5. Key Strategies 
      3. KraussMaffei Wegmann 
        1. Financial Overview 
        2. Products Offered 
        3. Key Developments 
        4. SWOT Analysis 
        5. Key Strategies 
      4. FNSS Defense Systems 
        1. Financial Overview 
        2. Products Offered 
        3. Key Developments 
        4. SWOT Analysis 
        5. Key Strategies 
      5. Iveco 
        1. Financial Overview 
        2. Products Offered 
        3. Key Developments 
        4. SWOT Analysis 
        5. Key Strategies 
      6. BAE Systems 
        1. Financial Overview 
        2. Products Offered 
        3. Key Developments 
        4. SWOT Analysis 
        5. Key Strategies 
      7. Northrop Grumman 
        1. Financial Overview 
        2. Products Offered 
        3. Key Developments 
        4. SWOT Analysis 
        5. Key Strategies 
      8. Textron 
        1. Financial Overview 
        2. Products Offered 
        3. Key Developments 
        4. SWOT Analysis 
        5. Key Strategies 
      9. Hanwha Defense 
        1. Financial Overview 
        2. Products Offered 
        3. Key Developments 
        4. SWOT Analysis 
        5. Key Strategies 
      10. COMPOSITE NA 
        1. Financial Overview 
        2. Products Offered 
        3. Key Developments 
        4. SWOT Analysis 
        5. Key Strategies 
      11. Oshkosh Corporation 
        1. Financial Overview 
        2. Products Offered 
        3. Key Developments 
        4. SWOT Analysis 
        5. Key Strategies 
      12. Lockheed Martin 
        1. Financial Overview 
        2. Products Offered 
        3. Key Developments 
        4. SWOT Analysis 
        5. Key Strategies 
      13. Rheinmetall 
        1. Financial Overview 
        2. Products Offered 
        3. Key Developments 
        4. SWOT Analysis 
        5. Key Strategies 
      14. Elbit Systems 
        1. Financial Overview 
        2. Products Offered 
        3. Key Developments 
        4. SWOT Analysis 
        5. Key Strategies 
      15. Thales 
        1. Financial Overview 
        2. Products Offered 
        3. Key Developments 
        4. SWOT Analysis 
        5. Key Strategies 
    14. APPENDIX 
      1. References 
      2. Related Reports 
    15. List of Tables and Figures
      1. LIST OF TABLES
      2. TABLE 1. LIST OF ASSUMPTIONS 
      3. TABLE 2. NORTH AMERICA ARMOURED PERSONNEL CARRIER MARKET SIZE ESTIMATES & FORECAST, BY APPLICATION, 2019-2032 (USD BILLIONS) 
      4. TABLE 3. NORTH AMERICA ARMOURED PERSONNEL CARRIER MARKET SIZE ESTIMATES & FORECAST, BY ARMOUR TYPE, 2019-2032 (USD BILLIONS) 
      5. TABLE 4. NORTH AMERICA ARMOURED PERSONNEL CARRIER MARKET SIZE ESTIMATES & FORECAST, BY VEHICLE CAPACITY, 2019-2032 (USD BILLIONS) 
      6. TABLE 5. NORTH AMERICA ARMOURED PERSONNEL CARRIER MARKET SIZE ESTIMATES & FORECAST, BY END USE, 2019-2032 (USD BILLIONS) 
      7. TABLE 6. NORTH AMERICA ARMOURED PERSONNEL CARRIER MARKET SIZE ESTIMATES & FORECAST, BY REGIONAL, 2019-2032 (USD BILLIONS) 
      8. TABLE 7. US ARMOURED PERSONNEL CARRIER MARKET SIZE ESTIMATES & FORECAST, BY APPLICATION, 2019-2032 (USD BILLIONS) 
      9. TABLE 8. US ARMOURED PERSONNEL CARRIER MARKET SIZE ESTIMATES & FORECAST, BY ARMOUR TYPE, 2019-2032 (USD BILLIONS) 
      10. TABLE 9. US ARMOURED PERSONNEL CARRIER MARKET SIZE ESTIMATES & FORECAST, BY VEHICLE CAPACITY, 2019-2032 (USD BILLIONS) 
      11. TABLE 10. US ARMOURED PERSONNEL CARRIER MARKET SIZE ESTIMATES & FORECAST, BY END USE, 2019-2032 (USD BILLIONS) 
      12. TABLE 11. US ARMOURED PERSONNEL CARRIER MARKET SIZE ESTIMATES & FORECAST, BY REGIONAL, 2019-2032 (USD BILLIONS) 
      13. TABLE 12. CANADA ARMOURED PERSONNEL CARRIER MARKET SIZE ESTIMATES & FORECAST, BY APPLICATION, 2019-2032 (USD BILLIONS) 
      14. TABLE 13. CANADA ARMOURED PERSONNEL CARRIER MARKET SIZE ESTIMATES & FORECAST, BY ARMOUR TYPE, 2019-2032 (USD BILLIONS) 
      15. TABLE 14. CANADA ARMOURED PERSONNEL CARRIER MARKET SIZE ESTIMATES & FORECAST, BY VEHICLE CAPACITY, 2019-2032 (USD BILLIONS) 
      16. TABLE 15. CANADA ARMOURED PERSONNEL CARRIER MARKET SIZE ESTIMATES & FORECAST, BY END USE, 2019-2032 (USD BILLIONS) 
      17. TABLE 16. CANADA ARMOURED PERSONNEL CARRIER MARKET SIZE ESTIMATES & FORECAST, BY REGIONAL, 2019-2032 (USD BILLIONS) 
      18. TABLE 17. EUROPE ARMOURED PERSONNEL CARRIER MARKET SIZE ESTIMATES & FORECAST, BY APPLICATION, 2019-2032 (USD BILLIONS) 
      19. TABLE 18. EUROPE ARMOURED PERSONNEL CARRIER MARKET SIZE ESTIMATES & FORECAST, BY ARMOUR TYPE, 2019-2032 (USD BILLIONS) 
      20. TABLE 19. EUROPE ARMOURED PERSONNEL CARRIER MARKET SIZE ESTIMATES & FORECAST, BY VEHICLE CAPACITY, 2019-2032 (USD BILLIONS) 
      21. TABLE 20. EUROPE ARMOURED PERSONNEL CARRIER MARKET SIZE ESTIMATES & FORECAST, BY END USE, 2019-2032 (USD BILLIONS) 
      22. TABLE 21. EUROPE ARMOURED PERSONNEL CARRIER MARKET SIZE ESTIMATES & FORECAST, BY REGIONAL, 2019-2032 (USD BILLIONS) 
      23. TABLE 22. GERMANY ARMOURED PERSONNEL CARRIER MARKET SIZE ESTIMATES & FORECAST, BY APPLICATION, 2019-2032 (USD BILLIONS) 
      24. TABLE 23. GERMANY ARMOURED PERSONNEL CARRIER MARKET SIZE ESTIMATES & FORECAST, BY ARMOUR TYPE, 2019-2032 (USD BILLIONS) 
      25. TABLE 24. GERMANY ARMOURED PERSONNEL CARRIER MARKET SIZE ESTIMATES & FORECAST, BY VEHICLE CAPACITY, 2019-2032 (USD BILLIONS) 
      26. TABLE 25. GERMANY ARMOURED PERSONNEL CARRIER MARKET SIZE ESTIMATES & FORECAST, BY END USE, 2019-2032 (USD BILLIONS) 
      27. TABLE 26. GERMANY ARMOURED PERSONNEL CARRIER MARKET SIZE ESTIMATES & FORECAST, BY REGIONAL, 2019-2032 (USD BILLIONS) 
      28. TABLE 27. UK ARMOURED PERSONNEL CARRIER MARKET SIZE ESTIMATES & FORECAST, BY APPLICATION, 2019-2032 (USD BILLIONS) 
      29. TABLE 28. UK ARMOURED PERSONNEL CARRIER MARKET SIZE ESTIMATES & FORECAST, BY ARMOUR TYPE, 2019-2032 (USD BILLIONS) 
      30. TABLE 29. UK ARMOURED PERSONNEL CARRIER MARKET SIZE ESTIMATES & FORECAST, BY VEHICLE CAPACITY, 2019-2032 (USD BILLIONS) 
      31. TABLE 30. UK ARMOURED PERSONNEL CARRIER MARKET SIZE ESTIMATES & FORECAST, BY END USE, 2019-2032 (USD BILLIONS) 
      32. TABLE 31. UK ARMOURED PERSONNEL CARRIER MARKET SIZE ESTIMATES & FORECAST, BY REGIONAL, 2019-2032 (USD BILLIONS) 
      33. TABLE 32. FRANCE ARMOURED PERSONNEL CARRIER MARKET SIZE ESTIMATES & FORECAST, BY APPLICATION, 2019-2032 (USD BILLIONS) 
      34. TABLE 33. FRANCE ARMOURED PERSONNEL CARRIER MARKET SIZE ESTIMATES & FORECAST, BY ARMOUR TYPE, 2019-2032 (USD BILLIONS) 
      35. TABLE 34. FRANCE ARMOURED PERSONNEL CARRIER MARKET SIZE ESTIMATES & FORECAST, BY VEHICLE CAPACITY, 2019-2032 (USD BILLIONS) 
      36. TABLE 35. FRANCE ARMOURED PERSONNEL CARRIER MARKET SIZE ESTIMATES & FORECAST, BY END USE, 2019-2032 (USD BILLIONS) 
      37. TABLE 36. FRANCE ARMOURED PERSONNEL CARRIER MARKET SIZE ESTIMATES & FORECAST, BY REGIONAL, 2019-2032 (USD BILLIONS) 
      38. TABLE 37. RUSSIA ARMOURED PERSONNEL CARRIER MARKET SIZE ESTIMATES & FORECAST, BY APPLICATION, 2019-2032 (USD BILLIONS) 
      39. TABLE 38. RUSSIA ARMOURED PERSONNEL CARRIER MARKET SIZE ESTIMATES & FORECAST, BY ARMOUR TYPE, 2019-2032 (USD BILLIONS) 
      40. TABLE 39. RUSSIA ARMOURED PERSONNEL CARRIER MARKET SIZE ESTIMATES & FORECAST, BY VEHICLE CAPACITY, 2019-2032 (USD BILLIONS) 
      41. TABLE 40. RUSSIA ARMOURED PERSONNEL CARRIER MARKET SIZE ESTIMATES & FORECAST, BY END USE, 2019-2032 (USD BILLIONS) 
      42. TABLE 41. RUSSIA ARMOURED PERSONNEL CARRIER MARKET SIZE ESTIMATES & FORECAST, BY REGIONAL, 2019-2032 (USD BILLIONS) 
      43. TABLE 42. ITALY ARMOURED PERSONNEL CARRIER MARKET SIZE ESTIMATES & FORECAST, BY APPLICATION, 2019-2032 (USD BILLIONS) 
      44. TABLE 43. ITALY ARMOURED PERSONNEL CARRIER MARKET SIZE ESTIMATES & FORECAST, BY ARMOUR TYPE, 2019-2032 (USD BILLIONS) 
      45. TABLE 44. ITALY ARMOURED PERSONNEL CARRIER MARKET SIZE ESTIMATES & FORECAST, BY VEHICLE CAPACITY, 2019-2032 (USD BILLIONS) 
      46. TABLE 45. ITALY ARMOURED PERSONNEL CARRIER MARKET SIZE ESTIMATES & FORECAST, BY END USE, 2019-2032 (USD BILLIONS) 
      47. TABLE 46. ITALY ARMOURED PERSONNEL CARRIER MARKET SIZE ESTIMATES & FORECAST, BY REGIONAL, 2019-2032 (USD BILLIONS) 
      48. TABLE 47. SPAIN ARMOURED PERSONNEL CARRIER MARKET SIZE ESTIMATES & FORECAST, BY APPLICATION, 2019-2032 (USD BILLIONS) 
      49. TABLE 48. SPAIN ARMOURED PERSONNEL CARRIER MARKET SIZE ESTIMATES & FORECAST, BY ARMOUR TYPE, 2019-2032 (USD BILLIONS) 
      50. TABLE 49. SPAIN ARMOURED PERSONNEL CARRIER MARKET SIZE ESTIMATES & FORECAST, BY VEHICLE CAPACITY, 2019-2032 (USD BILLIONS) 
      51. TABLE 50. SPAIN ARMOURED PERSONNEL CARRIER MARKET SIZE ESTIMATES & FORECAST, BY END USE, 2019-2032 (USD BILLIONS) 
      52. TABLE 51. SPAIN ARMOURED PERSONNEL CARRIER MARKET SIZE ESTIMATES & FORECAST, BY REGIONAL, 2019-2032 (USD BILLIONS) 
      53. TABLE 52. REST OF EUROPE ARMOURED PERSONNEL CARRIER MARKET SIZE ESTIMATES & FORECAST, BY APPLICATION, 2019-2032 (USD BILLIONS) 
      54. TABLE 53. REST OF EUROPE ARMOURED PERSONNEL CARRIER MARKET SIZE ESTIMATES & FORECAST, BY ARMOUR TYPE, 2019-2032 (USD BILLIONS) 
      55. TABLE 54. REST OF EUROPE ARMOURED PERSONNEL CARRIER MARKET SIZE ESTIMATES & FORECAST, BY VEHICLE CAPACITY, 2019-2032 (USD BILLIONS) 
      56. TABLE 55. REST OF EUROPE ARMOURED PERSONNEL CARRIER MARKET SIZE ESTIMATES & FORECAST, BY END USE, 2019-2032 (USD BILLIONS) 
      57. TABLE 56. REST OF EUROPE ARMOURED PERSONNEL CARRIER MARKET SIZE ESTIMATES & FORECAST, BY REGIONAL, 2019-2032 (USD BILLIONS) 
      58. TABLE 57. APAC ARMOURED PERSONNEL CARRIER MARKET SIZE ESTIMATES & FORECAST, BY APPLICATION, 2019-2032 (USD BILLIONS) 
      59. TABLE 58. APAC ARMOURED PERSONNEL CARRIER MARKET SIZE ESTIMATES & FORECAST, BY ARMOUR TYPE, 2019-2032 (USD BILLIONS) 
      60. TABLE 59. APAC ARMOURED PERSONNEL CARRIER MARKET SIZE ESTIMATES & FORECAST, BY VEHICLE CAPACITY, 2019-2032 (USD BILLIONS) 
      61. TABLE 60. APAC ARMOURED PERSONNEL CARRIER MARKET SIZE ESTIMATES & FORECAST, BY END USE, 2019-2032 (USD BILLIONS) 
      62. TABLE 61. APAC ARMOURED PERSONNEL CARRIER MARKET SIZE ESTIMATES & FORECAST, BY REGIONAL, 2019-2032 (USD BILLIONS) 
      63. TABLE 62. CHINA ARMOURED PERSONNEL CARRIER MARKET SIZE ESTIMATES & FORECAST, BY APPLICATION, 2019-2032 (USD BILLIONS) 
      64. TABLE 63. CHINA ARMOURED PERSONNEL CARRIER MARKET SIZE ESTIMATES & FORECAST, BY ARMOUR TYPE, 2019-2032 (USD BILLIONS) 
      65. TABLE 64. CHINA ARMOURED PERSONNEL CARRIER MARKET SIZE ESTIMATES & FORECAST, BY VEHICLE CAPACITY, 2019-2032 (USD BILLIONS) 
      66. TABLE 65. CHINA ARMOURED PERSONNEL CARRIER MARKET SIZE ESTIMATES & FORECAST, BY END USE, 2019-2032 (USD BILLIONS) 
      67. TABLE 66. CHINA ARMOURED PERSONNEL CARRIER MARKET SIZE ESTIMATES & FORECAST, BY REGIONAL, 2019-2032 (USD BILLIONS) 
      68. TABLE 67. INDIA ARMOURED PERSONNEL CARRIER MARKET SIZE ESTIMATES & FORECAST, BY APPLICATION, 2019-2032 (USD BILLIONS) 
      69. TABLE 68. INDIA ARMOURED PERSONNEL CARRIER MARKET SIZE ESTIMATES & FORECAST, BY ARMOUR TYPE, 2019-2032 (USD BILLIONS) 
      70. TABLE 69. INDIA ARMOURED PERSONNEL CARRIER MARKET SIZE ESTIMATES & FORECAST, BY VEHICLE CAPACITY, 2019-2032 (USD BILLIONS) 
      71. TABLE 70. INDIA ARMOURED PERSONNEL CARRIER MARKET SIZE ESTIMATES & FORECAST, BY END USE, 2019-2032 (USD BILLIONS) 
      72. TABLE 71. INDIA ARMOURED PERSONNEL CARRIER MARKET SIZE ESTIMATES & FORECAST, BY REGIONAL, 2019-2032 (USD BILLIONS) 
      73. TABLE 72. JAPAN ARMOURED PERSONNEL CARRIER MARKET SIZE ESTIMATES & FORECAST, BY APPLICATION, 2019-2032 (USD BILLIONS) 
      74. TABLE 73. JAPAN ARMOURED PERSONNEL CARRIER MARKET SIZE ESTIMATES & FORECAST, BY ARMOUR TYPE, 2019-2032 (USD BILLIONS) 
      75. TABLE 74. JAPAN ARMOURED PERSONNEL CARRIER MARKET SIZE ESTIMATES & FORECAST, BY VEHICLE CAPACITY, 2019-2032 (USD BILLIONS) 
      76. TABLE 75. JAPAN ARMOURED PERSONNEL CARRIER MARKET SIZE ESTIMATES & FORECAST, BY END USE, 2019-2032 (USD BILLIONS) 
      77. TABLE 76. JAPAN ARMOURED PERSONNEL CARRIER MARKET SIZE ESTIMATES & FORECAST, BY REGIONAL, 2019-2032 (USD BILLIONS) 
      78. TABLE 77. SOUTH KOREA ARMOURED PERSONNEL CARRIER MARKET SIZE ESTIMATES & FORECAST, BY APPLICATION, 2019-2032 (USD BILLIONS) 
      79. TABLE 78. SOUTH KOREA ARMOURED PERSONNEL CARRIER MARKET SIZE ESTIMATES & FORECAST, BY ARMOUR TYPE, 2019-2032 (USD BILLIONS) 
      80. TABLE 79. SOUTH KOREA ARMOURED PERSONNEL CARRIER MARKET SIZE ESTIMATES & FORECAST, BY VEHICLE CAPACITY, 2019-2032 (USD BILLIONS) 
      81. TABLE 80. SOUTH KOREA ARMOURED PERSONNEL CARRIER MARKET SIZE ESTIMATES & FORECAST, BY END USE, 2019-2032 (USD BILLIONS) 
      82. TABLE 81. SOUTH KOREA ARMOURED PERSONNEL CARRIER MARKET SIZE ESTIMATES & FORECAST, BY REGIONAL, 2019-2032 (USD BILLIONS) 
      83. TABLE 82. MALAYSIA ARMOURED PERSONNEL CARRIER MARKET SIZE ESTIMATES & FORECAST, BY APPLICATION, 2019-2032 (USD BILLIONS) 
      84. TABLE 83. MALAYSIA ARMOURED PERSONNEL CARRIER MARKET SIZE ESTIMATES & FORECAST, BY ARMOUR TYPE, 2019-2032 (USD BILLIONS) 
      85. TABLE 84. MALAYSIA ARMOURED PERSONNEL CARRIER MARKET SIZE ESTIMATES & FORECAST, BY VEHICLE CAPACITY, 2019-2032 (USD BILLIONS) 
      86. TABLE 85. MALAYSIA ARMOURED PERSONNEL CARRIER MARKET SIZE ESTIMATES & FORECAST, BY END USE, 2019-2032 (USD BILLIONS) 
      87. TABLE 86. MALAYSIA ARMOURED PERSONNEL CARRIER MARKET SIZE ESTIMATES & FORECAST, BY REGIONAL, 2019-2032 (USD BILLIONS) 
      88. TABLE 87. THAILAND ARMOURED PERSONNEL CARRIER MARKET SIZE ESTIMATES & FORECAST, BY APPLICATION, 2019-2032 (USD BILLIONS) 
      89. TABLE 88. THAILAND ARMOURED PERSONNEL CARRIER MARKET SIZE ESTIMATES & FORECAST, BY ARMOUR TYPE, 2019-2032 (USD BILLIONS) 
      90. TABLE 89. THAILAND ARMOURED PERSONNEL CARRIER MARKET SIZE ESTIMATES & FORECAST, BY VEHICLE CAPACITY, 2019-2032 (USD BILLIONS) 
      91. TABLE 90. THAILAND ARMOURED PERSONNEL CARRIER MARKET SIZE ESTIMATES & FORECAST, BY END USE, 2019-2032 (USD BILLIONS) 
      92. TABLE 91. THAILAND ARMOURED PERSONNEL CARRIER MARKET SIZE ESTIMATES & FORECAST, BY REGIONAL, 2019-2032 (USD BILLIONS) 
      93. TABLE 92. INDONESIA ARMOURED PERSONNEL CARRIER MARKET SIZE ESTIMATES & FORECAST, BY APPLICATION, 2019-2032 (USD BILLIONS) 
      94. TABLE 93. INDONESIA ARMOURED PERSONNEL CARRIER MARKET SIZE ESTIMATES & FORECAST, BY ARMOUR TYPE, 2019-2032 (USD BILLIONS) 
      95. TABLE 94. INDONESIA ARMOURED PERSONNEL CARRIER MARKET SIZE ESTIMATES & FORECAST, BY VEHICLE CAPACITY, 2019-2032 (USD BILLIONS) 
      96. TABLE 95. INDONESIA ARMOURED PERSONNEL CARRIER MARKET SIZE ESTIMATES & FORECAST, BY END USE, 2019-2032 (USD BILLIONS) 
      97. TABLE 96. INDONESIA ARMOURED PERSONNEL CARRIER MARKET SIZE ESTIMATES & FORECAST, BY REGIONAL, 2019-2032 (USD BILLIONS) 
      98. TABLE 97. REST OF APAC ARMOURED PERSONNEL CARRIER MARKET SIZE ESTIMATES & FORECAST, BY APPLICATION, 2019-2032 (USD BILLIONS) 
      99. TABLE 98. REST OF APAC ARMOURED PERSONNEL CARRIER MARKET SIZE ESTIMATES & FORECAST, BY ARMOUR TYPE, 2019-2032 (USD BILLIONS) 
      100. TABLE 99. REST OF APAC ARMOURED PERSONNEL CARRIER MARKET SIZE ESTIMATES & FORECAST, BY VEHICLE CAPACITY, 2019-2032 (USD BILLIONS) 
      101. TABLE 100. REST OF APAC ARMOURED PERSONNEL CARRIER MARKET SIZE ESTIMATES & FORECAST, BY END USE, 2019-2032 (USD BILLIONS) 
      102. TABLE 101. REST OF APAC ARMOURED PERSONNEL CARRIER MARKET SIZE ESTIMATES & FORECAST, BY REGIONAL, 2019-2032 (USD BILLIONS) 
      103. TABLE 102. SOUTH AMERICA ARMOURED PERSONNEL CARRIER MARKET SIZE ESTIMATES & FORECAST, BY APPLICATION, 2019-2032 (USD BILLIONS) 
      104. TABLE 103. SOUTH AMERICA ARMOURED PERSONNEL CARRIER MARKET SIZE ESTIMATES & FORECAST, BY ARMOUR TYPE, 2019-2032 (USD BILLIONS) 
      105. TABLE 104. SOUTH AMERICA ARMOURED PERSONNEL CARRIER MARKET SIZE ESTIMATES & FORECAST, BY VEHICLE CAPACITY, 2019-2032 (USD BILLIONS) 
      106. TABLE 105. SOUTH AMERICA ARMOURED PERSONNEL CARRIER MARKET SIZE ESTIMATES & FORECAST, BY END USE, 2019-2032 (USD BILLIONS) 
      107. TABLE 106. SOUTH AMERICA ARMOURED PERSONNEL CARRIER MARKET SIZE ESTIMATES & FORECAST, BY REGIONAL, 2019-2032 (USD BILLIONS) 
      108. TABLE 107. BRAZIL ARMOURED PERSONNEL CARRIER MARKET SIZE ESTIMATES & FORECAST, BY APPLICATION, 2019-2032 (USD BILLIONS) 
      109. TABLE 108. BRAZIL ARMOURED PERSONNEL CARRIER MARKET SIZE ESTIMATES & FORECAST, BY ARMOUR TYPE, 2019-2032 (USD BILLIONS) 
      110. TABLE 109. BRAZIL ARMOURED PERSONNEL CARRIER MARKET SIZE ESTIMATES & FORECAST, BY VEHICLE CAPACITY, 2019-2032 (USD BILLIONS) 
      111. TABLE 110. BRAZIL ARMOURED PERSONNEL CARRIER MARKET SIZE ESTIMATES & FORECAST, BY END USE, 2019-2032 (USD BILLIONS) 
      112. TABLE 111. BRAZIL ARMOURED PERSONNEL CARRIER MARKET SIZE ESTIMATES & FORECAST, BY REGIONAL, 2019-2032 (USD BILLIONS) 
      113. TABLE 112. MEXICO ARMOURED PERSONNEL CARRIER MARKET SIZE ESTIMATES & FORECAST, BY APPLICATION, 2019-2032 (USD BILLIONS) 
      114. TABLE 113. MEXICO ARMOURED PERSONNEL CARRIER MARKET SIZE ESTIMATES & FORECAST, BY ARMOUR TYPE, 2019-2032 (USD BILLIONS) 
      115. TABLE 114. MEXICO ARMOURED PERSONNEL CARRIER MARKET SIZE ESTIMATES & FORECAST, BY VEHICLE CAPACITY, 2019-2032 (USD BILLIONS) 
      116. TABLE 115. MEXICO ARMOURED PERSONNEL CARRIER MARKET SIZE ESTIMATES & FORECAST, BY END USE, 2019-2032 (USD BILLIONS) 
      117. TABLE 116. MEXICO ARMOURED PERSONNEL CARRIER MARKET SIZE ESTIMATES & FORECAST, BY REGIONAL, 2019-2032 (USD BILLIONS) 
      118. TABLE 117. ARGENTINA ARMOURED PERSONNEL CARRIER MARKET SIZE ESTIMATES & FORECAST, BY APPLICATION, 2019-2032 (USD BILLIONS) 
      119. TABLE 118. ARGENTINA ARMOURED PERSONNEL CARRIER MARKET SIZE ESTIMATES & FORECAST, BY ARMOUR TYPE, 2019-2032 (USD BILLIONS) 
      120. TABLE 119. ARGENTINA ARMOURED PERSONNEL CARRIER MARKET SIZE ESTIMATES & FORECAST, BY VEHICLE CAPACITY, 2019-2032 (USD BILLIONS) 
      121. TABLE 120. ARGENTINA ARMOURED PERSONNEL CARRIER MARKET SIZE ESTIMATES & FORECAST, BY END USE, 2019-2032 (USD BILLIONS) 
      122. TABLE 121. ARGENTINA ARMOURED PERSONNEL CARRIER MARKET SIZE ESTIMATES & FORECAST, BY REGIONAL, 2019-2032 (USD BILLIONS) 
      123. TABLE 122. REST OF SOUTH AMERICA ARMOURED PERSONNEL CARRIER MARKET SIZE ESTIMATES & FORECAST, BY APPLICATION, 2019-2032 (USD BILLIONS) 
      124. TABLE 123. REST OF SOUTH AMERICA ARMOURED PERSONNEL CARRIER MARKET SIZE ESTIMATES & FORECAST, BY ARMOUR TYPE, 2019-2032 (USD BILLIONS) 
      125. TABLE 124. REST OF SOUTH AMERICA ARMOURED PERSONNEL CARRIER MARKET SIZE ESTIMATES & FORECAST, BY VEHICLE CAPACITY, 2019-2032 (USD BILLIONS) 
      126. TABLE 125. REST OF SOUTH AMERICA ARMOURED PERSONNEL CARRIER MARKET SIZE ESTIMATES & FORECAST, BY END USE, 2019-2032 (USD BILLIONS) 
      127. TABLE 126. REST OF SOUTH AMERICA ARMOURED PERSONNEL CARRIER MARKET SIZE ESTIMATES & FORECAST, BY REGIONAL, 2019-2032 (USD BILLIONS) 
      128. TABLE 127. MEA ARMOURED PERSONNEL CARRIER MARKET SIZE ESTIMATES & FORECAST, BY APPLICATION, 2019-2032 (USD BILLIONS) 
      129. TABLE 128. MEA ARMOURED PERSONNEL CARRIER MARKET SIZE ESTIMATES & FORECAST, BY ARMOUR TYPE, 2019-2032 (USD BILLIONS) 
      130. TABLE 129. MEA ARMOURED PERSONNEL CARRIER MARKET SIZE ESTIMATES & FORECAST, BY VEHICLE CAPACITY, 2019-2032 (USD BILLIONS) 
      131. TABLE 130. MEA ARMOURED PERSONNEL CARRIER MARKET SIZE ESTIMATES & FORECAST, BY END USE, 2019-2032 (USD BILLIONS) 
      132. TABLE 131. MEA ARMOURED PERSONNEL CARRIER MARKET SIZE ESTIMATES & FORECAST, BY REGIONAL, 2019-2032 (USD BILLIONS) 
      133. TABLE 132. GCC COUNTRIES ARMOURED PERSONNEL CARRIER MARKET SIZE ESTIMATES & FORECAST, BY APPLICATION, 2019-2032 (USD BILLIONS) 
      134. TABLE 133. GCC COUNTRIES ARMOURED PERSONNEL CARRIER MARKET SIZE ESTIMATES & FORECAST, BY ARMOUR TYPE, 2019-2032 (USD BILLIONS) 
      135. TABLE 134. GCC COUNTRIES ARMOURED PERSONNEL CARRIER MARKET SIZE ESTIMATES & FORECAST, BY VEHICLE CAPACITY, 2019-2032 (USD BILLIONS) 
      136. TABLE 135. GCC COUNTRIES ARMOURED PERSONNEL CARRIER MARKET SIZE ESTIMATES & FORECAST, BY END USE, 2019-2032 (USD BILLIONS) 
      137. TABLE 136. GCC COUNTRIES ARMOURED PERSONNEL CARRIER MARKET SIZE ESTIMATES & FORECAST, BY REGIONAL, 2019-2032 (USD BILLIONS) 
      138. TABLE 137. SOUTH AFRICA ARMOURED PERSONNEL CARRIER MARKET SIZE ESTIMATES & FORECAST, BY APPLICATION, 2019-2032 (USD BILLIONS) 
      139. TABLE 138. SOUTH AFRICA ARMOURED PERSONNEL CARRIER MARKET SIZE ESTIMATES & FORECAST, BY ARMOUR TYPE, 2019-2032 (USD BILLIONS) 
      140. TABLE 139. SOUTH AFRICA ARMOURED PERSONNEL CARRIER MARKET SIZE ESTIMATES & FORECAST, BY VEHICLE CAPACITY, 2019-2032 (USD BILLIONS) 
      141. TABLE 140. SOUTH AFRICA ARMOURED PERSONNEL CARRIER MARKET SIZE ESTIMATES & FORECAST, BY END USE, 2019-2032 (USD BILLIONS) 
      142. TABLE 141. SOUTH AFRICA ARMOURED PERSONNEL CARRIER MARKET SIZE ESTIMATES & FORECAST, BY REGIONAL, 2019-2032 (USD BILLIONS) 
      143. TABLE 142. REST OF MEA ARMOURED PERSONNEL CARRIER MARKET SIZE ESTIMATES & FORECAST, BY APPLICATION, 2019-2032 (USD BILLIONS) 
      144. TABLE 143. REST OF MEA ARMOURED PERSONNEL CARRIER MARKET SIZE ESTIMATES & FORECAST, BY ARMOUR TYPE, 2019-2032 (USD BILLIONS) 
      145. TABLE 144. REST OF MEA ARMOURED PERSONNEL CARRIER MARKET SIZE ESTIMATES & FORECAST, BY VEHICLE CAPACITY, 2019-2032 (USD BILLIONS) 
      146. TABLE 145. REST OF MEA ARMOURED PERSONNEL CARRIER MARKET SIZE ESTIMATES & FORECAST, BY END USE, 2019-2032 (USD BILLIONS) 
      147. TABLE 146. REST OF MEA ARMOURED PERSONNEL CARRIER MARKET SIZE ESTIMATES & FORECAST, BY REGIONAL, 2019-2032 (USD BILLIONS) 
      148. TABLE 147. PRODUCT LAUNCH/PRODUCT DEVELOPMENT/APPROVAL 
      149. TABLE 148. ACQUISITION/PARTNERSHIP  LIST OF FIGURES
      150. FIGURE 1. MARKET SYNOPSIS 
      151. FIGURE 2. NORTH AMERICA ARMOURED PERSONNEL CARRIER MARKET ANALYSIS 
      152. FIGURE 3. US ARMOURED PERSONNEL CARRIER MARKET ANALYSIS BY APPLICATION 
      153. FIGURE 4. US ARMOURED PERSONNEL CARRIER MARKET ANALYSIS BY ARMOUR TYPE 
      154. FIGURE 5. US ARMOURED PERSONNEL CARRIER MARKET ANALYSIS BY VEHICLE CAPACITY 
      155. FIGURE 6. US ARMOURED PERSONNEL CARRIER MARKET ANALYSIS BY END USE 
      156. FIGURE 7. US ARMOURED PERSONNEL CARRIER MARKET ANALYSIS BY REGIONAL 
      157. FIGURE 8. CANADA ARMOURED PERSONNEL CARRIER MARKET ANALYSIS BY APPLICATION 
      158. FIGURE 9. CANADA ARMOURED PERSONNEL CARRIER MARKET ANALYSIS BY ARMOUR TYPE 
      159. FIGURE 10. CANADA ARMOURED PERSONNEL CARRIER MARKET ANALYSIS BY VEHICLE CAPACITY 
      160. FIGURE 11. CANADA ARMOURED PERSONNEL CARRIER MARKET ANALYSIS BY END USE 
      161. FIGURE 12. CANADA ARMOURED PERSONNEL CARRIER MARKET ANALYSIS BY REGIONAL 
      162. FIGURE 13. EUROPE ARMOURED PERSONNEL CARRIER MARKET ANALYSIS 
      163. FIGURE 14. GERMANY ARMOURED PERSONNEL CARRIER MARKET ANALYSIS BY APPLICATION 
      164. FIGURE 15. GERMANY ARMOURED PERSONNEL CARRIER MARKET ANALYSIS BY ARMOUR TYPE 
      165. FIGURE 16. GERMANY ARMOURED PERSONNEL CARRIER MARKET ANALYSIS BY VEHICLE CAPACITY 
      166. FIGURE 17. GERMANY ARMOURED PERSONNEL CARRIER MARKET ANALYSIS BY END USE 
      167. FIGURE 18. GERMANY ARMOURED PERSONNEL CARRIER MARKET ANALYSIS BY REGIONAL 
      168. FIGURE 19. UK ARMOURED PERSONNEL CARRIER MARKET ANALYSIS BY APPLICATION 
      169. FIGURE 20. UK ARMOURED PERSONNEL CARRIER MARKET ANALYSIS BY ARMOUR TYPE 
      170. FIGURE 21. UK ARMOURED PERSONNEL CARRIER MARKET ANALYSIS BY VEHICLE CAPACITY 
      171. FIGURE 22. UK ARMOURED PERSONNEL CARRIER MARKET ANALYSIS BY END USE 
      172. FIGURE 23. UK ARMOURED PERSONNEL CARRIER MARKET ANALYSIS BY REGIONAL 
      173. FIGURE 24. FRANCE ARMOURED PERSONNEL CARRIER MARKET ANALYSIS BY APPLICATION 
      174. FIGURE 25. FRANCE ARMOURED PERSONNEL CARRIER MARKET ANALYSIS BY ARMOUR TYPE 
      175. FIGURE 26. FRANCE ARMOURED PERSONNEL CARRIER MARKET ANALYSIS BY VEHICLE CAPACITY 
      176. FIGURE 27. FRANCE ARMOURED PERSONNEL CARRIER MARKET ANALYSIS BY END USE 
      177. FIGURE 28. FRANCE ARMOURED PERSONNEL CARRIER MARKET ANALYSIS BY REGIONAL 
      178. FIGURE 29. RUSSIA ARMOURED PERSONNEL CARRIER MARKET ANALYSIS BY APPLICATION 
      179. FIGURE 30. RUSSIA ARMOURED PERSONNEL CARRIER MARKET ANALYSIS BY ARMOUR TYPE 
      180. FIGURE 31. RUSSIA ARMOURED PERSONNEL CARRIER MARKET ANALYSIS BY VEHICLE CAPACITY 
      181. FIGURE 32. RUSSIA ARMOURED PERSONNEL CARRIER MARKET ANALYSIS BY END USE 
      182. FIGURE 33. RUSSIA ARMOURED PERSONNEL CARRIER MARKET ANALYSIS BY REGIONAL 
      183. FIGURE 34. ITALY ARMOURED PERSONNEL CARRIER MARKET ANALYSIS BY APPLICATION 
      184. FIGURE 35. ITALY ARMOURED PERSONNEL CARRIER MARKET ANALYSIS BY ARMOUR TYPE 
      185. FIGURE 36. ITALY ARMOURED PERSONNEL CARRIER MARKET ANALYSIS BY VEHICLE CAPACITY 
      186. FIGURE 37. ITALY ARMOURED PERSONNEL CARRIER MARKET ANALYSIS BY END USE 
      187. FIGURE 38. ITALY ARMOURED PERSONNEL CARRIER MARKET ANALYSIS BY REGIONAL 
      188. FIGURE 39. SPAIN ARMOURED PERSONNEL CARRIER MARKET ANALYSIS BY APPLICATION 
      189. FIGURE 40. SPAIN ARMOURED PERSONNEL CARRIER MARKET ANALYSIS BY ARMOUR TYPE 
      190. FIGURE 41. SPAIN ARMOURED PERSONNEL CARRIER MARKET ANALYSIS BY VEHICLE CAPACITY 
      191. FIGURE 42. SPAIN ARMOURED PERSONNEL CARRIER MARKET ANALYSIS BY END USE 
      192. FIGURE 43. SPAIN ARMOURED PERSONNEL CARRIER MARKET ANALYSIS BY REGIONAL 
      193. FIGURE 44. REST OF EUROPE ARMOURED PERSONNEL CARRIER MARKET ANALYSIS BY APPLICATION 
      194. FIGURE 45. REST OF EUROPE ARMOURED PERSONNEL CARRIER MARKET ANALYSIS BY ARMOUR TYPE 
      195. FIGURE 46. REST OF EUROPE ARMOURED PERSONNEL CARRIER MARKET ANALYSIS BY VEHICLE CAPACITY 
      196. FIGURE 47. REST OF EUROPE ARMOURED PERSONNEL CARRIER MARKET ANALYSIS BY END USE 
      197. FIGURE 48. REST OF EUROPE ARMOURED PERSONNEL CARRIER MARKET ANALYSIS BY REGIONAL 
      198. FIGURE 49. APAC ARMOURED PERSONNEL CARRIER MARKET ANALYSIS 
      199. FIGURE 50. CHINA ARMOURED PERSONNEL CARRIER MARKET ANALYSIS BY APPLICATION 
      200. FIGURE 51. CHINA ARMOURED PERSONNEL CARRIER MARKET ANALYSIS BY ARMOUR TYPE 
      201. FIGURE 52. CHINA ARMOURED PERSONNEL CARRIER MARKET ANALYSIS BY VEHICLE CAPACITY 
      202. FIGURE 53. CHINA ARMOURED PERSONNEL CARRIER MARKET ANALYSIS BY END USE 
      203. FIGURE 54. CHINA ARMOURED PERSONNEL CARRIER MARKET ANALYSIS BY REGIONAL 
      204. FIGURE 55. INDIA ARMOURED PERSONNEL CARRIER MARKET ANALYSIS BY APPLICATION 
      205. FIGURE 56. INDIA ARMOURED PERSONNEL CARRIER MARKET ANALYSIS BY ARMOUR TYPE 
      206. FIGURE 57. INDIA ARMOURED PERSONNEL CARRIER MARKET ANALYSIS BY VEHICLE CAPACITY 
      207. FIGURE 58. INDIA ARMOURED PERSONNEL CARRIER MARKET ANALYSIS BY END USE 
      208. FIGURE 59. INDIA ARMOURED PERSONNEL CARRIER MARKET ANALYSIS BY REGIONAL 
      209. FIGURE 60. JAPAN ARMOURED PERSONNEL CARRIER MARKET ANALYSIS BY APPLICATION 
      210. FIGURE 61. JAPAN ARMOURED PERSONNEL CARRIER MARKET ANALYSIS BY ARMOUR TYPE 
      211. FIGURE 62. JAPAN ARMOURED PERSONNEL CARRIER MARKET ANALYSIS BY VEHICLE CAPACITY 
      212. FIGURE 63. JAPAN ARMOURED PERSONNEL CARRIER MARKET ANALYSIS BY END USE 
      213. FIGURE 64. JAPAN ARMOURED PERSONNEL CARRIER MARKET ANALYSIS BY REGIONAL 
      214. FIGURE 65. SOUTH KOREA ARMOURED PERSONNEL CARRIER MARKET ANALYSIS BY APPLICATION 
      215. FIGURE 66. SOUTH KOREA ARMOURED PERSONNEL CARRIER MARKET ANALYSIS BY ARMOUR TYPE 
      216. FIGURE 67. SOUTH KOREA ARMOURED PERSONNEL CARRIER MARKET ANALYSIS BY VEHICLE CAPACITY 
      217. FIGURE 68. SOUTH KOREA ARMOURED PERSONNEL CARRIER MARKET ANALYSIS BY END USE 
      218. FIGURE 69. SOUTH KOREA ARMOURED PERSONNEL CARRIER MARKET ANALYSIS BY REGIONAL 
      219. FIGURE 70. MALAYSIA ARMOURED PERSONNEL CARRIER MARKET ANALYSIS BY APPLICATION 
      220. FIGURE 71. MALAYSIA ARMOURED PERSONNEL CARRIER MARKET ANALYSIS BY ARMOUR TYPE 
      221. FIGURE 72. MALAYSIA ARMOURED PERSONNEL CARRIER MARKET ANALYSIS BY VEHICLE CAPACITY 
      222. FIGURE 73. MALAYSIA ARMOURED PERSONNEL CARRIER MARKET ANALYSIS BY END USE 
      223. FIGURE 74. MALAYSIA ARMOURED PERSONNEL CARRIER MARKET ANALYSIS BY REGIONAL 
      224. FIGURE 75. THAILAND ARMOURED PERSONNEL CARRIER MARKET ANALYSIS BY APPLICATION 
      225. FIGURE 76. THAILAND ARMOURED PERSONNEL CARRIER MARKET ANALYSIS BY ARMOUR TYPE 
      226. FIGURE 77. THAILAND ARMOURED PERSONNEL CARRIER MARKET ANALYSIS BY VEHICLE CAPACITY 
      227. FIGURE 78. THAILAND ARMOURED PERSONNEL CARRIER MARKET ANALYSIS BY END USE 
      228. FIGURE 79. THAILAND ARMOURED PERSONNEL CARRIER MARKET ANALYSIS BY REGIONAL 
      229. FIGURE 80. INDONESIA ARMOURED PERSONNEL CARRIER MARKET ANALYSIS BY APPLICATION 
      230. FIGURE 81. INDONESIA ARMOURED PERSONNEL CARRIER MARKET ANALYSIS BY ARMOUR TYPE 
      231. FIGURE 82. INDONESIA ARMOURED PERSONNEL CARRIER MARKET ANALYSIS BY VEHICLE CAPACITY 
      232. FIGURE 83. INDONESIA ARMOURED PERSONNEL CARRIER MARKET ANALYSIS BY END USE 
      233. FIGURE 84. INDONESIA ARMOURED PERSONNEL CARRIER MARKET ANALYSIS BY REGIONAL 
      234. FIGURE 85. REST OF APAC ARMOURED PERSONNEL CARRIER MARKET ANALYSIS BY APPLICATION 
      235. FIGURE 86. REST OF APAC ARMOURED PERSONNEL CARRIER MARKET ANALYSIS BY ARMOUR TYPE 
      236. FIGURE 87. REST OF APAC ARMOURED PERSONNEL CARRIER MARKET ANALYSIS BY VEHICL

    Armoured Personnel Carrier Market Segmentation


    • Armoured Personnel Carrier Market By Application (USD Billion, 2019-2032)
      • Military Operations
      • Civilian Protection
      • Peacekeeping Missions
      • Counter-Terrorism Operations


    • Armoured Personnel Carrier Market By Armour Type (USD Billion, 2019-2032)
      • Composite Armour
      • Steel Armour
      • Ceramic Armour
      • Soft Armour


    • Armoured Personnel Carrier Market By Vehicle Capacity (USD Billion, 2019-2032)
      • 2-4 Personnel
      • 5-10 Personnel
      • 11-20 Personnel
      • 21+ Personnel


    • Armoured Personnel Carrier Market By End Use (USD Billion, 2019-2032)
      • Defense Forces
      • Law Enforcement Agencies
      • Private Security


    • Armoured Personnel Carrier Market By Regional (USD Billion, 2019-2032)
      • North America
      • Europe
      • South America
      • Asia Pacific
      • Middle East and Africa


    Armoured Personnel Carrier Market Regional Outlook (USD Billion, 2019-2032)


    • North America Outlook (USD Billion, 2019-2032)
      • North America Armoured Personnel Carrier Market by Application Type
        • Military Operations
        • Civilian Protection
        • Peacekeeping Missions
        • Counter-Terrorism Operations
      • North America Armoured Personnel Carrier Market by Armour Type
        • Composite Armour
        • Steel Armour
        • Ceramic Armour
        • Soft Armour
      • North America Armoured Personnel Carrier Market by Vehicle Capacity Type
        • 2-4 Personnel
        • 5-10 Personnel
        • 11-20 Personnel
        • 21+ Personnel
      • North America Armoured Personnel Carrier Market by End Use Type
        • Defense Forces
        • Law Enforcement Agencies
        • Private Security
      • North America Armoured Personnel Carrier Market by Regional Type
        • US
        • Canada
      • US Outlook (USD Billion, 2019-2032)
      • US Armoured Personnel Carrier Market by Application Type
        • Military Operations
        • Civilian Protection
        • Peacekeeping Missions
        • Counter-Terrorism Operations
      • US Armoured Personnel Carrier Market by Armour Type
        • Composite Armour
        • Steel Armour
        • Ceramic Armour
        • Soft Armour
      • US Armoured Personnel Carrier Market by Vehicle Capacity Type
        • 2-4 Personnel
        • 5-10 Personnel
        • 11-20 Personnel
        • 21+ Personnel
      • US Armoured Personnel Carrier Market by End Use Type
        • Defense Forces
        • Law Enforcement Agencies
        • Private Security
      • CANADA Outlook (USD Billion, 2019-2032)
      • CANADA Armoured Personnel Carrier Market by Application Type
        • Military Operations
        • Civilian Protection
        • Peacekeeping Missions
        • Counter-Terrorism Operations
      • CANADA Armoured Personnel Carrier Market by Armour Type
        • Composite Armour
        • Steel Armour
        • Ceramic Armour
        • Soft Armour
      • CANADA Armoured Personnel Carrier Market by Vehicle Capacity Type
        • 2-4 Personnel
        • 5-10 Personnel
        • 11-20 Personnel
        • 21+ Personnel
      • CANADA Armoured Personnel Carrier Market by End Use Type
        • Defense Forces
        • Law Enforcement Agencies
        • Private Security
      • Europe Outlook (USD Billion, 2019-2032)
        • Europe Armoured Personnel Carrier Market by Application Type
          • Military Operations
          • Civilian Protection
          • Peacekeeping Missions
          • Counter-Terrorism Operations
        • Europe Armoured Personnel Carrier Market by Armour Type
          • Composite Armour
          • Steel Armour
          • Ceramic Armour
          • Soft Armour
        • Europe Armoured Personnel Carrier Market by Vehicle Capacity Type
          • 2-4 Personnel
          • 5-10 Personnel
          • 11-20 Personnel
          • 21+ Personnel
        • Europe Armoured Personnel Carrier Market by End Use Type
          • Defense Forces
          • Law Enforcement Agencies
          • Private Security
        • Europe Armoured Personnel Carrier Market by Regional Type
          • Germany
          • UK
          • France
          • Russia
          • Italy
          • Spain
          • Rest of Europe
        • GERMANY Outlook (USD Billion, 2019-2032)
        • GERMANY Armoured Personnel Carrier Market by Application Type
          • Military Operations
          • Civilian Protection
          • Peacekeeping Missions
          • Counter-Terrorism Operations
        • GERMANY Armoured Personnel Carrier Market by Armour Type
          • Composite Armour
          • Steel Armour
          • Ceramic Armour
          • Soft Armour
        • GERMANY Armoured Personnel Carrier Market by Vehicle Capacity Type
          • 2-4 Personnel
          • 5-10 Personnel
          • 11-20 Personnel
          • 21+ Personnel
        • GERMANY Armoured Personnel Carrier Market by End Use Type
          • Defense Forces
          • Law Enforcement Agencies
          • Private Security
        • UK Outlook (USD Billion, 2019-2032)
        • UK Armoured Personnel Carrier Market by Application Type
          • Military Operations
          • Civilian Protection
          • Peacekeeping Missions
          • Counter-Terrorism Operations
        • UK Armoured Personnel Carrier Market by Armour Type
          • Composite Armour
          • Steel Armour
          • Ceramic Armour
          • Soft Armour
        • UK Armoured Personnel Carrier Market by Vehicle Capacity Type
          • 2-4 Personnel
          • 5-10 Personnel
          • 11-20 Personnel
          • 21+ Personnel
        • UK Armoured Personnel Carrier Market by End Use Type
          • Defense Forces
          • Law Enforcement Agencies
          • Private Security
        • FRANCE Outlook (USD Billion, 2019-2032)
        • FRANCE Armoured Personnel Carrier Market by Application Type
          • Military Operations
          • Civilian Protection
          • Peacekeeping Missions
          • Counter-Terrorism Operations
        • FRANCE Armoured Personnel Carrier Market by Armour Type
          • Composite Armour
          • Steel Armour
          • Ceramic Armour
          • Soft Armour
        • FRANCE Armoured Personnel Carrier Market by Vehicle Capacity Type
          • 2-4 Personnel
          • 5-10 Personnel
          • 11-20 Personnel
          • 21+ Personnel
        • FRANCE Armoured Personnel Carrier Market by End Use Type
          • Defense Forces
          • Law Enforcement Agencies
          • Private Security
        • RUSSIA Outlook (USD Billion, 2019-2032)
        • RUSSIA Armoured Personnel Carrier Market by Application Type
          • Military Operations
          • Civilian Protection
          • Peacekeeping Missions
          • Counter-Terrorism Operations
        • RUSSIA Armoured Personnel Carrier Market by Armour Type
          • Composite Armour
          • Steel Armour
          • Ceramic Armour
          • Soft Armour
        • RUSSIA Armoured Personnel Carrier Market by Vehicle Capacity Type
          • 2-4 Personnel
          • 5-10 Personnel
          • 11-20 Personnel
          • 21+ Personnel
        • RUSSIA Armoured Personnel Carrier Market by End Use Type
          • Defense Forces
          • Law Enforcement Agencies
          • Private Security
        • ITALY Outlook (USD Billion, 2019-2032)
        • ITALY Armoured Personnel Carrier Market by Application Type
          • Military Operations
          • Civilian Protection
          • Peacekeeping Missions
          • Counter-Terrorism Operations
        • ITALY Armoured Personnel Carrier Market by Armour Type
          • Composite Armour
          • Steel Armour
          • Ceramic Armour
          • Soft Armour
        • ITALY Armoured Personnel Carrier Market by Vehicle Capacity Type
          • 2-4 Personnel
          • 5-10 Personnel
          • 11-20 Personnel
          • 21+ Personnel
        • ITALY Armoured Personnel Carrier Market by End Use Type
          • Defense Forces
          • Law Enforcement Agencies
          • Private Security
        • SPAIN Outlook (USD Billion, 2019-2032)
        • SPAIN Armoured Personnel Carrier Market by Application Type
          • Military Operations
          • Civilian Protection
          • Peacekeeping Missions
          • Counter-Terrorism Operations
        • SPAIN Armoured Personnel Carrier Market by Armour Type
          • Composite Armour
          • Steel Armour
          • Ceramic Armour
          • Soft Armour
        • SPAIN Armoured Personnel Carrier Market by Vehicle Capacity Type
          • 2-4 Personnel
          • 5-10 Personnel
          • 11-20 Personnel
          • 21+ Personnel
        • SPAIN Armoured Personnel Carrier Market by End Use Type
          • Defense Forces
          • Law Enforcement Agencies
          • Private Security
        • REST OF EUROPE Outlook (USD Billion, 2019-2032)
        • REST OF EUROPE Armoured Personnel Carrier Market by Application Type
          • Military Operations
          • Civilian Protection
          • Peacekeeping Missions
          • Counter-Terrorism Operations
        • REST OF EUROPE Armoured Personnel Carrier Market by Armour Type
          • Composite Armour
          • Steel Armour
          • Ceramic Armour
          • Soft Armour
        • REST OF EUROPE Armoured Personnel Carrier Market by Vehicle Capacity Type
          • 2-4 Personnel
          • 5-10 Personnel
          • 11-20 Personnel
          • 21+ Personnel
        • REST OF EUROPE Armoured Personnel Carrier Market by End Use Type
          • Defense Forces
          • Law Enforcement Agencies
          • Private Security
        • APAC Outlook (USD Billion, 2019-2032)
          • APAC Armoured Personnel Carrier Market by Application Type
            • Military Operations
            • Civilian Protection
            • Peacekeeping Missions
            • Counter-Terrorism Operations
          • APAC Armoured Personnel Carrier Market by Armour Type
            • Composite Armour
            • Steel Armour
            • Ceramic Armour
            • Soft Armour
          • APAC Armoured Personnel Carrier Market by Vehicle Capacity Type
            • 2-4 Personnel
            • 5-10 Personnel
            • 11-20 Personnel
            • 21+ Personnel
          • APAC Armoured Personnel Carrier Market by End Use Type
            • Defense Forces
            • Law Enforcement Agencies
            • Private Security
          • APAC Armoured Personnel Carrier Market by Regional Type
            • China
            • India
            • Japan
            • South Korea
            • Malaysia
            • Thailand
            • Indonesia
            • Rest of APAC
          • CHINA Outlook (USD Billion, 2019-2032)
          • CHINA Armoured Personnel Carrier Market by Application Type
            • Military Operations
            • Civilian Protection
            • Peacekeeping Missions
            • Counter-Terrorism Operations
          • CHINA Armoured Personnel Carrier Market by Armour Type
            • Composite Armour
            • Steel Armour
            • Ceramic Armour
            • Soft Armour
          • CHINA Armoured Personnel Carrier Market by Vehicle Capacity Type
            • 2-4 Personnel
            • 5-10 Personnel
            • 11-20 Personnel
            • 21+ Personnel
          • CHINA Armoured Personnel Carrier Market by End Use Type
            • Defense Forces
            • Law Enforcement Agencies
            • Private Security
          • INDIA Outlook (USD Billion, 2019-2032)
          • INDIA Armoured Personnel Carrier Market by Application Type
            • Military Operations
            • Civilian Protection
            • Peacekeeping Missions
            • Counter-Terrorism Operations
          • INDIA Armoured Personnel Carrier Market by Armour Type
            • Composite Armour
            • Steel Armour
            • Ceramic Armour
            • Soft Armour
          • INDIA Armoured Personnel Carrier Market by Vehicle Capacity Type
            • 2-4 Personnel
            • 5-10 Personnel
            • 11-20 Personnel
            • 21+ Personnel
          • INDIA Armoured Personnel Carrier Market by End Use Type
            • Defense Forces
            • Law Enforcement Agencies
            • Private Security
          • JAPAN Outlook (USD Billion, 2019-2032)
          • JAPAN Armoured Personnel Carrier Market by Application Type
            • Military Operations
            • Civilian Protection
            • Peacekeeping Missions
            • Counter-Terrorism Operations
          • JAPAN Armoured Personnel Carrier Market by Armour Type
            • Composite Armour
            • Steel Armour
            • Ceramic Armour
            • Soft Armour
          • JAPAN Armoured Personnel Carrier Market by Vehicle Capacity Type
            • 2-4 Personnel
            • 5-10 Personnel
            • 11-20 Personnel
            • 21+ Personnel
          • JAPAN Armoured Personnel Carrier Market by End Use Type
            • Defense Forces
            • Law Enforcement Agencies
            • Private Security
          • SOUTH KOREA Outlook (USD Billion, 2019-2032)
          • SOUTH KOREA Armoured Personnel Carrier Market by Application Type
            • Military Operations
            • Civilian Protection
            • Peacekeeping Missions
            • Counter-Terrorism Operations
          • SOUTH KOREA Armoured Personnel Carrier Market by Armour Type
            • Composite Armour
            • Steel Armour
            • Ceramic Armour
            • Soft Armour
          • SOUTH KOREA Armoured Personnel Carrier Market by Vehicle Capacity Type
            • 2-4 Personnel
            • 5-10 Personnel
            • 11-20 Personnel
            • 21+ Personnel
          • SOUTH KOREA Armoured Personnel Carrier Market by End Use Type
            • Defense Forces
            • Law Enforcement Agencies
            • Private Security
          • MALAYSIA Outlook (USD Billion, 2019-2032)
          • MALAYSIA Armoured Personnel Carrier Market by Application Type
            • Military Operations
            • Civilian Protection
            • Peacekeeping Missions
            • Counter-Terrorism Operations
          • MALAYSIA Armoured Personnel Carrier Market by Armour Type
            • Composite Armour
            • Steel Armour
            • Ceramic Armour
            • Soft Armour
          • MALAYSIA Armoured Personnel Carrier Market by Vehicle Capacity Type
            • 2-4 Personnel
            • 5-10 Personnel
            • 11-20 Personnel
            • 21+ Personnel
          • MALAYSIA Armoured Personnel Carrier Market by End Use Type
            • Defense Forces
            • Law Enforcement Agencies
            • Private Security
          • THAILAND Outlook (USD Billion, 2019-2032)
          • THAILAND Armoured Personnel Carrier Market by Application Type
            • Military Operations
            • Civilian Protection
            • Peacekeeping Missions
            • Counter-Terrorism Operations
          • THAILAND Armoured Personnel Carrier Market by Armour Type
            • Composite Armour
            • Steel Armour
            • Ceramic Armour
            • Soft Armour
          • THAILAND Armoured Personnel Carrier Market by Vehicle Capacity Type
            • 2-4 Personnel
            • 5-10 Personnel
            • 11-20 Personnel
            • 21+ Personnel
          • THAILAND Armoured Personnel Carrier Market by End Use Type
            • Defense Forces
            • Law Enforcement Agencies
            • Private Security
          • INDONESIA Outlook (USD Billion, 2019-2032)
          • INDONESIA Armoured Personnel Carrier Market by Application Type
            • Military Operations
            • Civilian Protection
            • Peacekeeping Missions
            • Counter-Terrorism Operations
          • INDONESIA Armoured Personnel Carrier Market by Armour Type
            • Composite Armour
            • Steel Armour
            • Ceramic Armour
            • Soft Armour
          • INDONESIA Armoured Personnel Carrier Market by Vehicle Capacity Type
            • 2-4 Personnel
            • 5-10 Personnel
            • 11-20 Personnel
            • 21+ Personnel
          • INDONESIA Armoured Personnel Carrier Market by End Use Type
            • Defense Forces
            • Law Enforcement Agencies
            • Private Security
          • REST OF APAC Outlook (USD Billion, 2019-2032)
          • REST OF APAC Armoured Personnel Carrier Market by Application Type
            • Military Operations
            • Civilian Protection
            • Peacekeeping Missions
            • Counter-Terrorism Operations
          • REST OF APAC Armoured Personnel Carrier Market by Armour Type
            • Composite Armour
            • Steel Armour
            • Ceramic Armour
            • Soft Armour
          • REST OF APAC Armoured Personnel Carrier Market by Vehicle Capacity Type
            • 2-4 Personnel
            • 5-10 Personnel
            • 11-20 Personnel
            • 21+ Personnel
          • REST OF APAC Armoured Personnel Carrier Market by End Use Type
            • Defense Forces
            • Law Enforcement Agencies
            • Private Security
          • South America Outlook (USD Billion, 2019-2032)
            • South America Armoured Personnel Carrier Market by Application Type
              • Military Operations
              • Civilian Protection
              • Peacekeeping Missions
              • Counter-Terrorism Operations
            • South America Armoured Personnel Carrier Market by Armour Type
              • Composite Armour
              • Steel Armour
              • Ceramic Armour
              • Soft Armour
            • South America Armoured Personnel Carrier Market by Vehicle Capacity Type
              • 2-4 Personnel
              • 5-10 Personnel
              • 11-20 Personnel
              • 21+ Personnel
            • South America Armoured Personnel Carrier Market by End Use Type
              • Defense Forces
              • Law Enforcement Agencies
              • Private Security
            • South America Armoured Personnel Carrier Market by Regional Type
              • Brazil
              • Mexico
              • Argentina
              • Rest of South America
            • BRAZIL Outlook (USD Billion, 2019-2032)
            • BRAZIL Armoured Personnel Carrier Market by Application Type
              • Military Operations
              • Civilian Protection
              • Peacekeeping Missions
              • Counter-Terrorism Operations
            • BRAZIL Armoured Personnel Carrier Market by Armour Type
              • Composite Armour
              • Steel Armour
              • Ceramic Armour
              • Soft Armour
            • BRAZIL Armoured Personnel Carrier Market by Vehicle Capacity Type
              • 2-4 Personnel
              • 5-10 Personnel
              • 11-20 Personnel
              • 21+ Personnel
            • BRAZIL Armoured Personnel Carrier Market by End Use Type
              • Defense Forces
              • Law Enforcement Agencies
              • Private Security
            • MEXICO Outlook (USD Billion, 2019-2032)
            • MEXICO Armoured Personnel Carrier Market by Application Type
              • Military Operations
              • Civilian Protection
              • Peacekeeping Missions
              • Counter-Terrorism Operations
            • MEXICO Armoured Personnel Carrier Market by Armour Type
              • Composite Armour
              • Steel Armour
              • Ceramic Armour
              • Soft Armour
            • MEXICO Armoured Personnel Carrier Market by Vehicle Capacity Type
              • 2-4 Personnel
              • 5-10 Personnel
              • 11-20 Personnel
              • 21+ Personnel
            • MEXICO Armoured Personnel Carrier Market by End Use Type
              • Defense Forces
              • Law Enforcement Agencies
              • Private Security
            • ARGENTINA Outlook (USD Billion, 2019-2032)
            • ARGENTINA Armoured Personnel Carrier Market by Application Type
              • Military Operations
              • Civilian Protection
              • Peacekeeping Missions
              • Counter-Terrorism Operations
            • ARGENTINA Armoured Personnel Carrier Market by Armour Type
              • Composite Armour
              • Steel Armour
              • Ceramic Armour
              • Soft Armour
            • ARGENTINA Armoured Personnel Carrier Market by Vehicle Capacity Type
              • 2-4 Personnel
              • 5-10 Personnel
              • 11-20 Personnel
              • 21+ Personnel
            • ARGENTINA Armoured Personnel Carrier Market by End Use Type
              • Defense Forces
              • Law Enforcement Agencies
              • Private Security
            • REST OF SOUTH AMERICA Outlook (USD Billion, 2019-2032)
            • REST OF SOUTH AMERICA Armoured Personnel Carrier Market by Application Type
              • Military Operations
              • Civilian Protection
              • Peacekeeping Missions
              • Counter-Terrorism Operations
            • REST OF SOUTH AMERICA Armoured Personnel Carrier Market by Armour Type
              • Composite Armour
              • Steel Armour
              • Ceramic Armour
              • Soft Armour
            • REST OF SOUTH AMERICA Armoured Personnel Carrier Market by Vehicle Capacity Type
              • 2-4 Personnel
              • 5-10 Personnel
              • 11-20 Personnel
              • 21+ Personnel
            • REST OF SOUTH AMERICA Armoured Personnel Carrier Market by End Use Type
              • Defense Forces
              • Law Enforcement Agencies
              • Private Security
            • MEA Outlook (USD Billion, 2019-2032)
              • MEA Armoured Personnel Carrier Market by Application Type
                • Military Operations
                • Civilian Protection
                • Peacekeeping Missions
                • Counter-Terrorism Operations
              • MEA Armoured Personnel Carrier Market by Armour Type
                • Composite Armour
                • Steel Armour
                • Ceramic Armour
                • Soft Armour
              • MEA Armoured Personnel Carrier Market by Vehicle Capacity Type
                • 2-4 Personnel
                • 5-10 Personnel
                • 11-20 Personnel
                • 21+ Personnel
              • MEA Armoured Personnel Carrier Market by End Use Type
                • Defense Forces
                • Law Enforcement Agencies
                • Private Security
              • MEA Armoured Personnel Carrier Market by Regional Type
                • GCC Countries
                • South Africa
                • Rest of MEA
              • GCC COUNTRIES Outlook (USD Billion, 2019-2032)
              • GCC COUNTRIES Armoured Personnel Carrier Market by Application Type
                • Military Operations
                • Civilian Protection
                • Peacekeeping Missions
                • Counter-Terrorism Operations
              • GCC COUNTRIES Armoured Personnel Carrier Market by Armour Type
                • Composite Armour
                • Steel Armour
                • Ceramic Armour
                • Soft Armour
              • GCC COUNTRIES Armoured Personnel Carrier Market by Vehicle Capacity Type
                • 2-4 Personnel
                • 5-10 Personnel
                • 11-20 Personnel
                • 21+ Personnel
              • GCC COUNTRIES Armoured Personnel Carrier Market by End Use Type
                • Defense Forces
                • Law Enforcement Agencies
                • Private Security
              • SOUTH AFRICA Outlook (USD Billion, 2019-2032)
              • SOUTH AFRICA Armoured Personnel Carrier Market by Application Type
                • Military Operations
                • Civilian Protection
                • Peacekeeping Missions
                • Counter-Terrorism Operations
              • SOUTH AFRICA Armoured Personnel Carrier Market by Armour Type
                • Composite Armour
                • Steel Armour
                • Ceramic Armour
                • Soft Armour
              • SOUTH AFRICA Armoured Personnel Carrier Market by Vehicle Capacity Type
                • 2-4 Personnel
                • 5-10 Personnel
                • 11-20 Personnel
                • 21+ Personnel
              • SOUTH AFRICA Armoured Personnel Carrier Market by End Use Type
                • Defense Forces
                • Law Enforcement Agencies
                • Private Security
              • REST OF MEA Outlook (USD Billion, 2019-2032)
              • REST OF MEA Armoured Personnel Carrier Market by Application Type
                • Military Operations
                • Civilian Protection
                • Peacekeeping Missions
                • Counter-Terrorism Operations
              • REST OF MEA Armoured Personnel Carrier Market by Armour Type
                • Composite Armour
                • Steel Armour
                • Ceramic Armour
                • Soft Armour
              • REST OF MEA Armoured Personnel Carrier Market by Vehicle Capacity Type
                • 2-4 Personnel
                • 5-10 Personnel
                • 11-20 Personnel
                • 21+ Personnel
              • REST OF MEA Armoured Personnel Carrier Market by End Use Type
                • Defense Forces
                • Law Enforcement Agencies
                • Private Security


    Infographic

    Free Sample Request

    Kindly complete the form below to receive a free sample of this Report

    Get Free Sample

    Customer Strories

    “I am very pleased with how market segments have been defined in a relevant way for my purposes (such as "Portable Freezers & refrigerators" and "last-mile"). In general the report is well structured. Thanks very much for your efforts.”

    Victoria Milne

    Founder
    Case Study
    Chemicals and Materials