• Cat-intel
  • MedIntelliX
  • Resources
  • About Us
  • Hero Background
    English
    Chinese
    French
    Japanese
    Korean
    German
    Spanish

    Armored Vehicles Market Size

    ID: MRFR/A&D/2347-HCR
    200 Pages
    Sejal Akre
    October 2025

    Armored Vehicle Market Research Report By Application (Military, Law Enforcement, Civil Defense, Private Security, Emergency Services), By Vehicle Type (Personnel Carriers, Main Battle Tanks, Armored Personnel Carriers, Mine-Resistant Ambush Protected Vehicles, Light Tactical Vehicles), By Mobility Type (Wheeled, Tracked, Hybrid), By Armor Type (Composite Armor, Ceramic Armor, Steel Armor, Spal...

    Share:
    Download PDF ×

    We do not share your information with anyone. However, we may send you emails based on your report interest from time to time. You may contact us at any time to opt-out.

    Armored Vehicles Market Infographic
    $ 4,950.0
    $ 5,950.0
    $ 7,250.0

    Armored Vehicles Size

    Armored Vehicles Market Growth Projections and Opportunities

    The market dynamics of the Armored Vehicle market are shaped by a multitude of factors that reflect the evolving landscape of military capabilities, geopolitical considerations, and technological advancements. One key driver is the global security environment, characterized by persistent threats, regional conflicts, and the need for military preparedness. Nations across the world invest in armored vehicles to enhance their defense capabilities, respond to potential threats, and maintain strategic readiness, driving the overall demand and market dynamics of armored vehicles. Technological advancements play a pivotal role in shaping the market dynamics of armored vehicles. The ongoing evolution of armor materials, communication systems, surveillance technologies, and mobility solutions contributes to the development of more sophisticated and capable armored vehicles. The integration of advanced technologies, such as artificial intelligence, unmanned systems, and digital communication networks, enhances the effectiveness and versatility of armored vehicles, influencing market dynamics by fostering innovation and driving competition among manufacturers. Geopolitical considerations significantly impact the market dynamics of the Armored Vehicle market. The security policies and defense strategies of nations are influenced by regional tensions, territorial disputes, and the perceived threats from potential adversaries. The geopolitical landscape drives procurement decisions, military modernization efforts, and the overall demand for armored vehicles. Heightened geopolitical tensions can lead to increased investments in armored vehicle capabilities, shaping market dynamics by creating spikes in demand and influencing the strategic priorities of defense establishments. The diverse spectrum of threats, ranging from conventional warfare to asymmetric and insurgent tactics, contributes to the demand for versatile armored vehicles. Modern armored vehicles are designed to provide protection against a wide array of threats, including ballistic and explosive attacks, mines, and improvised explosive devices (IEDs). The capability of armored vehicles to adapt to various operational environments and address diverse threats influences market dynamics by making them indispensable assets for military forces and security agencies globally. The pursuit of enhanced mobility and maneuverability is a crucial factor shaping the market dynamics of armored vehicles. Military forces seek armored platforms that can navigate diverse terrains, including urban environments, deserts, and rugged landscapes. The demand for armored vehicles with increased agility, speed, and off-road capabilities drives innovation in mobility solutions, impacting market dynamics by influencing design trends and the development of next-generation armored platforms capable of meeting the evolving operational requirements. Budget constraints and cost considerations are fundamental market dynamics influencing the procurement of armored vehicles. Governments and defense establishments seek cost-effective solutions that provide optimal performance and protection. Manufacturers that can deliver reliable, technologically advanced armored vehicles while addressing budget constraints stand to capture a significant market share. Cost-effectiveness influences market dynamics by shaping purchasing decisions and driving competition among manufacturers to offer efficient and affordable armored vehicle solutions. The trend toward modular and scalable armored vehicle designs is an emerging market dynamic. Military forces increasingly value platforms that allow for easy integration of additional features, upgrades, and mission-specific equipment. Modular designs enhance the adaptability and versatility of armored vehicles, enabling them to evolve and meet changing operational requirements over time. The demand for modular solutions influences market dynamics by fostering the development of customizable armored platforms that cater to the diverse needs of defense forces. The growing interest in unmanned and autonomous armored vehicles is reshaping the market dynamics of the industry. The integration of artificial intelligence and autonomous technologies enables the development of unmanned ground vehicles that can perform reconnaissance, surveillance, and other mission-critical tasks. The trend toward autonomous armored vehicles influences market dynamics by opening new possibilities for military operations, reducing the risk to human personnel, and driving research and development efforts in autonomous vehicle technologies.

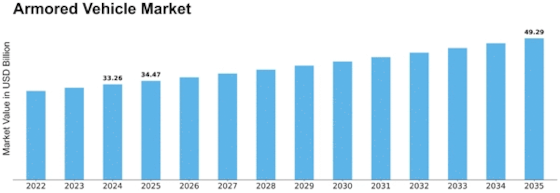
    Armored Vehicles Market Size Graph

    Market Summary

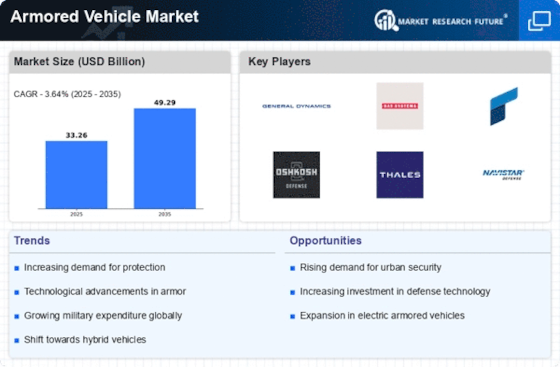
    The global armored vehicle market is projected to grow from 33.3 USD billion in 2024 to 49.3 USD billion by 2035.

    Key Market Trends & Highlights

    Armored Vehicle Key Trends and Highlights

    • The market is expected to exhibit a compound annual growth rate (CAGR) of 3.64 percent from 2025 to 2035.
    • By 2035, the market valuation is anticipated to reach 49.3 USD billion, indicating robust growth.
    • In 2024, the market is valued at 33.3 USD billion, reflecting a solid foundation for future expansion.
    • Growing adoption of advanced protection technologies due to increasing security concerns is a major market driver.

    Market Size & Forecast

    2024 Market Size 33.3 (USD Billion)
    2035 Market Size 49.3 (USD Billion)
    CAGR (2025-2035) 3.64%
    Largest Regional Market Share in 2024 latin_america)

    Major Players

    BAE Systems, Navistar Defense, Elbit Systems, Rheinmetall, Lockheed Martin, Hanwha Defense, Leonardo, General Dynamics, Saab, Oshkosh Defense, Northrop Grumman, Textron, Mitsubishi Heavy Industries, KraussMaffei Wegmann, Thales Group

    Market Trends

    Increasing military spending and shifting security threats are driving important developments in the Armored Vehicle Market. These trends are being driven by a mix of factors.

    Numerous nations are coming to the realization that they need to improve their military capabilities, and as a consequence, they are increasing their investments in armored vehicles in order to safeguard their armed troops and guarantee the safety of their nation.

    There is also a clear indication of the trend toward more modernized and advanced automobiles, which include designs that use upcoming technology like artificial intelligence and robotics, as well as designs that utilize multiple functions.

    The operational effectiveness and survivability of these vehicles are improved as a result of these developments, which makes them more desirable to military service organizations all around the world. There is a clear correlation between the growing demand for armored vehicles in emerging nations and the opportunities that are available in the global market for armored vehicles.

    In order to respond to a variety of wars and peacekeeping operations, nations that are growing their defense forces are likely to look for armored solutions that are both robust and technologically sophisticated. A number of areas are placing a greater focus on border security, which gives an opportunity for the creation of vehicles that are suitable for internal security.

    On top of that, developments in electric and hybrid technologies have opened up opportunities for manufacturers to produce environmentally friendly armored vehicles that are capable of meeting sustainability targets while yet retaining satisfactory levels of performance.

    More recently, there has been a growing emphasis placed on the formation of cooperative defense agreements and the conduct of joint military exercises among states. This collaboration encourages the development of common technologies and procurement techniques for armored vehicles, which further influences the dynamics of the global market.

    In addition, there is a growing need for armored vehicles not just for military applications but also for law enforcement and security organizations. This demand is a direct result of the growth in civil disturbance and terrorist threats.

    As a result of these considerations, the future landscape of the Armored Vehicle Market is being shaped, and the alignment of development with modern safety and operational needs is being achieved.

    The Global Armored Vehicle Market is poised for expansion as nations increasingly prioritize defense capabilities and modernization efforts in response to evolving security threats.

    U.S. Department of Defense

    Armored Vehicles Market Market Drivers

    Market Growth Projections

    The Global Armored Vehicle Market Industry is projected to experience steady growth, with estimates indicating a market size of 33.3 billion USD in 2024. The anticipated compound annual growth rate (CAGR) of 3.64% from 2025 to 2035 suggests a gradual expansion as demand for armored vehicles continues to rise. Factors such as increasing defense budgets, technological advancements, and the need for enhanced security measures are expected to drive this growth. As nations prioritize military readiness and security, the Global Armored Vehicle Market Industry appears well-positioned for sustained development in the coming years.

    Increasing Defense Budgets

    The Global Armored Vehicle Market Industry is experiencing growth driven by increasing defense budgets across various nations. Countries are prioritizing military modernization and enhancing their defense capabilities, leading to a rise in procurement of armored vehicles. For instance, nations like India and the United States have significantly increased their defense spending, with the US budget reaching approximately 877 billion USD in 2024. This trend indicates a robust demand for advanced armored vehicles, which are essential for modern warfare. As defense budgets continue to rise, the Global Armored Vehicle Market Industry is projected to expand, reflecting a commitment to national security and military readiness.

    Rising Threats and Geopolitical Tensions

    The Global Armored Vehicle Market Industry is influenced by escalating threats and geopolitical tensions worldwide. Regions experiencing conflict or instability, such as the Middle East and Eastern Europe, are witnessing increased demand for armored vehicles to ensure troop safety and operational effectiveness. The ongoing tensions in Ukraine have prompted NATO countries to bolster their military capabilities, leading to a surge in armored vehicle acquisitions. This heightened focus on defense readiness suggests that the Global Armored Vehicle Market Industry will continue to grow, as nations seek to enhance their military presence and preparedness in response to evolving threats.

    Growing Demand for Civilian Armored Vehicles

    The Global Armored Vehicle Market Industry is witnessing a notable increase in demand for civilian armored vehicles, particularly in regions with high crime rates and security concerns. Individuals and organizations are increasingly investing in armored vehicles for personal safety and asset protection. This trend is particularly pronounced in countries experiencing political instability or high levels of violence. As the market for civilian armored vehicles expands, manufacturers are responding by developing a range of options tailored to civilian needs. This shift indicates a diversification within the Global Armored Vehicle Market Industry, potentially contributing to its growth as it caters to both military and civilian sectors.

    Technological Advancements in Armored Vehicles

    Technological advancements are significantly shaping the Global Armored Vehicle Market Industry. Innovations such as enhanced armor materials, advanced weapon systems, and improved mobility are driving the development of next-generation armored vehicles. For example, the integration of artificial intelligence and autonomous systems is revolutionizing vehicle capabilities, making them more effective in combat scenarios. As militaries seek to leverage these technologies, investments in research and development are expected to rise. This trend indicates a potential increase in the market size, with projections suggesting that the Global Armored Vehicle Market Industry could reach 49.3 billion USD by 2035, reflecting the importance of technological superiority in defense.

    Urban Warfare and Counterinsurgency Operations

    The Global Armored Vehicle Market Industry is also being shaped by the increasing prevalence of urban warfare and counterinsurgency operations. As military operations shift towards urban environments, the demand for armored vehicles that can navigate complex terrains and provide protection in densely populated areas is rising. This trend is evident in various military engagements where forces require vehicles capable of both mobility and survivability. The need for specialized vehicles designed for urban combat scenarios is likely to drive growth in the market, as armed forces adapt to contemporary warfare challenges. This evolving landscape suggests a sustained demand for armored vehicles in the Global Armored Vehicle Market Industry.

    Market Segment Insights

    Armored Vehicle Market Segment Insights

    Armored Vehicle Market Segment Insights

    Armored Vehicle Market Application Insights

    Armored Vehicle Market Application Insights

    The Application segment of the Armored Vehicle Market represented a critical evaluation of diverse utilization across several critical sectors, with a significant part of the market being oriented towards military and defense applications.

    The military segment was valued at 14.0 USD Billion in 2024 and is expected to see growth to 20.0 USD Billion by 2035, thus holding a majority share in the overall market. This dominant valuation reflects the ongoing military modernization efforts in various nations where armored vehicles are crucial for battlefield operations and troop protection.

    Following closely, the Law Enforcement segment was valued at 8.0 USD Billion in 2024 and aims to reach 11.5 USD Billion by 2035. The critical role of armored vehicles in ensuring public safety and managing civil disturbances underlined its importance in law enforcement operations, especially in urban environments where threats from organized crime and terrorism are prevalent.

    In terms of Civil Defense, this segment was valued at 4.0 USD Billion in 2024 and is anticipated to grow to 5.8 USD Billion by 2035. The evident rise in natural disasters and civil unrest heightened the necessity of armored vehicles in providing safe evacuation and humanitarian assistance during crises.

    Armored Vehicle Market Vehicle Type Insights

    Armored Vehicle Market Vehicle Type Insights

    The Armored Vehicle Market has been segmented by Vehicle Type, showcasing a diverse range of applications critical for military operations and homeland security.

    Each Vehicle Type plays a vital role; Personnel Carriers prioritize the safe transport of troops, while Main Battle Tanks are designed for frontline engagement with significant firepower and protection, often dominating armored capabilities in combat scenarios.

    Armored Personnel Carriers offer robust protection and mobility for soldiers, proving essential in various operational theatres. Moreover, Mine-Resistant Ambush Protected Vehicles address the increasing threats from improvised explosive devices (IEDs), presenting a significant opportunity for defense spending as military forces adapt to modern warfare challenges.

    Light Tactical Vehicles provide flexibility and efficiency for various missions, significantly contributing to the operational versatility demanded by armed forces. Together, these categories reflect the dynamic growth and investment in the Armored Vehicle Market, as nations recognize the necessity of fortified assets to ensure security and operational readiness in complex security environments.

    Armored Vehicle Market Mobility Type Insights

    Armored Vehicle Market Mobility Type Insights

    The market, categorized by Mobility Type, features critical segments such as Wheeled, Tracked, and Hybrid vehicles. Wheeled armored vehicles are particularly important for their versatility and speed, making them valuable for rapid deployment in various military and security operations.

    Tracked vehicles, known for their superior off-road capabilities, play a significant role in heavy combat scenarios, often operating in rugged terrains where mobility is essential. Hybrid vehicles, which combine traditional fuel systems with alternative energy sources, represent an evolving trend aimed at enhancing fuel efficiency and reducing operational costs in defense operations.

    The market growth is influenced by increasing defense budgets across various nations, along with the necessity for advanced military assets in responding to complex security challenges, facilitating innovation in mobility technologies.

    Furthermore, defense modernization efforts worldwide are generating significant opportunities within the Armored Vehicle Market, leading to an ongoing transformation in how countries approach armored vehicle design and deployment.

    Armored Vehicle Market Armor Type Insights

    Armored Vehicle Market Armor Type Insights

    The Armored Vehicle Market has been categorized into various Armor Types, showcasing a diverse landscape tailored to meet protective needs in military and civilian applications. The growth in this market is propelled by advancements in technology and an increasing focus on enhancing vehicle survivability amidst evolving threats.

    Within the Armor Type segment, Composite Armor and Ceramic Armor are gaining traction due to their lightweight properties and superior ballistic performance, making them preferred choices for modern armored vehicles.

    Steel Armor continues to hold a significant share due to its effectiveness and cost-efficiency, while Spall Liners are deemed important for providing additional protection against fragmentations, enhancing the overall safety of armored systems.

    As military contracts and governmental spending on defense rise globally, driven by geopolitical tensions and the need for enhanced security measures, the Armored Vehicle Market revenue is poised for steady increase, highlighting opportunities for innovation and growth across these Armor Types.

    Get more detailed insights about Armored Vehicle Market Research Report - Global Forecast till 2035

    Regional Insights

    The Armored Vehicle Market was primarily categorized into diverse regions, showcasing significant variations in market dynamics. In 2024, North America led this segment with a valuation of 10.0 USD Billion, expected to grow to 14.5 USD Billion by 2035, driven by robust defense budgets and a necessity for advanced security solutions.

    Europe followed closely, valued at 9.0 USD Billion in 2024 and projected to reach 13.0 USD Billion in 2035, reflecting ongoing geopolitical tensions that necessitate enhanced armored capabilities. The Asia Pacific region held a similar valuation of 9.0 USD Billion in 2024 and is projected to grow to 13.0 USD Billion by 2035, supported by expansive military modernization initiatives.

    South America, while smaller, showed steady growth with a value of 2.0 USD Billion in 2024 rising to 3.0 USD Billion by 2035, underscoring increasing investments in regional defense. The Middle East and Africa, valued at 3.26 USD Billion in 2024, is anticipated to reach 5.8 USD Billion by 2035, driven by the region's need for security amidst persistent conflicts.

    Each region's market growth reflected local defense strategies and geopolitical landscapes, highlighting the Armored Vehicle Market's critical role in contemporary military readiness.

    Armored Vehicle Market Regional Insights

    Source: Primary Research, Secondary Research, Market Research Future Database and Analyst Review

    Key Players and Competitive Insights

    The Armored Vehicle Market is witnessing substantial growth driven by increasing demand for enhanced security and protection in military and homeland security operations. With various stakeholders including government bodies, defense contractors, and private sector firms operating in this space, the competitive landscape is characterized by a mix of established and emerging players.

    The market is shaped by technological advancements in vehicle manufacturing and design, necessitating continuous innovation to cater to changing defense and security needs. It is also influenced by geopolitical factors that elevate defense budgets, thereby promoting investments in armored vehicles that provide mobility and defense capabilities.

    The landscape sees companies engaging in strategic partnerships, collaborations, and mergers to enhance their competitive position, expand their product offerings, and leverage new technologies that improve performance.

    BAE Systems holds a strong position in the Armored Vehicle Market, characterized by its robust portfolio of armored vehicle solutions tailored for military applications. The company boasts a diverse range of products, including armored personnel carriers, infantry fighting vehicles, and main battle tanks, which are prominent in various defense strategies worldwide.

    Its advanced manufacturing capabilities and emphasis on research and development have enabled BAE Systems to implement innovative technologies that enhance vehicle durability, mobility, and protection. The company prides itself on strong relationships with defense ministries and armed forces, which bolster its market presence globally.

    Furthermore, BAE Systems benefits from a formidable supply chain and logistics network that ensures timely delivery and support, making it a favored choice for many nations looking to upgrade their defense capabilities while ensuring operational effectiveness.

    Navistar Defense operates successfully within the Armored Vehicle Market, focusing on designing and manufacturing wheeled armored vehicles that meet the demands of military and law enforcement agencies.

    The company’s key offerings include Mine-Resistant Ambush Protected vehicles, tactical vehicles, and armored personnel carriers, all engineered to withstand threats in diverse operational environments. Navistar Defense has established strong market presence, especially within the United States and allied defense sectors, owing to its commitment to providing tailored solutions for end-users.

    A core strength of the company is its agility in responding to evolving operational needs, coupled with an emphasis on reliability and cost-effectiveness. Additionally, Navistar Defense has engaged in strategic mergers and collaborations that have expanded its technological capabilities and market reach, allowing it to remain competitive in the rapidly evolving landscape of armored vehicle manufacturing.

    Key Companies in the Armored Vehicles Market market include

    Industry Developments

    The Armored Vehicle Market has experienced notable developments and current affairs recently. Companies such as BAE Systems, Navistar Defense, and Elbit Systems are actively participating in advancements related to armored vehicle technology.

    In September 2023, Rheinmetall announced plans to enhance its offerings through innovation in electronic warfare capabilities, which aligns with increased defense spending globally. Lockheed Martin, along with Hanwha Defense, reported a strategic partnership that aims to co-develop advanced armored systems for enhanced battlefield performance.

    The market has seen significant growth, evidenced by a projected valuation increase reflecting heightened demand for modernized armored solutions amid escalating geopolitical tensions. Notable mergers include the acquisition of Textron’s armored vehicle division by General Dynamics in July 2023, a move aimed at consolidating capabilities and boosting production efficiencies.

    In March 2022, KraussMaffei Wegmann expanded its reach by acquiring assets from Thales Group to bolster its artillery capabilities. This consolidation and collaboration among key players signal a dynamic evolution in the market, driven strongly by an emphasis on innovation and adapting to emerging threats on a global scale.

    Future Outlook

    Armored Vehicles Market Future Outlook

    The Global Armored Vehicle Market is projected to grow at a 3.64% CAGR from 2024 to 2035, driven by increasing defense budgets and rising geopolitical tensions.

    New opportunities lie in:

    • Invest in advanced materials for lightweight armored vehicles to enhance mobility.
    • Develop autonomous armored systems for improved operational efficiency.
    • Expand into emerging markets with tailored solutions for local security needs.

    By 2035, the market is expected to exhibit robust growth, reflecting evolving defense requirements and technological advancements.

    Market Segmentation

    Armored Vehicle Market Regional Outlook

    • North America
    • Europe
    • South America
    • Asia Pacific
    • Middle East and Africa

    Armored Vehicle Market Armor Type Outlook

    • Composite Armor
    • Ceramic Armor
    • Steel Armor
    • Spall Liner

    Armored Vehicle Market Application Outlook

    • Military
    • Law Enforcement
    • Civil Defense
    • Private Security
    • Emergency Services

    Armored Vehicle Market Vehicle Type Outlook

    • Personnel Carriers
    • Main Battle Tanks
    • Armored Personnel Carriers
    • Mine-Resistant Ambush Protected Vehicles
    • Light Tactical Vehicles

    Armored Vehicle Market Mobility Type Outlook

    • Wheeled
    • Tracked
    • Hybrid

    Report Scope

    Report Attribute/Metric Details
    Market Size 2023 32.09(USD Billion)
    Market Size 2024 33.26(USD Billion)
    Market Size 2035 49.3(USD Billion)
    Compound Annual Growth Rate (CAGR) 3.64% (2025 - 2035)
    Report Coverage Revenue Forecast, Competitive Landscape, Growth Factors, and Trends
    Base Year 2024
    Market Forecast Period 2025 - 2035
    Historical Data 2019 - 2024
    Market Forecast Units USD Billion
    Key Companies Profiled BAE Systems, Navistar Defense, Elbit Systems, Rheinmetall, Lockheed Martin, Hanwha Defense, Leonardo, General Dynamics, Saab, Oshkosh Defense, Northrop Grumman, Textron, Mitsubishi Heavy Industries, KraussMaffei Wegmann, Thales Group
    Segments Covered Application, Vehicle Type, Mobility Type, Armor Type, Regional
    Key Market Opportunities Increasing defense budgets, Urban warfare demands, Rising global terrorism threats, Advanced technology integration, Defense modernization programs
    Key Market Dynamics increasing defense budgets, evolving geopolitical tensions, technological advancements, demand for mobility and protection, focus on modernization programs
    Countries Covered North America, Europe, APAC, South America, MEA

    Market Highlights

    Author

    Sejal Akre
    Senior Research Analyst

    She holds an experience of about 6+ years in market research and business consulting, working under the spectrum of information communication technology, telecommunications and semiconductor domains. aarti conceptualizes and implements a scalable business strategy and provides strategic leadership to the clients. her expertise lies in market estimation, competitive intelligence, pipeline analysis, customer assessment, etc.

    Leave a Comment

    Latest Comments

    John Doe
    john@example.com

    This is a great article! Really helped me understand the topic better.

    Posted on July 23, 2025, 10:15 AM
    Jane Smith
    jane@domain.com

    Thanks for sharing this. I’ve bookmarked it for later reference.

    Posted on July 22, 2025, 7:45 PM

    FAQs

    What was the market size of the Armored Vehicle Market in 2024?

    The Armored Vehicle Market was valued at 33.26 USD Billion in 2024.

    What is the projected market size of the Armored Vehicle Market by 2035?

    By 2035, the Armored Vehicle Market is expected to reach a value of 49.3 USD Billion.

    What is the expected CAGR for the Armored Vehicle Market from 2025 to 2035?

    The expected CAGR for the Armored Vehicle Market from 2025 to 2035 is 3.64%.

    Which application segment is expected to dominate the Armored Vehicle Market by 2035?

    The Military application segment is projected to dominate with a value of 20.0 USD Billion by 2035.

    What was the market size of the Law Enforcement application segment in 2024?

    The Law Enforcement application segment was valued at 8.0 USD Billion in 2024.

    What was the market size for the Asia Pacific region in 2024?

    The Asia Pacific region was valued at 9.0 USD Billion in 2024.

    How much is the North American market for armored vehicles expected to grow by 2035?

    The North American market is projected to grow to 14.5 USD Billion by 2035.

    Which key players are prominent in the Armored Vehicle Market?

    Major players include BAE Systems, Navistar Defense, Elbit Systems, and Rheinmetall, among others.

    What is the growth outlook for the Middle East and Africa region by 2035?

    The Middle East and Africa region is expected to grow to 5.8 USD Billion by 2035.

    What is the expected value for the Private Security application segment by 2035?

    The Private Security application segment is expected to be valued at 6.5 USD Billion by 2035.

    1. Table of Contents
    2. Executive Summary
      1. Market Overview
      2. Key Findings
      3. Market Segmentation
      4. Competitive Landscape
      5. Challenges and Opportunities
      6. Future Outlook
    3. Market Introduction
      1. Definition
      2. Scope of the Study
        1. Research Objective
        2. Assumption
        3. Limitations
    4. Research Methodology
      1. Overview
      2. Data Mining
      3. Secondary Research
      4. Primary Research
        1. Primary Interviews and Information Gathering Process
        2. Breakdown of Primary Respondents
      5. Forecasting Model
      6. Market Size Estimation
        1. Bottom-up Approach
        2. Top-Down Approach
      7. Data Triangulation
      8. Validation
    5. MARKET DYNAMICS
      1. Overview
      2. Drivers
      3. Restraints
      4. Opportunities
    6. MARKET FACTOR ANALYSIS
      1. Value chain Analysis
      2. Porter's Five Forces Analysis
        1. Bargaining Power of Suppliers
        2. Bargaining Power of Buyers
        3. Threat of New Entrants
        4. Threat of Substitutes
        5. Intensity of Rivalry
      3. COVID-19 Impact Analysis
        1. Market Impact Analysis
        2. Regional Impact
        3. Opportunity and Threat Analysis
    7. ARMORED VEHICLE MARKET, BY APPLICATION (USD BILLION)
      1. Military
      2. Law Enforcement
      3. Civil Defense
      4. Private Security
      5. Emergency Services
    8. ARMORED VEHICLE MARKET, BY VEHICLE TYPE (USD BILLION)
      1. Personnel Carriers
      2. Main Battle Tanks
      3. Armored Personnel Carriers
      4. Mine-Resistant Ambush Protected Vehicles
      5. Light Tactical Vehicles
    9. ARMORED VEHICLE MARKET, BY MOBILITY TYPE (USD BILLION)
      1. Wheeled
      2. Tracked
      3. Hybrid
    10. ARMORED VEHICLE MARKET, BY ARMOR TYPE (USD BILLION)
      1. Composite Armor
      2. Ceramic Armor
      3. Steel Armor
      4. Spall Liner
    11. ARMORED VEHICLE MARKET, BY REGIONAL (USD BILLION)
      1. North America
        1. US
        2. Canada
      2. Europe
        1. Germany
        2. UK
        3. France
        4. Russia
        5. Italy
        6. Spain
        7. Rest of Europe
      3. APAC
        1. China
        2. India
        3. Japan
        4. South Korea
        5. Malaysia
        6. Thailand
        7. Indonesia
        8. Rest of APAC
      4. South America
        1. Brazil
        2. Mexico
        3. Argentina
        4. Rest of South America
      5. MEA
        1. GCC Countries
        2. South Africa
        3. Rest of MEA
    12. Competitive Landscape
      1. Overview
      2. Competitive Analysis
      3. Market share Analysis
      4. Major Growth Strategy in the Armored Vehicle Market
      5. Competitive Benchmarking
      6. Leading Players in Terms of Number of Developments in the Armored Vehicle Market
      7. Key developments and growth strategies
        1. New Product Launch/Service Deployment
        2. Merger & Acquisitions
        3. Joint Ventures
      8. Major Players Financial Matrix
        1. Sales and Operating Income
        2. Major Players R&D Expenditure. 2023
    13. COMPANY PROFILES
      1. BAE Systems
        1. Financial Overview
        2. Products Offered
        3. Key Developments
        4. SWOT Analysis
        5. Key Strategies
      2. Navistar Defense
        1. Financial Overview
        2. Products Offered
        3. Key Developments
        4. SWOT Analysis
        5. Key Strategies
      3. Elbit Systems
        1. Financial Overview
        2. Products Offered
        3. Key Developments
        4. SWOT Analysis
        5. Key Strategies
      4. Rheinmetall
        1. Financial Overview
        2. Products Offered
        3. Key Developments
        4. SWOT Analysis
        5. Key Strategies
      5. Lockheed Martin
        1. Financial Overview
        2. Products Offered
        3. Key Developments
        4. SWOT Analysis
        5. Key Strategies
      6. Hanwha Defense
        1. Financial Overview
        2. Products Offered
        3. Key Developments
        4. SWOT Analysis
        5. Key Strategies
      7. Leonardo
        1. Financial Overview
        2. Products Offered
        3. Key Developments
        4. SWOT Analysis
        5. Key Strategies
      8. General Dynamics
        1. Financial Overview
        2. Products Offered
        3. Key Developments
        4. SWOT Analysis
        5. Key Strategies
      9. Saab
        1. Financial Overview
        2. Products Offered
        3. Key Developments
        4. SWOT Analysis
        5. Key Strategies
      10. Oshkosh Defense
        1. Financial Overview
        2. Products Offered
        3. Key Developments
        4. SWOT Analysis
        5. Key Strategies
      11. Northrop Grumman
        1. Financial Overview
        2. Products Offered
        3. Key Developments
        4. SWOT Analysis
        5. Key Strategies
      12. Textron
        1. Financial Overview
        2. Products Offered
        3. Key Developments
        4. SWOT Analysis
        5. Key Strategies
      13. Mitsubishi Heavy Industries
        1. Financial Overview
        2. Products Offered
        3. Key Developments
        4. SWOT Analysis
        5. Key Strategies
      14. KraussMaffei Wegmann
        1. Financial Overview
        2. Products Offered
        3. Key Developments
        4. SWOT Analysis
        5. Key Strategies
      15. Thales Group
        1. Financial Overview
        2. Products Offered
        3. Key Developments
        4. SWOT Analysis
        5. Key Strategies
    14. APPENDIX
      1. References
      2. Related Reports
    15. List of Tables and Figures
      1. LIST OF TABLES
      2. TABLE 1. LIST OF ASSUMPTIONS
      3. TABLE 2. NORTH AMERICA ARMORED VEHICLE MARKET SIZE ESTIMATES & FORECAST, BY APPLICATION, 2019-2035 (USD BILLIONS)
      4. TABLE 3. NORTH AMERICA ARMORED VEHICLE MARKET SIZE ESTIMATES & FORECAST, BY VEHICLE TYPE, 2019-2035 (USD BILLIONS)
      5. TABLE 4. NORTH AMERICA ARMORED VEHICLE MARKET SIZE ESTIMATES & FORECAST, BY MOBILITY TYPE, 2019-2035 (USD BILLIONS)
      6. TABLE 5. NORTH AMERICA ARMORED VEHICLE MARKET SIZE ESTIMATES & FORECAST, BY ARMOR TYPE, 2019-2035 (USD BILLIONS)
      7. TABLE 6. NORTH AMERICA ARMORED VEHICLE MARKET SIZE ESTIMATES & FORECAST, BY REGIONAL, 2019-2035 (USD BILLIONS)
      8. TABLE 7. US ARMORED VEHICLE MARKET SIZE ESTIMATES & FORECAST, BY APPLICATION, 2019-2035 (USD BILLIONS)
      9. TABLE 8. US ARMORED VEHICLE MARKET SIZE ESTIMATES & FORECAST, BY VEHICLE TYPE, 2019-2035 (USD BILLIONS)
      10. TABLE 9. US ARMORED VEHICLE MARKET SIZE ESTIMATES & FORECAST, BY MOBILITY TYPE, 2019-2035 (USD BILLIONS)
      11. TABLE 10. US ARMORED VEHICLE MARKET SIZE ESTIMATES & FORECAST, BY ARMOR TYPE, 2019-2035 (USD BILLIONS)
      12. TABLE 11. US ARMORED VEHICLE MARKET SIZE ESTIMATES & FORECAST, BY REGIONAL, 2019-2035 (USD BILLIONS)
      13. TABLE 12. CANADA ARMORED VEHICLE MARKET SIZE ESTIMATES & FORECAST, BY APPLICATION, 2019-2035 (USD BILLIONS)
      14. TABLE 13. CANADA ARMORED VEHICLE MARKET SIZE ESTIMATES & FORECAST, BY VEHICLE TYPE, 2019-2035 (USD BILLIONS)
      15. TABLE 14. CANADA ARMORED VEHICLE MARKET SIZE ESTIMATES & FORECAST, BY MOBILITY TYPE, 2019-2035 (USD BILLIONS)
      16. TABLE 15. CANADA ARMORED VEHICLE MARKET SIZE ESTIMATES & FORECAST, BY ARMOR TYPE, 2019-2035 (USD BILLIONS)
      17. TABLE 16. CANADA ARMORED VEHICLE MARKET SIZE ESTIMATES & FORECAST, BY REGIONAL, 2019-2035 (USD BILLIONS)
      18. TABLE 17. EUROPE ARMORED VEHICLE MARKET SIZE ESTIMATES & FORECAST, BY APPLICATION, 2019-2035 (USD BILLIONS)
      19. TABLE 18. EUROPE ARMORED VEHICLE MARKET SIZE ESTIMATES & FORECAST, BY VEHICLE TYPE, 2019-2035 (USD BILLIONS)
      20. TABLE 19. EUROPE ARMORED VEHICLE MARKET SIZE ESTIMATES & FORECAST, BY MOBILITY TYPE, 2019-2035 (USD BILLIONS)
      21. TABLE 20. EUROPE ARMORED VEHICLE MARKET SIZE ESTIMATES & FORECAST, BY ARMOR TYPE, 2019-2035 (USD BILLIONS)
      22. TABLE 21. EUROPE ARMORED VEHICLE MARKET SIZE ESTIMATES & FORECAST, BY REGIONAL, 2019-2035 (USD BILLIONS)
      23. TABLE 22. GERMANY ARMORED VEHICLE MARKET SIZE ESTIMATES & FORECAST, BY APPLICATION, 2019-2035 (USD BILLIONS)
      24. TABLE 23. GERMANY ARMORED VEHICLE MARKET SIZE ESTIMATES & FORECAST, BY VEHICLE TYPE, 2019-2035 (USD BILLIONS)
      25. TABLE 24. GERMANY ARMORED VEHICLE MARKET SIZE ESTIMATES & FORECAST, BY MOBILITY TYPE, 2019-2035 (USD BILLIONS)
      26. TABLE 25. GERMANY ARMORED VEHICLE MARKET SIZE ESTIMATES & FORECAST, BY ARMOR TYPE, 2019-2035 (USD BILLIONS)
      27. TABLE 26. GERMANY ARMORED VEHICLE MARKET SIZE ESTIMATES & FORECAST, BY REGIONAL, 2019-2035 (USD BILLIONS)
      28. TABLE 27. UK ARMORED VEHICLE MARKET SIZE ESTIMATES & FORECAST, BY APPLICATION, 2019-2035 (USD BILLIONS)
      29. TABLE 28. UK ARMORED VEHICLE MARKET SIZE ESTIMATES & FORECAST, BY VEHICLE TYPE, 2019-2035 (USD BILLIONS)
      30. TABLE 29. UK ARMORED VEHICLE MARKET SIZE ESTIMATES & FORECAST, BY MOBILITY TYPE, 2019-2035 (USD BILLIONS)
      31. TABLE 30. UK ARMORED VEHICLE MARKET SIZE ESTIMATES & FORECAST, BY ARMOR TYPE, 2019-2035 (USD BILLIONS)
      32. TABLE 31. UK ARMORED VEHICLE MARKET SIZE ESTIMATES & FORECAST, BY REGIONAL, 2019-2035 (USD BILLIONS)
      33. TABLE 32. FRANCE ARMORED VEHICLE MARKET SIZE ESTIMATES & FORECAST, BY APPLICATION, 2019-2035 (USD BILLIONS)
      34. TABLE 33. FRANCE ARMORED VEHICLE MARKET SIZE ESTIMATES & FORECAST, BY VEHICLE TYPE, 2019-2035 (USD BILLIONS)
      35. TABLE 34. FRANCE ARMORED VEHICLE MARKET SIZE ESTIMATES & FORECAST, BY MOBILITY TYPE, 2019-2035 (USD BILLIONS)
      36. TABLE 35. FRANCE ARMORED VEHICLE MARKET SIZE ESTIMATES & FORECAST, BY ARMOR TYPE, 2019-2035 (USD BILLIONS)
      37. TABLE 36. FRANCE ARMORED VEHICLE MARKET SIZE ESTIMATES & FORECAST, BY REGIONAL, 2019-2035 (USD BILLIONS)
      38. TABLE 37. RUSSIA ARMORED VEHICLE MARKET SIZE ESTIMATES & FORECAST, BY APPLICATION, 2019-2035 (USD BILLIONS)
      39. TABLE 38. RUSSIA ARMORED VEHICLE MARKET SIZE ESTIMATES & FORECAST, BY VEHICLE TYPE, 2019-2035 (USD BILLIONS)
      40. TABLE 39. RUSSIA ARMORED VEHICLE MARKET SIZE ESTIMATES & FORECAST, BY MOBILITY TYPE, 2019-2035 (USD BILLIONS)
      41. TABLE 40. RUSSIA ARMORED VEHICLE MARKET SIZE ESTIMATES & FORECAST, BY ARMOR TYPE, 2019-2035 (USD BILLIONS)
      42. TABLE 41. RUSSIA ARMORED VEHICLE MARKET SIZE ESTIMATES & FORECAST, BY REGIONAL, 2019-2035 (USD BILLIONS)
      43. TABLE 42. ITALY ARMORED VEHICLE MARKET SIZE ESTIMATES & FORECAST, BY APPLICATION, 2019-2035 (USD BILLIONS)
      44. TABLE 43. ITALY ARMORED VEHICLE MARKET SIZE ESTIMATES & FORECAST, BY VEHICLE TYPE, 2019-2035 (USD BILLIONS)
      45. TABLE 44. ITALY ARMORED VEHICLE MARKET SIZE ESTIMATES & FORECAST, BY MOBILITY TYPE, 2019-2035 (USD BILLIONS)
      46. TABLE 45. ITALY ARMORED VEHICLE MARKET SIZE ESTIMATES & FORECAST, BY ARMOR TYPE, 2019-2035 (USD BILLIONS)
      47. TABLE 46. ITALY ARMORED VEHICLE MARKET SIZE ESTIMATES & FORECAST, BY REGIONAL, 2019-2035 (USD BILLIONS)
      48. TABLE 47. SPAIN ARMORED VEHICLE MARKET SIZE ESTIMATES & FORECAST, BY APPLICATION, 2019-2035 (USD BILLIONS)
      49. TABLE 48. SPAIN ARMORED VEHICLE MARKET SIZE ESTIMATES & FORECAST, BY VEHICLE TYPE, 2019-2035 (USD BILLIONS)
      50. TABLE 49. SPAIN ARMORED VEHICLE MARKET SIZE ESTIMATES & FORECAST, BY MOBILITY TYPE, 2019-2035 (USD BILLIONS)
      51. TABLE 50. SPAIN ARMORED VEHICLE MARKET SIZE ESTIMATES & FORECAST, BY ARMOR TYPE, 2019-2035 (USD BILLIONS)
      52. TABLE 51. SPAIN ARMORED VEHICLE MARKET SIZE ESTIMATES & FORECAST, BY REGIONAL, 2019-2035 (USD BILLIONS)
      53. TABLE 52. REST OF EUROPE ARMORED VEHICLE MARKET SIZE ESTIMATES & FORECAST, BY APPLICATION, 2019-2035 (USD BILLIONS)
      54. TABLE 53. REST OF EUROPE ARMORED VEHICLE MARKET SIZE ESTIMATES & FORECAST, BY VEHICLE TYPE, 2019-2035 (USD BILLIONS)
      55. TABLE 54. REST OF EUROPE ARMORED VEHICLE MARKET SIZE ESTIMATES & FORECAST, BY MOBILITY TYPE, 2019-2035 (USD BILLIONS)
      56. TABLE 55. REST OF EUROPE ARMORED VEHICLE MARKET SIZE ESTIMATES & FORECAST, BY ARMOR TYPE, 2019-2035 (USD BILLIONS)
      57. TABLE 56. REST OF EUROPE ARMORED VEHICLE MARKET SIZE ESTIMATES & FORECAST, BY REGIONAL, 2019-2035 (USD BILLIONS)
      58. TABLE 57. APAC ARMORED VEHICLE MARKET SIZE ESTIMATES & FORECAST, BY APPLICATION, 2019-2035 (USD BILLIONS)
      59. TABLE 58. APAC ARMORED VEHICLE MARKET SIZE ESTIMATES & FORECAST, BY VEHICLE TYPE, 2019-2035 (USD BILLIONS)
      60. TABLE 59. APAC ARMORED VEHICLE MARKET SIZE ESTIMATES & FORECAST, BY MOBILITY TYPE, 2019-2035 (USD BILLIONS)
      61. TABLE 60. APAC ARMORED VEHICLE MARKET SIZE ESTIMATES & FORECAST, BY ARMOR TYPE, 2019-2035 (USD BILLIONS)
      62. TABLE 61. APAC ARMORED VEHICLE MARKET SIZE ESTIMATES & FORECAST, BY REGIONAL, 2019-2035 (USD BILLIONS)
      63. TABLE 62. CHINA ARMORED VEHICLE MARKET SIZE ESTIMATES & FORECAST, BY APPLICATION, 2019-2035 (USD BILLIONS)
      64. TABLE 63. CHINA ARMORED VEHICLE MARKET SIZE ESTIMATES & FORECAST, BY VEHICLE TYPE, 2019-2035 (USD BILLIONS)
      65. TABLE 64. CHINA ARMORED VEHICLE MARKET SIZE ESTIMATES & FORECAST, BY MOBILITY TYPE, 2019-2035 (USD BILLIONS)
      66. TABLE 65. CHINA ARMORED VEHICLE MARKET SIZE ESTIMATES & FORECAST, BY ARMOR TYPE, 2019-2035 (USD BILLIONS)
      67. TABLE 66. CHINA ARMORED VEHICLE MARKET SIZE ESTIMATES & FORECAST, BY REGIONAL, 2019-2035 (USD BILLIONS)
      68. TABLE 67. INDIA ARMORED VEHICLE MARKET SIZE ESTIMATES & FORECAST, BY APPLICATION, 2019-2035 (USD BILLIONS)
      69. TABLE 68. INDIA ARMORED VEHICLE MARKET SIZE ESTIMATES & FORECAST, BY VEHICLE TYPE, 2019-2035 (USD BILLIONS)
      70. TABLE 69. INDIA ARMORED VEHICLE MARKET SIZE ESTIMATES & FORECAST, BY MOBILITY TYPE, 2019-2035 (USD BILLIONS)
      71. TABLE 70. INDIA ARMORED VEHICLE MARKET SIZE ESTIMATES & FORECAST, BY ARMOR TYPE, 2019-2035 (USD BILLIONS)
      72. TABLE 71. INDIA ARMORED VEHICLE MARKET SIZE ESTIMATES & FORECAST, BY REGIONAL, 2019-2035 (USD BILLIONS)
      73. TABLE 72. JAPAN ARMORED VEHICLE MARKET SIZE ESTIMATES & FORECAST, BY APPLICATION, 2019-2035 (USD BILLIONS)
      74. TABLE 73. JAPAN ARMORED VEHICLE MARKET SIZE ESTIMATES & FORECAST, BY VEHICLE TYPE, 2019-2035 (USD BILLIONS)
      75. TABLE 74. JAPAN ARMORED VEHICLE MARKET SIZE ESTIMATES & FORECAST, BY MOBILITY TYPE, 2019-2035 (USD BILLIONS)
      76. TABLE 75. JAPAN ARMORED VEHICLE MARKET SIZE ESTIMATES & FORECAST, BY ARMOR TYPE, 2019-2035 (USD BILLIONS)
      77. TABLE 76. JAPAN ARMORED VEHICLE MARKET SIZE ESTIMATES & FORECAST, BY REGIONAL, 2019-2035 (USD BILLIONS)
      78. TABLE 77. SOUTH KOREA ARMORED VEHICLE MARKET SIZE ESTIMATES & FORECAST, BY APPLICATION, 2019-2035 (USD BILLIONS)
      79. TABLE 78. SOUTH KOREA ARMORED VEHICLE MARKET SIZE ESTIMATES & FORECAST, BY VEHICLE TYPE, 2019-2035 (USD BILLIONS)
      80. TABLE 79. SOUTH KOREA ARMORED VEHICLE MARKET SIZE ESTIMATES & FORECAST, BY MOBILITY TYPE, 2019-2035 (USD BILLIONS)
      81. TABLE 80. SOUTH KOREA ARMORED VEHICLE MARKET SIZE ESTIMATES & FORECAST, BY ARMOR TYPE, 2019-2035 (USD BILLIONS)
      82. TABLE 81. SOUTH KOREA ARMORED VEHICLE MARKET SIZE ESTIMATES & FORECAST, BY REGIONAL, 2019-2035 (USD BILLIONS)
      83. TABLE 82. MALAYSIA ARMORED VEHICLE MARKET SIZE ESTIMATES & FORECAST, BY APPLICATION, 2019-2035 (USD BILLIONS)
      84. TABLE 83. MALAYSIA ARMORED VEHICLE MARKET SIZE ESTIMATES & FORECAST, BY VEHICLE TYPE, 2019-2035 (USD BILLIONS)
      85. TABLE 84. MALAYSIA ARMORED VEHICLE MARKET SIZE ESTIMATES & FORECAST, BY MOBILITY TYPE, 2019-2035 (USD BILLIONS)
      86. TABLE 85. MALAYSIA ARMORED VEHICLE MARKET SIZE ESTIMATES & FORECAST, BY ARMOR TYPE, 2019-2035 (USD BILLIONS)
      87. TABLE 86. MALAYSIA ARMORED VEHICLE MARKET SIZE ESTIMATES & FORECAST, BY REGIONAL, 2019-2035 (USD BILLIONS)
      88. TABLE 87. THAILAND ARMORED VEHICLE MARKET SIZE ESTIMATES & FORECAST, BY APPLICATION, 2019-2035 (USD BILLIONS)
      89. TABLE 88. THAILAND ARMORED VEHICLE MARKET SIZE ESTIMATES & FORECAST, BY VEHICLE TYPE, 2019-2035 (USD BILLIONS)
      90. TABLE 89. THAILAND ARMORED VEHICLE MARKET SIZE ESTIMATES & FORECAST, BY MOBILITY TYPE, 2019-2035 (USD BILLIONS)
      91. TABLE 90. THAILAND ARMORED VEHICLE MARKET SIZE ESTIMATES & FORECAST, BY ARMOR TYPE, 2019-2035 (USD BILLIONS)
      92. TABLE 91. THAILAND ARMORED VEHICLE MARKET SIZE ESTIMATES & FORECAST, BY REGIONAL, 2019-2035 (USD BILLIONS)
      93. TABLE 92. INDONESIA ARMORED VEHICLE MARKET SIZE ESTIMATES & FORECAST, BY APPLICATION, 2019-2035 (USD BILLIONS)
      94. TABLE 93. INDONESIA ARMORED VEHICLE MARKET SIZE ESTIMATES & FORECAST, BY VEHICLE TYPE, 2019-2035 (USD BILLIONS)
      95. TABLE 94. INDONESIA ARMORED VEHICLE MARKET SIZE ESTIMATES & FORECAST, BY MOBILITY TYPE, 2019-2035 (USD BILLIONS)
      96. TABLE 95. INDONESIA ARMORED VEHICLE MARKET SIZE ESTIMATES & FORECAST, BY ARMOR TYPE, 2019-2035 (USD BILLIONS)
      97. TABLE 96. INDONESIA ARMORED VEHICLE MARKET SIZE ESTIMATES & FORECAST, BY REGIONAL, 2019-2035 (USD BILLIONS)
      98. TABLE 97. REST OF APAC ARMORED VEHICLE MARKET SIZE ESTIMATES & FORECAST, BY APPLICATION, 2019-2035 (USD BILLIONS)
      99. TABLE 98. REST OF APAC ARMORED VEHICLE MARKET SIZE ESTIMATES & FORECAST, BY VEHICLE TYPE, 2019-2035 (USD BILLIONS)
      100. TABLE 99. REST OF APAC ARMORED VEHICLE MARKET SIZE ESTIMATES & FORECAST, BY MOBILITY TYPE, 2019-2035 (USD BILLIONS)
      101. TABLE 100. REST OF APAC ARMORED VEHICLE MARKET SIZE ESTIMATES & FORECAST, BY ARMOR TYPE, 2019-2035 (USD BILLIONS)
      102. TABLE 101. REST OF APAC ARMORED VEHICLE MARKET SIZE ESTIMATES & FORECAST, BY REGIONAL, 2019-2035 (USD BILLIONS)
      103. TABLE 102. SOUTH AMERICA ARMORED VEHICLE MARKET SIZE ESTIMATES & FORECAST, BY APPLICATION, 2019-2035 (USD BILLIONS)
      104. TABLE 103. SOUTH AMERICA ARMORED VEHICLE MARKET SIZE ESTIMATES & FORECAST, BY VEHICLE TYPE, 2019-2035 (USD BILLIONS)
      105. TABLE 104. SOUTH AMERICA ARMORED VEHICLE MARKET SIZE ESTIMATES & FORECAST, BY MOBILITY TYPE, 2019-2035 (USD BILLIONS)
      106. TABLE 105. SOUTH AMERICA ARMORED VEHICLE MARKET SIZE ESTIMATES & FORECAST, BY ARMOR TYPE, 2019-2035 (USD BILLIONS)
      107. TABLE 106. SOUTH AMERICA ARMORED VEHICLE MARKET SIZE ESTIMATES & FORECAST, BY REGIONAL, 2019-2035 (USD BILLIONS)
      108. TABLE 107. BRAZIL ARMORED VEHICLE MARKET SIZE ESTIMATES & FORECAST, BY APPLICATION, 2019-2035 (USD BILLIONS)
      109. TABLE 108. BRAZIL ARMORED VEHICLE MARKET SIZE ESTIMATES & FORECAST, BY VEHICLE TYPE, 2019-2035 (USD BILLIONS)
      110. TABLE 109. BRAZIL ARMORED VEHICLE MARKET SIZE ESTIMATES & FORECAST, BY MOBILITY TYPE, 2019-2035 (USD BILLIONS)
      111. TABLE 110. BRAZIL ARMORED VEHICLE MARKET SIZE ESTIMATES & FORECAST, BY ARMOR TYPE, 2019-2035 (USD BILLIONS)
      112. TABLE 111. BRAZIL ARMORED VEHICLE MARKET SIZE ESTIMATES & FORECAST, BY REGIONAL, 2019-2035 (USD BILLIONS)
      113. TABLE 112. MEXICO ARMORED VEHICLE MARKET SIZE ESTIMATES & FORECAST, BY APPLICATION, 2019-2035 (USD BILLIONS)
      114. TABLE 113. MEXICO ARMORED VEHICLE MARKET SIZE ESTIMATES & FORECAST, BY VEHICLE TYPE, 2019-2035 (USD BILLIONS)
      115. TABLE 114. MEXICO ARMORED VEHICLE MARKET SIZE ESTIMATES & FORECAST, BY MOBILITY TYPE, 2019-2035 (USD BILLIONS)
      116. TABLE 115. MEXICO ARMORED VEHICLE MARKET SIZE ESTIMATES & FORECAST, BY ARMOR TYPE, 2019-2035 (USD BILLIONS)
      117. TABLE 116. MEXICO ARMORED VEHICLE MARKET SIZE ESTIMATES & FORECAST, BY REGIONAL, 2019-2035 (USD BILLIONS)
      118. TABLE 117. ARGENTINA ARMORED VEHICLE MARKET SIZE ESTIMATES & FORECAST, BY APPLICATION, 2019-2035 (USD BILLIONS)
      119. TABLE 118. ARGENTINA ARMORED VEHICLE MARKET SIZE ESTIMATES & FORECAST, BY VEHICLE TYPE, 2019-2035 (USD BILLIONS)
      120. TABLE 119. ARGENTINA ARMORED VEHICLE MARKET SIZE ESTIMATES & FORECAST, BY MOBILITY TYPE, 2019-2035 (USD BILLIONS)
      121. TABLE 120. ARGENTINA ARMORED VEHICLE MARKET SIZE ESTIMATES & FORECAST, BY ARMOR TYPE, 2019-2035 (USD BILLIONS)
      122. TABLE 121. ARGENTINA ARMORED VEHICLE MARKET SIZE ESTIMATES & FORECAST, BY REGIONAL, 2019-2035 (USD BILLIONS)
      123. TABLE 122. REST OF SOUTH AMERICA ARMORED VEHICLE MARKET SIZE ESTIMATES & FORECAST, BY APPLICATION, 2019-2035 (USD BILLIONS)
      124. TABLE 123. REST OF SOUTH AMERICA ARMORED VEHICLE MARKET SIZE ESTIMATES & FORECAST, BY VEHICLE TYPE, 2019-2035 (USD BILLIONS)
      125. TABLE 124. REST OF SOUTH AMERICA ARMORED VEHICLE MARKET SIZE ESTIMATES & FORECAST, BY MOBILITY TYPE, 2019-2035 (USD BILLIONS)
      126. TABLE 125. REST OF SOUTH AMERICA ARMORED VEHICLE MARKET SIZE ESTIMATES & FORECAST, BY ARMOR TYPE, 2019-2035 (USD BILLIONS)
      127. TABLE 126. REST OF SOUTH AMERICA ARMORED VEHICLE MARKET SIZE ESTIMATES & FORECAST, BY REGIONAL, 2019-2035 (USD BILLIONS)
      128. TABLE 127. MEA ARMORED VEHICLE MARKET SIZE ESTIMATES & FORECAST, BY APPLICATION, 2019-2035 (USD BILLIONS)
      129. TABLE 128. MEA ARMORED VEHICLE MARKET SIZE ESTIMATES & FORECAST, BY VEHICLE TYPE, 2019-2035 (USD BILLIONS)
      130. TABLE 129. MEA ARMORED VEHICLE MARKET SIZE ESTIMATES & FORECAST, BY MOBILITY TYPE, 2019-2035 (USD BILLIONS)
      131. TABLE 130. MEA ARMORED VEHICLE MARKET SIZE ESTIMATES & FORECAST, BY ARMOR TYPE, 2019-2035 (USD BILLIONS)
      132. TABLE 131. MEA ARMORED VEHICLE MARKET SIZE ESTIMATES & FORECAST, BY REGIONAL, 2019-2035 (USD BILLIONS)
      133. TABLE 132. GCC COUNTRIES ARMORED VEHICLE MARKET SIZE ESTIMATES & FORECAST, BY APPLICATION, 2019-2035 (USD BILLIONS)
      134. TABLE 133. GCC COUNTRIES ARMORED VEHICLE MARKET SIZE ESTIMATES & FORECAST, BY VEHICLE TYPE, 2019-2035 (USD BILLIONS)
      135. TABLE 134. GCC COUNTRIES ARMORED VEHICLE MARKET SIZE ESTIMATES & FORECAST, BY MOBILITY TYPE, 2019-2035 (USD BILLIONS)
      136. TABLE 135. GCC COUNTRIES ARMORED VEHICLE MARKET SIZE ESTIMATES & FORECAST, BY ARMOR TYPE, 2019-2035 (USD BILLIONS)
      137. TABLE 136. GCC COUNTRIES ARMORED VEHICLE MARKET SIZE ESTIMATES & FORECAST, BY REGIONAL, 2019-2035 (USD BILLIONS)
      138. TABLE 137. SOUTH AFRICA ARMORED VEHICLE MARKET SIZE ESTIMATES & FORECAST, BY APPLICATION, 2019-2035 (USD BILLIONS)
      139. TABLE 138. SOUTH AFRICA ARMORED VEHICLE MARKET SIZE ESTIMATES & FORECAST, BY VEHICLE TYPE, 2019-2035 (USD BILLIONS)
      140. TABLE 139. SOUTH AFRICA ARMORED VEHICLE MARKET SIZE ESTIMATES & FORECAST, BY MOBILITY TYPE, 2019-2035 (USD BILLIONS)
      141. TABLE 140. SOUTH AFRICA ARMORED VEHICLE MARKET SIZE ESTIMATES & FORECAST, BY ARMOR TYPE, 2019-2035 (USD BILLIONS)
      142. TABLE 141. SOUTH AFRICA ARMORED VEHICLE MARKET SIZE ESTIMATES & FORECAST, BY REGIONAL, 2019-2035 (USD BILLIONS)
      143. TABLE 142. REST OF MEA ARMORED VEHICLE MARKET SIZE ESTIMATES & FORECAST, BY APPLICATION, 2019-2035 (USD BILLIONS)
      144. TABLE 143. REST OF MEA ARMORED VEHICLE MARKET SIZE ESTIMATES & FORECAST, BY VEHICLE TYPE, 2019-2035 (USD BILLIONS)
      145. TABLE 144. REST OF MEA ARMORED VEHICLE MARKET SIZE ESTIMATES & FORECAST, BY MOBILITY TYPE, 2019-2035 (USD BILLIONS)
      146. TABLE 145. REST OF MEA ARMORED VEHICLE MARKET SIZE ESTIMATES & FORECAST, BY ARMOR TYPE, 2019-2035 (USD BILLIONS)
      147. TABLE 146. REST OF MEA ARMORED VEHICLE MARKET SIZE ESTIMATES & FORECAST, BY REGIONAL, 2019-2035 (USD BILLIONS)
      148. TABLE 147. PRODUCT LAUNCH/PRODUCT DEVELOPMENT/APPROVAL
      149. TABLE 148. ACQUISITION/PARTNERSHIP   LIST OF FIGURES
      150. FIGURE 1. MARKET SYNOPSIS
      151. FIGURE 2. NORTH AMERICA ARMORED VEHICLE MARKET ANALYSIS
      152. FIGURE 3. US ARMORED VEHICLE MARKET ANALYSIS BY APPLICATION
      153. FIGURE 4. US ARMORED VEHICLE MARKET ANALYSIS BY VEHICLE TYPE
      154. FIGURE 5. US ARMORED VEHICLE MARKET ANALYSIS BY MOBILITY TYPE
      155. FIGURE 6. US ARMORED VEHICLE MARKET ANALYSIS BY ARMOR TYPE
      156. FIGURE 7. US ARMORED VEHICLE MARKET ANALYSIS BY REGIONAL
      157. FIGURE 8. CANADA ARMORED VEHICLE MARKET ANALYSIS BY APPLICATION
      158. FIGURE 9. CANADA ARMORED VEHICLE MARKET ANALYSIS BY VEHICLE TYPE
      159. FIGURE 10. CANADA ARMORED VEHICLE MARKET ANALYSIS BY MOBILITY TYPE
      160. FIGURE 11. CANADA ARMORED VEHICLE MARKET ANALYSIS BY ARMOR TYPE
      161. FIGURE 12. CANADA ARMORED VEHICLE MARKET ANALYSIS BY REGIONAL
      162. FIGURE 13. EUROPE ARMORED VEHICLE MARKET ANALYSIS
      163. FIGURE 14. GERMANY ARMORED VEHICLE MARKET ANALYSIS BY APPLICATION
      164. FIGURE 15. GERMANY ARMORED VEHICLE MARKET ANALYSIS BY VEHICLE TYPE
      165. FIGURE 16. GERMANY ARMORED VEHICLE MARKET ANALYSIS BY MOBILITY TYPE
      166. FIGURE 17. GERMANY ARMORED VEHICLE MARKET ANALYSIS BY ARMOR TYPE
      167. FIGURE 18. GERMANY ARMORED VEHICLE MARKET ANALYSIS BY REGIONAL
      168. FIGURE 19. UK ARMORED VEHICLE MARKET ANALYSIS BY APPLICATION
      169. FIGURE 20. UK ARMORED VEHICLE MARKET ANALYSIS BY VEHICLE TYPE
      170. FIGURE 21. UK ARMORED VEHICLE MARKET ANALYSIS BY MOBILITY TYPE
      171. FIGURE 22. UK ARMORED VEHICLE MARKET ANALYSIS BY ARMOR TYPE
      172. FIGURE 23. UK ARMORED VEHICLE MARKET ANALYSIS BY REGIONAL
      173. FIGURE 24. FRANCE ARMORED VEHICLE MARKET ANALYSIS BY APPLICATION
      174. FIGURE 25. FRANCE ARMORED VEHICLE MARKET ANALYSIS BY VEHICLE TYPE
      175. FIGURE 26. FRANCE ARMORED VEHICLE MARKET ANALYSIS BY MOBILITY TYPE
      176. FIGURE 27. FRANCE ARMORED VEHICLE MARKET ANALYSIS BY ARMOR TYPE
      177. FIGURE 28. FRANCE ARMORED VEHICLE MARKET ANALYSIS BY REGIONAL
      178. FIGURE 29. RUSSIA ARMORED VEHICLE MARKET ANALYSIS BY APPLICATION
      179. FIGURE 30. RUSSIA ARMORED VEHICLE MARKET ANALYSIS BY VEHICLE TYPE
      180. FIGURE 31. RUSSIA ARMORED VEHICLE MARKET ANALYSIS BY MOBILITY TYPE
      181. FIGURE 32. RUSSIA ARMORED VEHICLE MARKET ANALYSIS BY ARMOR TYPE
      182. FIGURE 33. RUSSIA ARMORED VEHICLE MARKET ANALYSIS BY REGIONAL
      183. FIGURE 34. ITALY ARMORED VEHICLE MARKET ANALYSIS BY APPLICATION
      184. FIGURE 35. ITALY ARMORED VEHICLE MARKET ANALYSIS BY VEHICLE TYPE
      185. FIGURE 36. ITALY ARMORED VEHICLE MARKET ANALYSIS BY MOBILITY TYPE
      186. FIGURE 37. ITALY ARMORED VEHICLE MARKET ANALYSIS BY ARMOR TYPE
      187. FIGURE 38. ITALY ARMORED VEHICLE MARKET ANALYSIS BY REGIONAL
      188. FIGURE 39. SPAIN ARMORED VEHICLE MARKET ANALYSIS BY APPLICATION
      189. FIGURE 40. SPAIN ARMORED VEHICLE MARKET ANALYSIS BY VEHICLE TYPE
      190. FIGURE 41. SPAIN ARMORED VEHICLE MARKET ANALYSIS BY MOBILITY TYPE
      191. FIGURE 42. SPAIN ARMORED VEHICLE MARKET ANALYSIS BY ARMOR TYPE
      192. FIGURE 43. SPAIN ARMORED VEHICLE MARKET ANALYSIS BY REGIONAL
      193. FIGURE 44. REST OF EUROPE ARMORED VEHICLE MARKET ANALYSIS BY APPLICATION
      194. FIGURE 45. REST OF EUROPE ARMORED VEHICLE MARKET ANALYSIS BY VEHICLE TYPE
      195. FIGURE 46. REST OF EUROPE ARMORED VEHICLE MARKET ANALYSIS BY MOBILITY TYPE
      196. FIGURE 47. REST OF EUROPE ARMORED VEHICLE MARKET ANALYSIS BY ARMOR TYPE
      197. FIGURE 48. REST OF EUROPE ARMORED VEHICLE MARKET ANALYSIS BY REGIONAL
      198. FIGURE 49. APAC ARMORED VEHICLE MARKET ANALYSIS
      199. FIGURE 50. CHINA ARMORED VEHICLE MARKET ANALYSIS BY APPLICATION
      200. FIGURE 51. CHINA ARMORED VEHICLE MARKET ANALYSIS BY VEHICLE TYPE
      201. FIGURE 52. CHINA ARMORED VEHICLE MARKET ANALYSIS BY MOBILITY TYPE
      202. FIGURE 53. CHINA ARMORED VEHICLE MARKET ANALYSIS BY ARMOR TYPE
      203. FIGURE 54. CHINA ARMORED VEHICLE MARKET ANALYSIS BY REGIONAL
      204. FIGURE 55. INDIA ARMORED VEHICLE MARKET ANALYSIS BY APPLICATION
      205. FIGURE 56. INDIA ARMORED VEHICLE MARKET ANALYSIS BY VEHICLE TYPE
      206. FIGURE 57. INDIA ARMORED VEHICLE MARKET ANALYSIS BY MOBILITY TYPE
      207. FIGURE 58. INDIA ARMORED VEHICLE MARKET ANALYSIS BY ARMOR TYPE
      208. FIGURE 59. INDIA ARMORED VEHICLE MARKET ANALYSIS BY REGIONAL
      209. FIGURE 60. JAPAN ARMORED VEHICLE MARKET ANALYSIS BY APPLICATION
      210. FIGURE 61. JAPAN ARMORED VEHICLE MARKET ANALYSIS BY VEHICLE TYPE
      211. FIGURE 62. JAPAN ARMORED VEHICLE MARKET ANALYSIS BY MOBILITY TYPE
      212. FIGURE 63. JAPAN ARMORED VEHICLE MARKET ANALYSIS BY ARMOR TYPE
      213. FIGURE 64. JAPAN ARMORED VEHICLE MARKET ANALYSIS BY REGIONAL
      214. FIGURE 65. SOUTH KOREA ARMORED VEHICLE MARKET ANALYSIS BY APPLICATION
      215. FIGURE 66. SOUTH KOREA ARMORED VEHICLE MARKET ANALYSIS BY VEHICLE TYPE
      216. FIGURE 67. SOUTH KOREA ARMORED VEHICLE MARKET ANALYSIS BY MOBILITY TYPE
      217. FIGURE 68. SOUTH KOREA ARMORED VEHICLE MARKET ANALYSIS BY ARMOR TYPE
      218. FIGURE 69. SOUTH KOREA ARMORED VEHICLE MARKET ANALYSIS BY REGIONAL
      219. FIGURE 70. MALAYSIA ARMORED VEHICLE MARKET ANALYSIS BY APPLICATION
      220. FIGURE 71. MALAYSIA ARMORED VEHICLE MARKET ANALYSIS BY VEHICLE TYPE
      221. FIGURE 72. MALAYSIA ARMORED VEHICLE MARKET ANALYSIS BY MOBILITY TYPE
      222. FIGURE 73. MALAYSIA ARMORED VEHICLE MARKET ANALYSIS BY ARMOR TYPE
      223. FIGURE 74. MALAYSIA ARMORED VEHICLE MARKET ANALYSIS BY REGIONAL
      224. FIGURE 75. THAILAND ARMORED VEHICLE MARKET ANALYSIS BY APPLICATION
      225. FIGURE 76. THAILAND ARMORED VEHICLE MARKET ANALYSIS BY VEHICLE TYPE
      226. FIGURE 77. THAILAND ARMORED VEHICLE MARKET ANALYSIS BY MOBILITY TYPE
      227. FIGURE 78. THAILAND ARMORED VEHICLE MARKET ANALYSIS BY ARMOR TYPE
      228. FIGURE 79. THAILAND ARMORED VEHICLE MARKET ANALYSIS BY REGIONAL
      229. FIGURE 80. INDONESIA ARMORED VEHICLE MARKET ANALYSIS BY APPLICATION
      230. FIGURE 81. INDONESIA ARMORED VEHICLE MARKET ANALYSIS BY VEHICLE TYPE
      231. FIGURE 82. INDONESIA ARMORED VEHICLE MARKET ANALYSIS BY MOBILITY TYPE
      232. FIGURE 83. INDONESIA ARMORED VEHICLE MARKET ANALYSIS BY ARMOR TYPE
      233. FIGURE 84. INDONESIA ARMORED VEHICLE MARKET ANALYSIS BY REGIONAL
      234. FIGURE 85. REST OF APAC ARMORED VEHICLE MARKET ANALYSIS BY APPLICATION
      235. FIGURE 86. REST OF APAC ARMORED VEHICLE MARKET ANALYSIS BY VEHICLE TYPE
      236. FIGURE 87. REST OF APAC ARMORED VEHICLE MARKET ANALYSIS BY MOBILITY TYPE
      237. FIGURE 88. REST OF APAC ARMORED VEHICLE MARKET ANALYSIS BY ARMOR TYPE
      238. FIGURE 89. REST OF APAC ARMORED VEHICLE MARKET ANALYSIS BY REGIONAL
      239. FIGURE 90. SOUTH AMERICA ARMORED VEHICLE MARKET ANALYSIS
      240. FIGURE 91. BRAZIL ARMORED VEHICLE MARKET ANALYSIS BY APPLICATION
      241. FIGURE 92. BRAZIL ARMORED VEHICLE MARKET ANALYSIS BY VEHICLE TYPE
      242. FIGURE 93. BRAZIL ARMORED VEHICLE MARKET ANALYSIS BY MOBILITY TYPE
      243. FIGURE 94. BRAZIL ARMORED VEHICLE MARKET ANALYSIS BY ARMOR TYPE
      244. FIGURE 95. BRAZIL ARMORED VEHICLE MARKET ANALYSIS BY REGIONAL
      245. FIGURE 96. MEXICO ARMORED VEHICLE MARKET ANALYSIS BY APPLICATION
      246. FIGURE 97. MEXICO ARMORED VEHICLE MARKET ANALYSIS BY VEHICLE TYPE
      247. FIGURE 98. MEXICO ARMORED VEHICLE MARKET ANALYSIS BY MOBILITY TYPE
      248. FIGURE 99. MEXICO ARMORED VEHICLE MARKET ANALYSIS BY ARMOR TYPE
      249. FIGURE 100. MEXICO ARMORED VEHICLE MARKET ANALYSIS BY REGIONAL
      250. FIGURE 101. ARGENTINA ARMORED VEHICLE MARKET ANALYSIS BY APPLICATION
      251. FIGURE 102. ARGENTINA ARMORED VEHICLE MARKET ANALYSIS BY VEHICLE TYPE
      252. FIGURE 103. ARGENTINA ARMORED VEHICLE MARKET ANALYSIS BY MOBILITY TYPE
      253. FIGURE 104. ARGENTINA ARMORED VEHICLE MARKET ANALYSIS BY ARMOR TYPE
      254. FIGURE 105. ARGENTINA ARMORED VEHICLE MARKET ANALYSIS BY REGIONAL
      255. FIGURE 106. REST OF SOUTH AMERICA ARMORED VEHICLE MARKET ANALYSIS BY APPLICATION
      256. FIGURE 107. REST OF SOUTH AMERICA ARMORED VEHICLE MARKET ANALYSIS BY VEHICLE TYPE
      257. FIGURE 108. REST OF SOUTH AMERICA ARMORED VEHICLE MARKET ANALYSIS BY MOBILITY TYPE
      258. FIGURE 109. REST OF SOUTH AMERICA ARMORED VEHICLE MARKET ANALYSIS BY ARMOR TYPE
      259. FIGURE 110. REST OF SOUTH AMERICA ARMORED VEHICLE MARKET ANALYSIS BY REGIONAL
      260. FIGURE 111. MEA ARMORED VEHICLE MARKET ANALYSIS
      261. FIGURE 112. GCC COUNTRIES ARMORED VEHICLE MARKET ANALYSIS BY APPLICATION
      262. FIGURE 113. GCC COUNTRIES ARMORED VEHICLE MARKET ANALYSIS BY VEHICLE TYPE
      263. FIGURE 114. GCC COUNTRIES ARMORED VEHICLE MARKET ANALYSIS BY MOBILITY TYPE
      264. FIGURE 115. GCC COUNTRIES ARMORED VEHICLE MARKET ANALYSIS BY ARMOR TYPE
      265. FIGURE 116. GCC COUNTRIES ARMORED VEHICLE MARKET ANALYSIS BY REGIONAL
      266. FIGURE 117. SOUTH AFRICA ARMORED VEHICLE MARKET ANALYSIS BY APPLICATION
      267. FIGURE 118. SOUTH AFRICA ARMORED VEHICLE MARKET ANALYSIS BY VEHICLE TYPE
      268. FIGURE 119. SOUTH AFRICA ARMORED VEHICLE MARKET ANALYSIS BY MOBILITY TYPE
      269. FIGURE 120. SOUTH AFRICA ARMORED VEHICLE MARKET ANALYSIS BY ARMOR TYPE
      270. FIGURE 121. SOUTH AFRICA ARMORED VEHICLE MARKET ANALYSIS BY REGIONAL
      271. FIGURE 122. REST OF MEA ARMORED VEHICLE MARKET ANALYSIS BY APPLICATION
      272. FIGURE 123. REST OF MEA ARMORED VEHICLE MARKET ANALYSIS BY VEHICLE TYPE
      273. FIGURE 124. REST OF MEA ARMORED VEHICLE MARKET ANALYSIS BY MOBILITY TYPE
      274. FIGURE 125. REST OF MEA ARMORED VEHICLE MARKET ANALYSIS BY ARMOR TYPE
      275. FIGURE 126. REST OF MEA ARMORED VEHICLE MARKET ANALYSIS BY REGIONAL
      276. FIGURE 127. KEY BUYING CRITERIA OF ARMORED VEHICLE MARKET
      277. FIGURE 128. RESEARCH PROCESS OF MRFR
      278. FIGURE 129. DRO ANALYSIS OF ARMORED VEHICLE MARKET
      279. FIGURE 130. DRIVERS IMPACT ANALYSIS: ARMORED VEHICLE MARKET
      280. FIGURE 131. RESTRAINTS IMPACT ANALYSIS: ARMORED VEHICLE MARKET
      281. FIGURE 132. SUPPLY / VALUE CHAIN: ARMORED VEHICLE MARKET
      282. FIGURE 133. ARMORED VEHICLE MARKET, BY APPLICATION, 2025 (% SHARE)
      283. FIGURE 134. ARMORED VEHICLE MARKET, BY APPLICATION, 2019 TO 2035 (USD Billions)
      284. FIGURE 135. ARMORED VEHICLE MARKET, BY VEHICLE TYPE, 2025 (% SHARE)
      285. FIGURE 136. ARMORED VEHICLE MARKET, BY VEHICLE TYPE, 2019 TO 2035 (USD Billions)
      286. FIGURE 137. ARMORED VEHICLE MARKET, BY MOBILITY TYPE, 2025 (% SHARE)
      287. FIGURE 138. ARMORED VEHICLE MARKET, BY MOBILITY TYPE, 2019 TO 2035 (USD Billions)
      288. FIGURE 139. ARMORED VEHICLE MARKET, BY ARMOR TYPE, 2025 (% SHARE)
      289. FIGURE 140. ARMORED VEHICLE MARKET, BY ARMOR TYPE, 2019 TO 2035 (USD Billions)
      290. FIGURE 141. ARMORED VEHICLE MARKET, BY REGIONAL, 2025 (% SHARE)
      291. FIGURE 142. ARMORED VEHICLE MARKET, BY REGIONAL, 2019 TO 2035 (USD Billions)
      292. FIGURE 143. BENCHMARKING OF MAJOR COMPETITORS

    Armored Vehicle Market Segmentation

    • Armored Vehicle Market By Application (USD Billion, 2019-2035)

      • Military
      • Law Enforcement
      • Civil Defense
      • Private Security
      • Emergency Services
    • Armored Vehicle Market By Vehicle Type (USD Billion, 2019-2035)

      • Personnel Carriers
      • Main Battle Tanks
      • Armored Personnel Carriers
      • Mine-Resistant Ambush Protected Vehicles
      • Light Tactical Vehicles
    • Armored Vehicle Market By Mobility Type (USD Billion, 2019-2035)

      • Wheeled
      • Tracked
      • Hybrid
    • Armored Vehicle Market By Armor Type (USD Billion, 2019-2035)

      • Composite Armor
      • Ceramic Armor
      • Steel Armor
      • Spall Liner
    • Armored Vehicle Market By Regional (USD Billion, 2019-2035)

      • North America
      • Europe
      • South America
      • Asia Pacific
      • Middle East and Africa

    Armored Vehicle Market Regional Outlook (USD Billion, 2019-2035)

    • North America Outlook (USD Billion, 2019-2035)

      • North America Armored Vehicle Market by Application Type

        • Military
        • Law Enforcement
        • Civil Defense
        • Private Security
        • Emergency Services
      • North America Armored Vehicle Market by Vehicle Type

        • Personnel Carriers
        • Main Battle Tanks
        • Armored Personnel Carriers
        • Mine-Resistant Ambush Protected Vehicles
        • Light Tactical Vehicles
      • North America Armored Vehicle Market by Mobility Type

        • Wheeled
        • Tracked
        • Hybrid
      • North America Armored Vehicle Market by Armor Type

        • Composite Armor
        • Ceramic Armor
        • Steel Armor
        • Spall Liner
      • North America Armored Vehicle Market by Regional Type

        • US
        • Canada
      • US Outlook (USD Billion, 2019-2035)
      • US Armored Vehicle Market by Application Type

        • Military
        • Law Enforcement
        • Civil Defense
        • Private Security
        • Emergency Services
      • US Armored Vehicle Market by Vehicle Type

        • Personnel Carriers
        • Main Battle Tanks
        • Armored Personnel Carriers
        • Mine-Resistant Ambush Protected Vehicles
        • Light Tactical Vehicles
      • US Armored Vehicle Market by Mobility Type

        • Wheeled
        • Tracked
        • Hybrid
      • US Armored Vehicle Market by Armor Type

        • Composite Armor
        • Ceramic Armor
        • Steel Armor
        • Spall Liner
      • CANADA Outlook (USD Billion, 2019-2035)
      • CANADA Armored Vehicle Market by Application Type

        • Military
        • Law Enforcement
        • Civil Defense
        • Private Security
        • Emergency Services
      • CANADA Armored Vehicle Market by Vehicle Type

        • Personnel Carriers
        • Main Battle Tanks
        • Armored Personnel Carriers
        • Mine-Resistant Ambush Protected Vehicles
        • Light Tactical Vehicles
      • CANADA Armored Vehicle Market by Mobility Type

        • Wheeled
        • Tracked
        • Hybrid
      • CANADA Armored Vehicle Market by Armor Type

        • Composite Armor
        • Ceramic Armor
        • Steel Armor
        • Spall Liner
    • Europe Outlook (USD Billion, 2019-2035)

      • Europe Armored Vehicle Market by Application Type

        • Military
        • Law Enforcement
        • Civil Defense
        • Private Security
        • Emergency Services
      • Europe Armored Vehicle Market by Vehicle Type

        • Personnel Carriers
        • Main Battle Tanks
        • Armored Personnel Carriers
        • Mine-Resistant Ambush Protected Vehicles
        • Light Tactical Vehicles
      • Europe Armored Vehicle Market by Mobility Type

        • Wheeled
        • Tracked
        • Hybrid
      • Europe Armored Vehicle Market by Armor Type

        • Composite Armor
        • Ceramic Armor
        • Steel Armor
        • Spall Liner
      • Europe Armored Vehicle Market by Regional Type

        • Germany
        • UK
        • France
        • Russia
        • Italy
        • Spain
        • Rest of Europe
      • GERMANY Outlook (USD Billion, 2019-2035)
      • GERMANY Armored Vehicle Market by Application Type

        • Military
        • Law Enforcement
        • Civil Defense
        • Private Security
        • Emergency Services
      • GERMANY Armored Vehicle Market by Vehicle Type

        • Personnel Carriers
        • Main Battle Tanks
        • Armored Personnel Carriers
        • Mine-Resistant Ambush Protected Vehicles
        • Light Tactical Vehicles
      • GERMANY Armored Vehicle Market by Mobility Type

        • Wheeled
        • Tracked
        • Hybrid
      • GERMANY Armored Vehicle Market by Armor Type

        • Composite Armor
        • Ceramic Armor
        • Steel Armor
        • Spall Liner
      • UK Outlook (USD Billion, 2019-2035)
      • UK Armored Vehicle Market by Application Type

        • Military
        • Law Enforcement
        • Civil Defense
        • Private Security
        • Emergency Services
      • UK Armored Vehicle Market by Vehicle Type

        • Personnel Carriers
        • Main Battle Tanks
        • Armored Personnel Carriers
        • Mine-Resistant Ambush Protected Vehicles
        • Light Tactical Vehicles
      • UK Armored Vehicle Market by Mobility Type

        • Wheeled
        • Tracked
        • Hybrid
      • UK Armored Vehicle Market by Armor Type

        • Composite Armor
        • Ceramic Armor
        • Steel Armor
        • Spall Liner
      • FRANCE Outlook (USD Billion, 2019-2035)
      • FRANCE Armored Vehicle Market by Application Type

        • Military
        • Law Enforcement
        • Civil Defense
        • Private Security
        • Emergency Services
      • FRANCE Armored Vehicle Market by Vehicle Type

        • Personnel Carriers
        • Main Battle Tanks
        • Armored Personnel Carriers
        • Mine-Resistant Ambush Protected Vehicles
        • Light Tactical Vehicles
      • FRANCE Armored Vehicle Market by Mobility Type

        • Wheeled
        • Tracked
        • Hybrid
      • FRANCE Armored Vehicle Market by Armor Type

        • Composite Armor
        • Ceramic Armor
        • Steel Armor
        • Spall Liner
      • RUSSIA Outlook (USD Billion, 2019-2035)
      • RUSSIA Armored Vehicle Market by Application Type

        • Military
        • Law Enforcement
        • Civil Defense
        • Private Security
        • Emergency Services
      • RUSSIA Armored Vehicle Market by Vehicle Type

        • Personnel Carriers
        • Main Battle Tanks
        • Armored Personnel Carriers
        • Mine-Resistant Ambush Protected Vehicles
        • Light Tactical Vehicles
      • RUSSIA Armored Vehicle Market by Mobility Type

        • Wheeled
        • Tracked
        • Hybrid
      • RUSSIA Armored Vehicle Market by Armor Type

        • Composite Armor
        • Ceramic Armor
        • Steel Armor
        • Spall Liner
      • ITALY Outlook (USD Billion, 2019-2035)
      • ITALY Armored Vehicle Market by Application Type

        • Military
        • Law Enforcement
        • Civil Defense
        • Private Security
        • Emergency Services
      • ITALY Armored Vehicle Market by Vehicle Type

        • Personnel Carriers
        • Main Battle Tanks
        • Armored Personnel Carriers
        • Mine-Resistant Ambush Protected Vehicles
        • Light Tactical Vehicles
      • ITALY Armored Vehicle Market by Mobility Type

        • Wheeled
        • Tracked
        • Hybrid
      • ITALY Armored Vehicle Market by Armor Type

        • Composite Armor
        • Ceramic Armor
        • Steel Armor
        • Spall Liner
      • SPAIN Outlook (USD Billion, 2019-2035)
      • SPAIN Armored Vehicle Market by Application Type

        • Military
        • Law Enforcement
        • Civil Defense
        • Private Security
        • Emergency Services
      • SPAIN Armored Vehicle Market by Vehicle Type

        • Personnel Carriers
        • Main Battle Tanks
        • Armored Personnel Carriers
        • Mine-Resistant Ambush Protected Vehicles
        • Light Tactical Vehicles
      • SPAIN Armored Vehicle Market by Mobility Type

        • Wheeled
        • Tracked
        • Hybrid
      • SPAIN Armored Vehicle Market by Armor Type

        • Composite Armor
        • Ceramic Armor
        • Steel Armor
        • Spall Liner
      • REST OF EUROPE Outlook (USD Billion, 2019-2035)
      • REST OF EUROPE Armored Vehicle Market by Application Type

        • Military
        • Law Enforcement
        • Civil Defense
        • Private Security
        • Emergency Services
      • REST OF EUROPE Armored Vehicle Market by Vehicle Type

        • Personnel Carriers
        • Main Battle Tanks
        • Armored Personnel Carriers
        • Mine-Resistant Ambush Protected Vehicles
        • Light Tactical Vehicles
      • REST OF EUROPE Armored Vehicle Market by Mobility Type

        • Wheeled
        • Tracked
        • Hybrid
      • REST OF EUROPE Armored Vehicle Market by Armor Type

        • Composite Armor
        • Ceramic Armor
        • Steel Armor
        • Spall Liner
    • APAC Outlook (USD Billion, 2019-2035)

      • APAC Armored Vehicle Market by Application Type

        • Military
        • Law Enforcement
        • Civil Defense
        • Private Security
        • Emergency Services
      • APAC Armored Vehicle Market by Vehicle Type

        • Personnel Carriers
        • Main Battle Tanks
        • Armored Personnel Carriers
        • Mine-Resistant Ambush Protected Vehicles
        • Light Tactical Vehicles
      • APAC Armored Vehicle Market by Mobility Type

        • Wheeled
        • Tracked
        • Hybrid
      • APAC Armored Vehicle Market by Armor Type

        • Composite Armor
        • Ceramic Armor
        • Steel Armor
        • Spall Liner
      • APAC Armored Vehicle Market by Regional Type

        • China
        • India
        • Japan
        • South Korea
        • Malaysia
        • Thailand
        • Indonesia
        • Rest of APAC
      • CHINA Outlook (USD Billion, 2019-2035)
      • CHINA Armored Vehicle Market by Application Type

        • Military
        • Law Enforcement
        • Civil Defense
        • Private Security
        • Emergency Services
      • CHINA Armored Vehicle Market by Vehicle Type

        • Personnel Carriers
        • Main Battle Tanks
        • Armored Personnel Carriers
        • Mine-Resistant Ambush Protected Vehicles
        • Light Tactical Vehicles
      • CHINA Armored Vehicle Market by Mobility Type

        • Wheeled
        • Tracked
        • Hybrid
      • CHINA Armored Vehicle Market by Armor Type

        • Composite Armor
        • Ceramic Armor
        • Steel Armor
        • Spall Liner
      • INDIA Outlook (USD Billion, 2019-2035)
      • INDIA Armored Vehicle Market by Application Type

        • Military
        • Law Enforcement
        • Civil Defense
        • Private Security
        • Emergency Services
      • INDIA Armored Vehicle Market by Vehicle Type

        • Personnel Carriers
        • Main Battle Tanks
        • Armored Personnel Carriers
        • Mine-Resistant Ambush Protected Vehicles
        • Light Tactical Vehicles
      • INDIA Armored Vehicle Market by Mobility Type

        • Wheeled
        • Tracked
        • Hybrid
      • INDIA Armored Vehicle Market by Armor Type

        • Composite Armor
        • Ceramic Armor
        • Steel Armor
        • Spall Liner
      • JAPAN Outlook (USD Billion, 2019-2035)
      • JAPAN Armored Vehicle Market by Application Type

        • Military
        • Law Enforcement
        • Civil Defense
        • Private Security
        • Emergency Services
      • JAPAN Armored Vehicle Market by Vehicle Type

        • Personnel Carriers
        • Main Battle Tanks
        • Armored Personnel Carriers
        • Mine-Resistant Ambush Protected Vehicles
        • Light Tactical Vehicles
      • JAPAN Armored Vehicle Market by Mobility Type

        • Wheeled
        • Tracked
        • Hybrid
      • JAPAN Armored Vehicle Market by Armor Type

        • Composite Armor
        • Ceramic Armor
        • Steel Armor
        • Spall Liner
      • SOUTH KOREA Outlook (USD Billion, 2019-2035)
      • SOUTH KOREA Armored Vehicle Market by Application Type

        • Military
        • Law Enforcement
        • Civil Defense
        • Private Security
        • Emergency Services
      • SOUTH KOREA Armored Vehicle Market by Vehicle Type

        • Personnel Carriers
        • Main Battle Tanks
        • Armored Personnel Carriers
        • Mine-Resistant Ambush Protected Vehicles
        • Light Tactical Vehicles
      • SOUTH KOREA Armored Vehicle Market by Mobility Type

        • Wheeled
        • Tracked
        • Hybrid
      • SOUTH KOREA Armored Vehicle Market by Armor Type

        • Composite Armor
        • Ceramic Armor
        • Steel Armor
        • Spall Liner
      • MALAYSIA Outlook (USD Billion, 2019-2035)
      • MALAYSIA Armored Vehicle Market by Application Type

        • Military
        • Law Enforcement
        • Civil Defense
        • Private Security
        • Emergency Services
      • MALAYSIA Armored Vehicle Market by Vehicle Type

        • Personnel Carriers
        • Main Battle Tanks
        • Armored Personnel Carriers
        • Mine-Resistant Ambush Protected Vehicles
        • Light Tactical Vehicles
      • MALAYSIA Armored Vehicle Market by Mobility Type

        • Wheeled
        • Tracked
        • Hybrid
      • MALAYSIA Armored Vehicle Market by Armor Type

        • Composite Armor
        • Ceramic Armor
        • Steel Armor
        • Spall Liner
      • THAILAND Outlook (USD Billion, 2019-2035)
      • THAILAND Armored Vehicle Market by Application Type

        • Military
        • Law Enforcement
        • Civil Defense
        • Private Security
        • Emergency Services
      • THAILAND Armored Vehicle Market by Vehicle Type

        • Personnel Carriers
        • Main Battle Tanks
        • Armored Personnel Carriers
        • Mine-Resistant Ambush Protected Vehicles
        • Light Tactical Vehicles
      • THAILAND Armored Vehicle Market by Mobility Type

        • Wheeled
        • Tracked
        • Hybrid
      • THAILAND Armored Vehicle Market by Armor Type

        • Composite Armor
        • Ceramic Armor
        • Steel Armor
        • Spall Liner
      • INDONESIA Outlook (USD Billion, 2019-2035)
      • INDONESIA Armored Vehicle Market by Application Type

        • Military
        • Law Enforcement
        • Civil Defense
        • Private Security
        • Emergency Services
      • INDONESIA Armored Vehicle Market by Vehicle Type

        • Personnel Carriers
        • Main Battle Tanks
        • Armored Personnel Carriers
        • Mine-Resistant Ambush Protected Vehicles
        • Light Tactical Vehicles
      • INDONESIA Armored Vehicle Market by Mobility Type

        • Wheeled
        • Tracked
        • Hybrid
      • INDONESIA Armored Vehicle Market by Armor Type

        • Composite Armor
        • Ceramic Armor
        • Steel Armor
        • Spall Liner
      • REST OF APAC Outlook (USD Billion, 2019-2035)
      • REST OF APAC Armored Vehicle Market by Application Type

        • Military
        • Law Enforcement
        • Civil Defense
        • Private Security
        • Emergency Services
      • REST OF APAC Armored Vehicle Market by Vehicle Type

        • Personnel Carriers
        • Main Battle Tanks
        • Armored Personnel Carriers
        • Mine-Resistant Ambush Protected Vehicles
        • Light Tactical Vehicles
      • REST OF APAC Armored Vehicle Market by Mobility Type

        • Wheeled
        • Tracked
        • Hybrid
      • REST OF APAC Armored Vehicle Market by Armor Type

        • Composite Armor
        • Ceramic Armor
        • Steel Armor
        • Spall Liner
    • South America Outlook (USD Billion, 2019-2035)

      • South America Armored Vehicle Market by Application Type

        • Military
        • Law Enforcement
        • Civil Defense
        • Private Security
        • Emergency Services
      • South America Armored Vehicle Market by Vehicle Type

        • Personnel Carriers
        • Main Battle Tanks
        • Armored Personnel Carriers
        • Mine-Resistant Ambush Protected Vehicles
        • Light Tactical Vehicles
      • South America Armored Vehicle Market by Mobility Type

        • Wheeled
        • Tracked
        • Hybrid
      • South America Armored Vehicle Market by Armor Type

        • Composite Armor
        • Ceramic Armor
        • Steel Armor
        • Spall Liner
      • South America Armored Vehicle Market by Regional Type

        • Brazil
        • Mexico
        • Argentina
        • Rest of South America
      • BRAZIL Outlook (USD Billion, 2019-2035)
      • BRAZIL Armored Vehicle Market by Application Type

        • Military
        • Law Enforcement
        • Civil Defense
        • Private Security
        • Emergency Services
      • BRAZIL Armored Vehicle Market by Vehicle Type

        • Personnel Carriers
        • Main Battle Tanks
        • Armored Personnel Carriers
        • Mine-Resistant Ambush Protected Vehicles
        • Light Tactical Vehicles
      • BRAZIL Armored Vehicle Market by Mobility Type

        • Wheeled
        • Tracked
        • Hybrid
      • BRAZIL Armored Vehicle Market by Armor Type

        • Composite Armor
        • Ceramic Armor
        • Steel Armor
        • Spall Liner
      • MEXICO Outlook (USD Billion, 2019-2035)
      • MEXICO Armored Vehicle Market by Application Type

        • Military
        • Law Enforcement
        • Civil Defense
        • Private Security
        • Emergency Services
      • MEXICO Armored Vehicle Market by Vehicle Type

        • Personnel Carriers
        • Main Battle Tanks
        • Armored Personnel Carriers
        • Mine-Resistant Ambush Protected Vehicles
        • Light Tactical Vehicles
      • MEXICO Armored Vehicle Market by Mobility Type

        • Wheeled
        • Tracked
        • Hybrid
      • MEXICO Armored Vehicle Market by Armor Type

        • Composite Armor
        • Ceramic Armor
        • Steel Armor
        • Spall Liner
      • ARGENTINA Outlook (USD Billion, 2019-2035)
      • ARGENTINA Armored Vehicle Market by Application Type

        • Military
        • Law Enforcement
        • Civil Defense
        • Private Security
        • Emergency Services
      • ARGENTINA Armored Vehicle Market by Vehicle Type

        • Personnel Carriers
        • Main Battle Tanks
        • Armored Personnel Carriers
        • Mine-Resistant Ambush Protected Vehicles
        • Light Tactical Vehicles
      • ARGENTINA Armored Vehicle Market by Mobility Type

        • Wheeled
        • Tracked
        • Hybrid
      • ARGENTINA Armored Vehicle Market by Armor Type

        • Composite Armor
        • Ceramic Armor
        • Steel Armor
        • Spall Liner
      • REST OF SOUTH AMERICA Outlook (USD Billion, 2019-2035)
      • REST OF SOUTH AMERICA Armored Vehicle Market by Application Type

        • Military
        • Law Enforcement
        • Civil Defense
        • Private Security
        • Emergency Services
      • REST OF SOUTH AMERICA Armored Vehicle Market by Vehicle Type

        • Personnel Carriers
        • Main Battle Tanks
        • Armored Personnel Carriers
        • Mine-Resistant Ambush Protected Vehicles
        • Light Tactical Vehicles
      • REST OF SOUTH AMERICA Armored Vehicle Market by Mobility Type

        • Wheeled
        • Tracked
        • Hybrid
      • REST OF SOUTH AMERICA Armored Vehicle Market by Armor Type

        • Composite Armor
        • Ceramic Armor
        • Steel Armor
        • Spall Liner
    • MEA Outlook (USD Billion, 2019-2035)

      • MEA Armored Vehicle Market by Application Type

        • Military
        • Law Enforcement
        • Civil Defense
        • Private Security
        • Emergency Services
      • MEA Armored Vehicle Market by Vehicle Type

        • Personnel Carriers
        • Main Battle Tanks
        • Armored Personnel Carriers
        • Mine-Resistant Ambush Protected Vehicles
        • Light Tactical Vehicles
      • MEA Armored Vehicle Market by Mobility Type

        • Wheeled
        • Tracked
        • Hybrid
      • MEA Armored Vehicle Market by Armor Type

        • Composite Armor
        • Ceramic Armor
        • Steel Armor
        • Spall Liner
      • MEA Armored Vehicle Market by Regional Type

        • GCC Countries
        • South Africa
        • Rest of MEA
      • GCC COUNTRIES Outlook (USD Billion, 2019-2035)
      • GCC COUNTRIES Armored Vehicle Market by Application Type

        • Military
        • Law Enforcement
        • Civil Defense
        • Private Security
        • Emergency Services
      • GCC COUNTRIES Armored Vehicle Market by Vehicle Type

        • Personnel Carriers
        • Main Battle Tanks
        • Armored Personnel Carriers
        • Mine-Resistant Ambush Protected Vehicles
        • Light Tactical Vehicles
      • GCC COUNTRIES Armored Vehicle Market by Mobility Type

        • Wheeled
        • Tracked
        • Hybrid
      • GCC COUNTRIES Armored Vehicle Market by Armor Type

        • Composite Armor
        • Ceramic Armor
        • Steel Armor
        • Spall Liner
      • SOUTH AFRICA Outlook (USD Billion, 2019-2035)
      • SOUTH AFRICA Armored Vehicle Market by Application Type

        • Military
        • Law Enforcement
        • Civil Defense
        • Private Security
        • Emergency Services
      • SOUTH AFRICA Armored Vehicle Market by Vehicle Type

        • Personnel Carriers
        • Main Battle Tanks
        • Armored Personnel Carriers
        • Mine-Resistant Ambush Protected Vehicles
        • Light Tactical Vehicles
      • SOUTH AFRICA Armored Vehicle Market by Mobility Type

        • Wheeled
        • Tracked
        • Hybrid
      • SOUTH AFRICA Armored Vehicle Market by Armor Type

        • Composite Armor
        • Ceramic Armor
        • Steel Armor
        • Spall Liner
      • REST OF MEA Outlook (USD Billion, 2019-2035)
      • REST OF MEA Armored Vehicle Market by Application Type

        • Military
        • Law Enforcement
        • Civil Defense
        • Private Security
        • Emergency Services
      • REST OF MEA Armored Vehicle Market by Vehicle Type

        • Personnel Carriers
        • Main Battle Tanks
        • Armored Personnel Carriers
        • Mine-Resistant Ambush Protected Vehicles
        • Light Tactical Vehicles
      • REST OF MEA Armored Vehicle Market by Mobility Type

        • Wheeled
        • Tracked
        • Hybrid
      • REST OF MEA Armored Vehicle Market by Armor Type

        • Composite Armor
        • Ceramic Armor
        • Steel Armor
        • Spall Liner


    Infographic

    Free Sample Request

    Kindly complete the form below to receive a free sample of this Report

    Get Free Sample

    Customer Strories

    “I am very pleased with how market segments have been defined in a relevant way for my purposes (such as "Portable Freezers & refrigerators" and "last-mile"). In general the report is well structured. Thanks very much for your efforts.”

    Victoria Milne

    Founder
    Case Study
    Chemicals and Materials