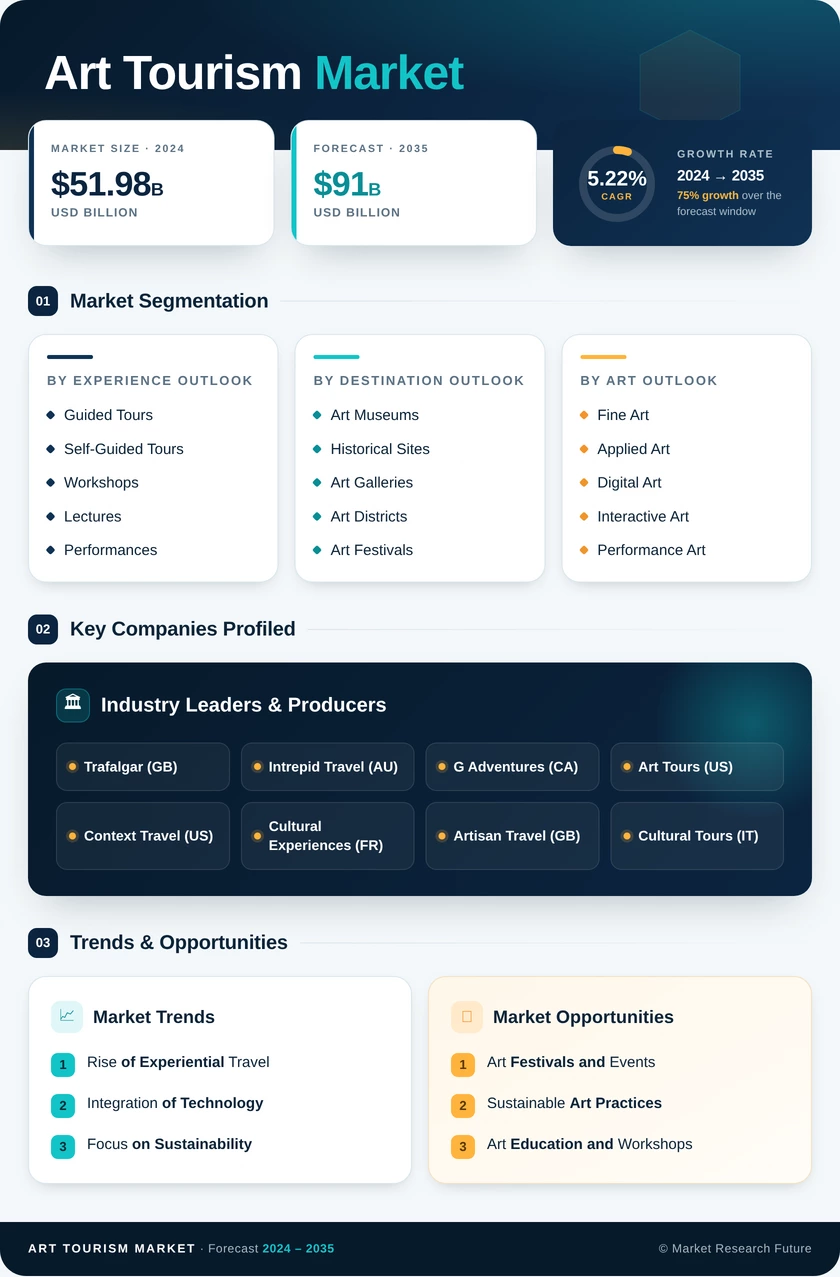
Art Tourism Market (2026 - 2035)

art tourism Market Size, Share, Industry Trend & Analysis Research Report By Type of Art (Fine Art, Applied Art, Digital Art, Interactive Art, Performance Art), By Travel Motivation (Cultural Appreciation, Art Collection, Art Education, Historical Exploration, Social Connection), By Destination (Art Museums, Historical Sites, Art Galleries, Art Districts, Art Festivals), By Experience (Guided Tours, Self-Guided Tours, Workshops, Lectures, Performances), By Target Audience (Art Enthusiasts, Collectors, Students, Travelers, Families) andBy Region (North America, Europe, South America, Asia Pacific, Middle East and Africa)- Forecast to 2035

Forecast Period
2026-2035
CAGR
3.19%
2025 Market Size
USD 50.24 Billion
2035 Market Size
USD 68.64 Billion
Consumer and Retail ● Updated August 2026 Report ID: MRFR/CG/24692-HCR | Pages: 128 | Author: Pradeep Nandi
  1. 1 Market Overview |
    1. 1.1 Study Assumptions & Market Definition |
    2. 1.2 Scope of the Study |
    3. 1.3 Research Methodology
  2. 2 Market Summary & Key Report Takeaways |
    1. 2.1 By Art Format |
    2. 2.2 By Traveller Type and Booking Channel |
    3. 2.3 By Geography
  3. 3 Global Market Size & Forecast (2021–2035) |
    1. 3.1 Historical Market Size (2021–2025) |
    2. 3.2 Current & Forecast Market Size (2026–2035) |
    3. 3.3 Year-over-Year Growth Analysis
  4. 4 Market Drivers Analysis |
    1. 4.1 Experience-Led Discretionary Spending |
    2. 4.2 Public Cultural Funding and Fiscal Incentives |
    3. 4.3 Mixed-Reality and Projection Technology |
    4. 4.4 Platform-Based Distribution
  5. 5 Market Restraints Analysis |
    1. 5.1 Travel Cost Inflation |
    2. 5.2 Access Caps and Overtourism Policy |
    3. 5.3 Carbon-Conscious Travel Behaviour
  6. 6 Market Opportunity Analysis |
    1. 6.1 Secondary-City Cultural Circuits |
    2. 6.2 Data Monetisation and Membership Economics |
    3. 6.3 Emerging-Market Institutional Buildout |
    4. 6.4 Licensed Immersive Formats |
    5. 6.5 Corporate and Incentive Travel Integration |
    6. 6.6 Industry Value Chain Analysis |
    7. 6.7 Porter's Five Forces Analysis
  7. 7 Regional Analysis |
    1. 7.1 North America | |
      1. 7.1.1 US | |
      2. 7.1.2 Canada | |
      3. 7.1.3 Mexico |
    2. 7.2 Europe | |
      1. 7.2.1 Germany | |
      2. 7.2.2 UK | |
      3. 7.2.3 France | |
      4. 7.2.4 Italy | |
      5. 7.2.5 Spain | |
      6. 7.2.6 Nordic Countries | |
      7. 7.2.7 Russia | |
      8. 7.2.8 Rest of Europe |
    3. 7.3 Asia-Pacific | |
      1. 7.3.1 China | |
      2. 7.3.2 India | |
      3. 7.3.3 Japan | |
      4. 7.3.4 South Korea | |
      5. 7.3.5 ASEAN | |
      6. 7.3.6 Rest of Asia-Pacific |
    4. 7.4 South America | |
      1. 7.4.1 Brazil | |
      2. 7.4.2 Argentina | |
      3. 7.4.3 Rest of South America |
    5. 7.5 Middle East & Africa | |
      1. 7.5.1 Saudi Arabia | |
      2. 7.5.2 UAE | |
      3. 7.5.3 South Africa | |
      4. 7.5.4 Egypt | |
      5. 7.5.5 Rest of Middle East & Africa
  8. 8 Future Outlook (2026–2035) |
    1. 8.1 AI-Assisted Curation and Personalisation |
    2. 8.2 Platform Economics and Channel Rebalancing |
    3. 8.3 The Permanent Immersive Venue Category |
    4. 8.4 Sustainability Reporting and Low-Carbon Programming
  9. 9 Segmentation Analysis |
    1. 9.1 By Art Format | |
      1. 9.1.1 Museums and Galleries | |
      2. 9.1.2 Immersive Digital Art Experiences | |
      3. 9.1.3 Art Festivals and Biennials | |
      4. 9.1.4 Street Art and Public Art Trails | |
      5. 9.1.5 Virtual and VR Art Tours | |
      6. 9.1.6 Artist Studios and Residencies |
    2. 9.2 By Traveller Type | |
      1. 9.2.1 Purposeful Art Tourists | |
      2. 9.2.2 Sightseeing Cultural Tourists | |
      3. 9.2.3 Incidental Art Tourists | |
      4. 9.2.4 Casual Art Tourists |
    3. 9.3 By Booking Channel | |
      1. 9.3.1 Online OTAs and Experience Platforms | |
      2. 9.3.2 Direct-To-Attraction | |
      3. 9.3.3 Travel Agents and Tour Operators | |
      4. 9.3.4 Mobile-App Self-Guided
  10. 10 Competitive Landscape |
    1. 10.1 Market Share Analysis (2026) |
    2. 10.2 Competitive Benchmarking Matrix |
    3. 10.3 Company Profiles | |
      1. 10.3.1 GetYourGuide | |
      2. 10.3.2 Viator (Tripadvisor) | |
      3. 10.3.3 Klook | |
      4. 10.3.4 Fever Labs | |
      5. 10.3.5 TeamLab | |
      6. 10.3.6 Tiqets | |
      7. 10.3.7 Musement (TUI) | |
      8. 10.3.8 Context Travel | |
      9. 10.3.9 Atlas Obscura | |
      10. 10.3.10 Smartify
  11. 11 Recent Developments & News
  12. 12 Report Scope & Methodology |
    1. 12.1 Study Period & Base Year |
    2. 12.2 Data Sources & Citations |
    3. 12.3 Abbreviations
  13. 13 Detailed Sources and Citations
  14. 14 Frequently Asked Questions
  15. 15 LIST OF TABLES |
  16. TABLE 1 Global Art Tourism Market Size & Forecast, by Revenue (USD Billion), 2021–2035 |
  17. TABLE 2 Global Art Tourism Market – Year-over-Year Growth Analysis, 2021–2035 |
  18. TABLE 3 Driver Impact Analysis – Global Art Tourism Market, 2026–2035 |
  19. TABLE 4 Restraint Impact Analysis – Global Art Tourism Market, 2026–2035 |
  20. TABLE 5 Global Art Tourism Market Size, by Region, 2021–2035 (USD Billion) |
  21. TABLE 6 North America Art Tourism Market Size, by Country, 2021–2035 (USD Billion) |
  22. TABLE 7 Europe Art Tourism Market Size, by Country, 2021–2035 (USD Billion) |
  23. TABLE 8 Asia-Pacific Art Tourism Market Size, by Country, 2021–2035 (USD Billion) |
  24. TABLE 9 South America Art Tourism Market Size, by Country, 2021–2035 (USD Billion) |
  25. TABLE 10 Middle East & Africa Art Tourism Market Size, by Country, 2021–2035 (USD Billion) |
  26. TABLE 11 Global Art Tourism Market Size, by Art Format, 2021–2035 (USD Billion) |
  27. TABLE 12 Global Art Tourism Market Size, by Traveller Type, 2021–2035 (USD Billion) |
  28. TABLE 13 Global Art Tourism Market Size, by Booking Channel, 2021–2035 (USD Billion) |
  29. TABLE 14 North America Art Tourism Market Size, by Art Format, 2021–2035 (USD Billion) |
  30. TABLE 15 Europe Art Tourism Market Size, by Art Format, 2021–2035 (USD Billion) |
  31. TABLE 16 Asia-Pacific Art Tourism Market Size, by Art Format, 2021–2035 (USD Billion) |
  32. TABLE 17 South America Art Tourism Market Size, by Traveller Type, 2021–2035 (USD Billion) |
  33. TABLE 18 Middle East & Africa Art Tourism Market Size, by Booking Channel, 2021–2035 (USD Billion) |
  34. TABLE 19 Competitive Benchmarking Matrix – Global Art Tourism Market, 2026 |
  35. TABLE 20 Company Profiles – Key Players, Global Art Tourism Market |
  36. TABLE 21 Recent Developments & Strategic Announcements, 2023–2025 |
  37. TABLE 22 Report Scope & Methodology Summary |
  38. TABLE 23 Detailed Sources and Citations Index
  39. 16 LIST OF FIGURES |
  40. FIGURE 1 Global Art Tourism Market – Market Dynamics Overview (Drivers, Restraints, Opportunities) |
  41. FIGURE 2 Industry Value Chain Analysis – Art Tourism Ecosystem |
  42. FIGURE 3 Porter's Five Forces Analysis – Global Art Tourism Market, 2026 |
  43. FIGURE 4 Global Art Tourism Market Size Trend, 2021–2035 (USD Billion) |
  44. FIGURE 5 Year-over-Year Growth Trend, 2022–2035 (%) |
  45. FIGURE 6 Market Share by Art Format, 2025 vs 2035 (%) |
  46. FIGURE 7 Market Share by Traveller Type, 2025 (%) |
  47. FIGURE 8 Market Share by Booking Channel, 2025 vs 2035 (%) |
  48. FIGURE 9 Regional Revenue Share Distribution, 2025 (%) |
  49. FIGURE 10 Regional CAGR Comparison, 2026–2035 (%) |
  50. FIGURE 11 Country-Level Revenue Contribution – Top 10 Markets, 2025 |
  51. FIGURE 12 Competitive Landscape – Estimated Revenue Share Bands, 2026 |
  52. FIGURE 13 Strategic Positioning Matrix – Key Players |
  53. FIGURE 14 Technology Adoption Curve – Immersive and Virtual Formats, 2021–2035
Share::
Request Free Sample

Segmentation Quick Reference

DimensionSub-SegmentsDominant SegmentFastest Growing Segment
By Art FormatMuseums and Galleries; Immersive Digital Art Experiences; Art Festivals and Biennials; Street Art and Public Art Trails; Virtual and VR Art Tours; Artist Studios and ResidenciesMuseums and GalleriesVirtual and VR Art Tours
By Traveller TypePurposeful Art Tourists; Sightseeing Cultural Tourists; Incidental Art Tourists; Casual Art TouristsSightseeing Cultural TouristsPurposeful Art Tourists
By Booking ChannelOnline OTAs and Experience Platforms; Direct-To-Attraction; Travel Agents and Tour Operators; Mobile-App Self-GuidedOnline OTAs and Experience PlatformsMobile-App Self-Guided
By GeographyNorth America; Europe; Asia-Pacific; South America; Middle East & AfricaEuropeAsia-Pacific


Market Segmentation Overview

By Art Format

Sub-SegmentKey Trend
Museums and GalleriesTimed-entry systems and yield-led pricing replace volume growth
Immersive Digital Art ExperiencesPurpose-built permanent venues attract institutional real estate capital
Art Festivals and BiennialsCalendar expansion into secondary cities extends the touring circuit
Street Art and Public Art TrailsMunicipal wayfinding apps convert free assets into measurable footfall
Virtual and VR Art ToursHeadset cost declines widen at-home and in-venue hybrid access
Artist Studios and ResidenciesSmall-group authenticity demand supports premium per-head pricing


Format economics diverge sharply. Collection-based venues compete on irreplaceable assets and constrained capacity, while digitally native formats compete on programming velocity and location flexibility — two entirely different capital models operating under one demand umbrella.

By Traveller Type

Sub-SegmentKey Trend
Purposeful Art TouristsExhibition calendars increasingly dictate trip timing and length of stay
Sightseeing Cultural TouristsBundled city passes drive attachment across multiple venues
Incidental Art TouristsWeather-substitution and layover visits sustain baseline admissions
Casual Art TouristsFamily and social programming lifts weekend and evening utilisation


Traveller intensity, not headcount, determines revenue quality. Institutions increasingly segment marketing spend by intent signal rather than nationality or age, which has improved conversion on high-value membership products.

By Booking Channel

Sub-SegmentKey Trend
Online OTAs and Experience PlatformsCommission pressure prompts consortium-based direct alternatives
Direct-To-AttractionCRM and membership investment lifts lifetime value per visitor
Travel Agents and Tour OperatorsCruise and group volume delivers scale at discounted per-head yield
Mobile-App Self-GuidedMultilingual audio and AR layers replace hardware guide rentals


Channel mix now decides margin as much as ticket price does. The venues improving profitability fastest are those converting first-time platform bookings into owned, repeatable membership relationships.




Share::
Request Free Sample
Download PDF ×

We do not share your information with anyone. However, we may send you emails based on your report interest from time to time. You may contact us at any time to opt-out.