×
  • Cat-intel
  • MedIntelliX
  • Resources
  • About Us
  • Hero Background
    English
    Chinese
    French
    Japanese
    Korean
    German
    Spanish

    ASEAN energy transition market Size

    ID: MRFR/EnP/14672-HCR
    128 Pages
    Garvit Vyas
    October 2025

    ASEAN Energy Transition Market Research Report Information By Type (Renewable Energy, Energy Efficient, Electrification, Hydrogen, and Other), By Application (Residential, Commercial, and Utility-Scale)–and ASEAN Market Forecast Till 2035

    Share:
    Download PDF ×

    We do not share your information with anyone. However, we may send you emails based on your report interest from time to time. You may contact us at any time to opt-out.

    ASEAN energy transition market Infographic
    Purchase Options

    Asean Energy Transition Size

    ASEAN energy transition market Growth Projections and Opportunities

    The dynamics of the ASEAN energy transition market are determined by several factors that act cumulatively on this market within Southeast Asia. One of the main factors motivated by increasing emphasis on clean and sustainable energy solutions that form global consensus to fight climate change. The demographics of the market are directly linked to how goods and services within this region try moving away from reliant on fossil fuel toward low-carbon renewable energy. Policies and initiatives to fasten the energy transition are adopted by governments of ASEAN countries motivated for achieving sustainability purposes such as ensuring consistent supplies, preserving environmental factors in addition economic development. The factors that drive the ASEAN energy transition market and are hugely impacted by technological advancements in renewable energy technologies. New and historical developments in solar, wind, hydroelectricity among other renewable energy technologies advance the modern trends of region’s power industry. The factors are driven by the constant improvement that is done on renewable machines and systems with an objective of increasing efficiency, affordability as well as integration for a seamless transformation from conventional to sustainable sources. Government policies and regulatory frameworks are most essential in creating dynamics of the market for ASEAN energy transition. This is propagated by the development of renewable energy targets, feed-in tariffs, and incentives along with investor friendly regulatory support. An enabling environment for the renewable energy development is being established through a conducive atmosphere that attracts investments and builds joint ventures with private sector to effectively work towards achieving the goals of transition. Environmental issues and climate change also form part of the market drivers that are associated with ASEAN’s energy transition. As such, it is one of the most susceptible parts to climate change effects in terms high sea levels, storms among others. The dynamics are driven by the critical urge to minimize greenhouse gas emissions and curtail pollution as far as energy occurs. Renewable energy adoption contributes essential in solving this environmental threat and ensuring a sustainable future for every country that is part of the ASEAN. This is because costly investments in clean energy infrastructure and projects have significant effects on the market dynamics of ASEAN energy transition. The activity centers also vary by government, utility, and private investor decisions on allocating capital for renewable energy facilities, grid storage systems as well as smart power grids. The investments in the decentralized energy solutions, which include off-grid and mini grid systems have an influence on the total dynamics of market for transitioning to new forms or sources of energies. The market dynamics in the ASEAN energy transition are affected by energy security as well as diversifying sources of this form These dynamics are guided by the region’s mission to become less dependent on imported fossil fuels and promote energy resiliency through deployment of locally available renewable energy resources. The use of alternative types in the adoption of distributed energy systems, smart grids and energy storage technologies leads to more resilient as well as a secure deployment. There are global economic factors and geopolitical forces that drive the market dynamics of ASEAN energy transition. These dynamics are influenced by international alliances, partnerships, and investments in clean energy-related projects. The ASEAN region is increasingly serving as an epicenter for global clean energy investment and partnerships, commanding the principles of technology transfer dynamics in knowledge exchange collaborative efforts to fuel the revolution pace towards undergoing regional Energy Transition. Renewable energy sector competition and the fight among contemporary technology providers affect ASEAN market parameters of an energetic transition. These features comprise the dynamics of this market due to current business players, technological innovations and strategic alliances. Other factors that affect the market include collaborations and partnerships among ASEAN members, international organizations and private sector establishments which in their capacity affects competitiveness of energy transition projects within certain regions. In the ASEAN energy transition market, dynamic forces include technological developments; behavioral changes and government policies owing to environmental considerations as well investments aims related at improving energy security status of the region based on global economic conditions alongside competitive force within sector renewable energies. With ASEAN countries conducting their energy transition, the market is bound to change and present opportunities for sustainable development; economic growth, along with a cleaner and more adaptable energy system in an ever-changing interdependent Southeast Asian environment.
    ASEAN energy transition market Size Graph
    Author
    Garvit Vyas
    Analyst

    Explore the profile of Garvit Vyas, one of our esteemed authors at Market Research Future, and access their expert research contributions in the field of market research and industry analysis

    Leave a Comment

    FAQs

    What is the projected market valuation of the ASEAN Energy Transition Market by 2035?

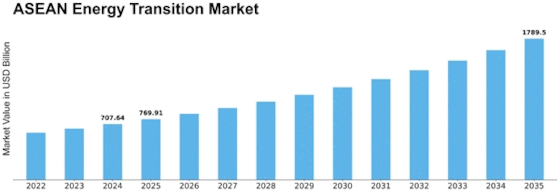
    <p>The projected market valuation for the ASEAN Energy Transition Market is 1789.5 USD Billion by 2035.</p>

    What was the overall market valuation of the ASEAN Energy Transition Market in 2024?

    <p>The overall market valuation of the ASEAN Energy Transition Market was 707.64 USD Billion in 2024.</p>

    What is the expected CAGR for the ASEAN Energy Transition Market during the forecast period 2025 - 2035?

    <p>The expected CAGR for the ASEAN Energy Transition Market during the forecast period 2025 - 2035 is 8.8%.</p>

    Which segments are included in the ASEAN Energy Transition Market, and what are their valuations?

    <p>The segments include Renewable Energy valued at 300.0 to 800.0 USD Billion, Energy Efficiency at 150.0 to 400.0 USD Billion, Electrification at 200.0 to 500.0 USD Billion, and Hydrogen at 57.64 to 89.5 USD Billion.</p>

    What are the application segments of the ASEAN Energy Transition Market and their respective valuations?

    <p>The application segments are Residential valued at 141.53 to 367.87 USD Billion, Commercial at 141.53 to 367.87 USD Billion, and Utility-Scale at 424.58 to 1053.76 USD Billion.</p>

    Market Summary

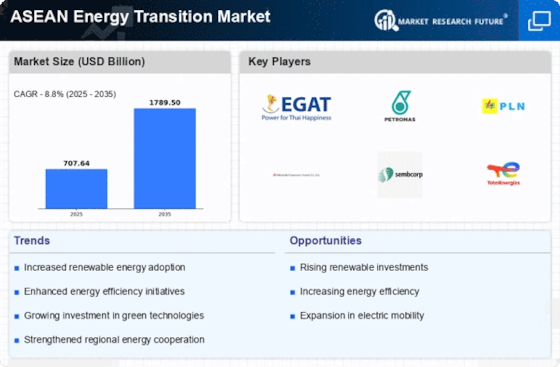
    As per MRFR analysis, the ASEAN Energy Transition Market Size was estimated at 707.64 USD Billion in 2024. The ASEAN Energy Transition industry is projected to grow from 769.91 USD Billion in 2025 to 1789.5 USD Billion by 2035, exhibiting a compound annual growth rate (CAGR) of 8.8 during the forecast period 2025 - 2035.

    Key Market Trends & Highlights

    The ASEAN Energy Transition Market is poised for substantial growth driven by renewable energy investments and technological advancements.

    • Investment in renewable energy continues to surge, reflecting a broader global trend observed in North America.
    • Regional collaboration on energy policies is enhancing the effectiveness of energy transition strategies across ASEAN nations.
    • The adoption of smart energy technologies is gaining momentum, particularly in the residential segment, which remains the largest market.
    • Government policies and incentives, alongside rising energy demand and urbanization, are key drivers propelling the growth of both renewable energy and hydrogen sectors.

    Market Size & Forecast

    2024 Market Size 707.64 (USD Billion)
    2035 Market Size 1789.5 (USD Billion)
    CAGR (2025 - 2035) 8.8%
    Largest Regional Market Share in 2024 Asia Pacific

    Major Players

    <p>Electricity Generating Authority of Thailand (TH), Petronas (MY), Singapore Power (SG), PT Perusahaan Listrik Negara (ID), Mitsubishi Corporation (JP), Sembcorp Industries (SG), TotalEnergies (FR), Enel Green Power (IT), First Gen Corporation (PH)</p>

    Market Trends

    The ASEAN Energy Transition Market is currently undergoing a transformative phase characterized by a shift towards sustainable energy sources. This transition is driven by a combination of governmental policies, technological advancements, and increasing public awareness regarding climate change. Countries within the ASEAN region are actively pursuing renewable energy projects, such as solar, wind, and hydropower, to reduce their reliance on fossil fuels. This movement not only aims to enhance energy security but also to foster economic growth through green jobs and innovation. Furthermore, regional cooperation among ASEAN nations appears to be strengthening, as they collaborate on energy efficiency initiatives and share best practices in renewable technologies. In addition to governmental efforts, private sector investment in the ASEAN Energy Transition Market is gaining momentum. Corporations are increasingly recognizing the potential of clean energy solutions, leading to a surge in partnerships and joint ventures focused on renewable energy development. This trend suggests a growing alignment between corporate sustainability goals and national energy policies. As the market evolves, it is likely that the integration of smart technologies and digital solutions will play a crucial role in optimizing energy consumption and distribution, thereby enhancing the overall efficiency of the energy system in the region.

    Increased Investment in Renewable Energy

    There is a noticeable rise in investments directed towards renewable energy projects across the ASEAN region. This trend indicates a collective commitment to transitioning from traditional energy sources to more sustainable alternatives, driven by both public and private sectors.

    Regional Collaboration on Energy Policies

    ASEAN nations are increasingly engaging in collaborative efforts to harmonize energy policies and regulations. This cooperation aims to facilitate the sharing of resources and knowledge, ultimately enhancing the effectiveness of energy transition strategies across member states.

    Adoption of Smart Energy Technologies

    The integration of smart technologies into the energy sector is becoming more prevalent. This trend suggests that digital solutions, such as smart grids and energy management systems, are likely to optimize energy efficiency and improve the reliability of energy supply in the ASEAN Energy Transition Market.

    ASEAN energy transition market Market Drivers

    Government Policies and Incentives

    The ASEAN Energy Transition Market is significantly influenced by government policies and incentives aimed at promoting renewable energy adoption. Various ASEAN nations have implemented feed-in tariffs, tax breaks, and subsidies to encourage investments in clean energy technologies. For instance, countries like Indonesia and Vietnam have established ambitious renewable energy targets, aiming for 23% and 20% of their energy mix from renewables by 2025, respectively. These policies not only stimulate local investments but also attract foreign direct investment, thereby enhancing the overall market landscape. The commitment of governments to reduce carbon emissions and transition towards sustainable energy sources is likely to drive growth in the ASEAN Energy Transition Market.

    Rising Energy Demand and Urbanization

    The rapid urbanization and rising energy demand in ASEAN countries are driving the need for a transition to sustainable energy solutions. As urban populations grow, the demand for electricity is expected to increase significantly, with projections indicating a rise of 6% annually in energy consumption across the region. This surge in demand necessitates a shift from traditional fossil fuels to renewable energy sources to ensure energy security and sustainability. The ASEAN Energy Transition Market is likely to benefit from this trend, as governments and private sectors seek to develop infrastructure that supports renewable energy generation and distribution. The interplay between urbanization and energy demand presents both challenges and opportunities for the ASEAN Energy Transition Market.

    Investment in Infrastructure Development

    Investment in infrastructure development is a pivotal driver for the ASEAN Energy Transition Market. The region is experiencing a wave of infrastructure projects aimed at enhancing energy generation and distribution capabilities. Governments are prioritizing investments in renewable energy facilities, smart grids, and transmission networks to accommodate the growing share of renewables in their energy mix. For example, the Asian Development Bank has committed substantial funding to support renewable energy projects across ASEAN nations. This influx of capital is expected to facilitate the construction of new energy facilities and the modernization of existing infrastructure, thereby bolstering the ASEAN Energy Transition Market. The focus on infrastructure development is likely to create a more resilient and efficient energy system in the region.

    Technological Advancements in Energy Storage

    Technological advancements in energy storage solutions are poised to play a crucial role in the ASEAN Energy Transition Market. Innovations in battery technologies, such as lithium-ion and solid-state batteries, are enhancing the efficiency and reliability of renewable energy systems. The region is witnessing a surge in energy storage projects, with countries like Thailand and Malaysia investing in large-scale battery storage systems to stabilize their grids. According to recent data, the energy storage market in ASEAN is projected to grow at a compound annual growth rate of over 20% in the coming years. This growth indicates a strong potential for energy storage technologies to support the integration of renewable energy sources, thereby facilitating a smoother transition in the ASEAN Energy Transition Market.

    Public Awareness and Consumer Demand for Sustainability

    Public awareness regarding climate change and the demand for sustainable energy solutions are increasingly shaping the ASEAN Energy Transition Market. As consumers become more environmentally conscious, there is a growing preference for renewable energy sources. Surveys indicate that a significant percentage of the population in ASEAN countries is willing to pay a premium for green energy options. This shift in consumer behavior is prompting energy providers to diversify their offerings and invest in renewable energy projects. The rise in demand for sustainable energy solutions is likely to encourage innovation and competition within the ASEAN Energy Transition Market, ultimately leading to a more sustainable energy landscape.

    Market Segment Insights

    By Type: Renewable Energy (Largest) vs. Hydrogen (Fastest-Growing)

    <p>In the ASEAN Energy Transition Market, Renewable Energy holds the largest share, being the cornerstone of the region's energy strategy. This segment has seen consistent investments, driven by both governmental policies and increasing public demand for sustainable energy sources. Meanwhile, Hydrogen is rapidly emerging, positioned as a solution to decarbonize hard-to-abate sectors, with increasing interest from both public and private sectors aiming to leverage its potential.</p>

    <p>Energy Efficiency (Dominant) vs. Electrification (Emerging)</p>

    <p>Energy Efficiency has established itself as a dominant force within the ASEAN Energy Transition Market, characterized by significant advancements in technology and widespread governmental support. Technologies such as smart grids and energy-efficient systems have led to a substantial reduction in energy consumption across various sectors. Conversely, Electrification is gaining prominence as an emerging trend, driven by the shift towards electric vehicles and broad electrification policies. This segment is rapidly evolving, with increasing infrastructure development and investments aimed at transitioning towards a more electrified future, which aligns with the region's goals of sustainability and carbon neutrality.</p>

    By Application: Residential (Largest) vs. Commercial (Fastest-Growing)

    <p>In the ASEAN Energy Transition Market, the application segment is witnessing a dynamic distribution of market share, with the residential sector emerging as the largest contributor. The increasing focus on energy efficiency and renewable sources within households is driving significant investments and technologies tailored to meet evolving consumer expectations. On the other hand, the commercial sector is quickly catching up, reflecting a robust interest in implementing sustainable practices, which is reshaping business operations across various industries.</p>

    <p>Residential (Dominant) vs. Utility-Scale (Emerging)</p>

    <p>The residential application segment holds a dominant position in the ASEAN Energy Transition Market, characterized by a growing emphasis on energy efficiency, renewable energy adoption, and innovative energy management solutions tailored for homes. This segment caters to consumers who prioritize sustainable living, driving demand for solar power installations, energy storage systems, and smart home technologies. In juxtaposition, the utility-scale application is emerging with significant potential due to the scale and impact of large-scale energy projects. This segment benefits from government incentives and an increased focus on grid stability and renewable integration, appealing to large energy producers aiming to contribute to the region's energy transition.</p>

    Get more detailed insights about ASEAN Energy Transition Market Research Report – Forecast till 2035

    Regional Insights

    Key Players and Competitive Insights

    Leading market players are investing heavily in research and development to expand their product lines, which will help the energy transition market grow even more. Market participants are also undertaking various strategic activities to expand their footprint, with important market developments including new product launches, contractual agreements, mergers and acquisitions, higher investments, and collaboration with other organizations. To expand and survive in a more competitive and rising market climate, the energy transition industry must offer cost-effective items.

    Major players in the energy transition market are attempting to increase market demand by investing in research and development operations, including Exelon Corporation, Duke Energy Corporation, Pacific Gas and Electric Company, Southern Company, American Electric Power, Inc., Edison International, Repsol, Brookfield Renewable Partners, Ørsted A/S, and NextEra Energy, Inc.

    Key Companies in the ASEAN energy transition market market include

    Industry Developments

    • Q2 2025: What happened at the Energy Transition Meeting in ASEAN On May 26, 2025, the World Economic Forum and Malaysia Centre for the Fourth Industrial Revolution co-hosted the ASEAN Energy Transition Meeting, bringing together 200 high-level leaders to discuss actionable solutions for accelerating the region’s energy transition, including industrial decarbonization, innovative financing, and regional integration.
    • Q2 2025: New Tool Tracks ASEAN Countries' Ambitions on Energy ... At ACES 2024, Singapore’s Minister for Manpower and Second Minister for Trade and Industry, Dr. Tan See Leng, announced the launch of DigiLeap, a digital platform developed by SEAS to foster knowledge-sharing, networking, and innovation in Southeast Asia’s clean energy ecosystem.

    Future Outlook

    ASEAN energy transition market Future Outlook

    <p>The ASEAN Energy Transition Market is projected to grow at an 8.8% CAGR from 2024 to 2035, driven by renewable energy adoption, regulatory support, and technological advancements.</p>

    New opportunities lie in:

    • <p>Investment in smart grid technologies for enhanced energy management.</p>
    • <p>Development of localized renewable energy projects to meet regional demands.</p>
    • <p>Expansion of electric vehicle infrastructure to support growing market needs.</p>

    <p>By 2035, the ASEAN Energy Transition Market is expected to be robust and dynamic.</p>

    Market Segmentation

    ASEAN energy transition market Type Outlook

    • Renewable Energy
    • Energy Efficiency
    • Electrification
    • Hydrogen

    ASEAN energy transition market Application Outlook

    • Residential
    • Commercial
    • Utility-Scale

    Report Scope

    MARKET SIZE 2024707.64(USD Billion)
    MARKET SIZE 2025769.91(USD Billion)
    MARKET SIZE 20351789.5(USD Billion)
    COMPOUND ANNUAL GROWTH RATE (CAGR)8.8% (2024 - 2035)
    REPORT COVERAGERevenue Forecast, Competitive Landscape, Growth Factors, and Trends
    BASE YEAR2024
    Market Forecast Period2025 - 2035
    Historical Data2019 - 2024
    Market Forecast UnitsUSD Billion
    Key Companies ProfiledMarket analysis in progress
    Segments CoveredMarket segmentation analysis in progress
    Key Market OpportunitiesIntegration of renewable energy sources into national grids enhances energy security in the ASEAN Energy Transition Market.
    Key Market DynamicsAccelerating investments in renewable energy technologies drive competitive dynamics within the ASEAN Energy Transition Market.
    Countries CoveredNorth America, Europe, APAC, South America, MEA

    FAQs

    What is the projected market valuation of the ASEAN Energy Transition Market by 2035?

    <p>The projected market valuation for the ASEAN Energy Transition Market is 1789.5 USD Billion by 2035.</p>

    What was the overall market valuation of the ASEAN Energy Transition Market in 2024?

    <p>The overall market valuation of the ASEAN Energy Transition Market was 707.64 USD Billion in 2024.</p>

    What is the expected CAGR for the ASEAN Energy Transition Market during the forecast period 2025 - 2035?

    <p>The expected CAGR for the ASEAN Energy Transition Market during the forecast period 2025 - 2035 is 8.8%.</p>

    Which segments are included in the ASEAN Energy Transition Market, and what are their valuations?

    <p>The segments include Renewable Energy valued at 300.0 to 800.0 USD Billion, Energy Efficiency at 150.0 to 400.0 USD Billion, Electrification at 200.0 to 500.0 USD Billion, and Hydrogen at 57.64 to 89.5 USD Billion.</p>

    What are the application segments of the ASEAN Energy Transition Market and their respective valuations?

    <p>The application segments are Residential valued at 141.53 to 367.87 USD Billion, Commercial at 141.53 to 367.87 USD Billion, and Utility-Scale at 424.58 to 1053.76 USD Billion.</p>

    1. SECTION I: EXECUTIVE SUMMARY AND KEY HIGHLIGHTS
      1. | 1.1 EXECUTIVE SUMMARY
      2. | | 1.1.1 Market Overview
      3. | | 1.1.2 Key Findings
      4. | | 1.1.3 Market Segmentation
      5. | | 1.1.4 Competitive Landscape
      6. | | 1.1.5 Challenges and Opportunities
      7. | | 1.1.6 Future Outlook
    2. SECTION II: SCOPING, METHODOLOGY AND MARKET STRUCTURE
      1. | 2.1 MARKET INTRODUCTION
      2. | | 2.1.1 Definition
      3. | | 2.1.2 Scope of the study
      4. | | | 2.1.2.1 Research Objective
      5. | | | 2.1.2.2 Assumption
      6. | | | 2.1.2.3 Limitations
      7. | 2.2 RESEARCH METHODOLOGY
      8. | | 2.2.1 Overview
      9. | | 2.2.2 Data Mining
      10. | | 2.2.3 Secondary Research
      11. | | 2.2.4 Primary Research
      12. | | | 2.2.4.1 Primary Interviews and Information Gathering Process
      13. | | | 2.2.4.2 Breakdown of Primary Respondents
      14. | | 2.2.5 Forecasting Model
      15. | | 2.2.6 Market Size Estimation
      16. | | | 2.2.6.1 Bottom-Up Approach
      17. | | | 2.2.6.2 Top-Down Approach
      18. | | 2.2.7 Data Triangulation
      19. | | 2.2.8 Validation
    3. SECTION III: QUALITATIVE ANALYSIS
      1. | 3.1 MARKET DYNAMICS
      2. | | 3.1.1 Overview
      3. | | 3.1.2 Drivers
      4. | | 3.1.3 Restraints
      5. | | 3.1.4 Opportunities
      6. | 3.2 MARKET FACTOR ANALYSIS
      7. | | 3.2.1 Value chain Analysis
      8. | | 3.2.2 Porter's Five Forces Analysis
      9. | | | 3.2.2.1 Bargaining Power of Suppliers
      10. | | | 3.2.2.2 Bargaining Power of Buyers
      11. | | | 3.2.2.3 Threat of New Entrants
      12. | | | 3.2.2.4 Threat of Substitutes
      13. | | | 3.2.2.5 Intensity of Rivalry
      14. | | 3.2.3 COVID-19 Impact Analysis
      15. | | | 3.2.3.1 Market Impact Analysis
      16. | | | 3.2.3.2 Regional Impact
      17. | | | 3.2.3.3 Opportunity and Threat Analysis
    4. SECTION IV: QUANTITATIVE ANALYSIS
      1. | 4.1 Energy & Power, BY Type (USD Billion)
      2. | | 4.1.1 Renewable Energy
      3. | | 4.1.2 Energy Efficiency
      4. | | 4.1.3 Electrification
      5. | | 4.1.4 Hydrogen
      6. | 4.2 Energy & Power, BY Application (USD Billion)
      7. | | 4.2.1 Residential
      8. | | 4.2.2 Commercial
      9. | | 4.2.3 Utility-Scale
      10. | 4.3 Energy & Power, BY Region (USD Billion)
      11. | | 4.3.1 North America
      12. | | | 4.3.1.1 US
      13. | | | 4.3.1.2 Canada
      14. | | 4.3.2 Europe
      15. | | | 4.3.2.1 Germany
      16. | | | 4.3.2.2 UK
      17. | | | 4.3.2.3 France
      18. | | | 4.3.2.4 Russia
      19. | | | 4.3.2.5 Italy
      20. | | | 4.3.2.6 Spain
      21. | | | 4.3.2.7 Rest of Europe
      22. | | 4.3.3 APAC
      23. | | | 4.3.3.1 China
      24. | | | 4.3.3.2 India
      25. | | | 4.3.3.3 Japan
      26. | | | 4.3.3.4 South Korea
      27. | | | 4.3.3.5 Malaysia
      28. | | | 4.3.3.6 Thailand
      29. | | | 4.3.3.7 Indonesia
      30. | | | 4.3.3.8 Rest of APAC
      31. | | 4.3.4 South America
      32. | | | 4.3.4.1 Brazil
      33. | | | 4.3.4.2 Mexico
      34. | | | 4.3.4.3 Argentina
      35. | | | 4.3.4.4 Rest of South America
      36. | | 4.3.5 MEA
      37. | | | 4.3.5.1 GCC Countries
      38. | | | 4.3.5.2 South Africa
      39. | | | 4.3.5.3 Rest of MEA
    5. SECTION V: COMPETITIVE ANALYSIS
      1. | 5.1 Competitive Landscape
      2. | | 5.1.1 Overview
      3. | | 5.1.2 Competitive Analysis
      4. | | 5.1.3 Market share Analysis
      5. | | 5.1.4 Major Growth Strategy in the Energy & Power
      6. | | 5.1.5 Competitive Benchmarking
      7. | | 5.1.6 Leading Players in Terms of Number of Developments in the Energy & Power
      8. | | 5.1.7 Key developments and growth strategies
      9. | | | 5.1.7.1 New Product Launch/Service Deployment
      10. | | | 5.1.7.2 Merger & Acquisitions
      11. | | | 5.1.7.3 Joint Ventures
      12. | | 5.1.8 Major Players Financial Matrix
      13. | | | 5.1.8.1 Sales and Operating Income
      14. | | | 5.1.8.2 Major Players R&D Expenditure. 2023
      15. | 5.2 Company Profiles
      16. | | 5.2.1 Electricity Generating Authority of Thailand (TH)
      17. | | | 5.2.1.1 Financial Overview
      18. | | | 5.2.1.2 Products Offered
      19. | | | 5.2.1.3 Key Developments
      20. | | | 5.2.1.4 SWOT Analysis
      21. | | | 5.2.1.5 Key Strategies
      22. | | 5.2.2 Petronas (MY)
      23. | | | 5.2.2.1 Financial Overview
      24. | | | 5.2.2.2 Products Offered
      25. | | | 5.2.2.3 Key Developments
      26. | | | 5.2.2.4 SWOT Analysis
      27. | | | 5.2.2.5 Key Strategies
      28. | | 5.2.3 Singapore Power (SG)
      29. | | | 5.2.3.1 Financial Overview
      30. | | | 5.2.3.2 Products Offered
      31. | | | 5.2.3.3 Key Developments
      32. | | | 5.2.3.4 SWOT Analysis
      33. | | | 5.2.3.5 Key Strategies
      34. | | 5.2.4 PT Perusahaan Listrik Negara (ID)
      35. | | | 5.2.4.1 Financial Overview
      36. | | | 5.2.4.2 Products Offered
      37. | | | 5.2.4.3 Key Developments
      38. | | | 5.2.4.4 SWOT Analysis
      39. | | | 5.2.4.5 Key Strategies
      40. | | 5.2.5 Mitsubishi Corporation (JP)
      41. | | | 5.2.5.1 Financial Overview
      42. | | | 5.2.5.2 Products Offered
      43. | | | 5.2.5.3 Key Developments
      44. | | | 5.2.5.4 SWOT Analysis
      45. | | | 5.2.5.5 Key Strategies
      46. | | 5.2.6 Sembcorp Industries (SG)
      47. | | | 5.2.6.1 Financial Overview
      48. | | | 5.2.6.2 Products Offered
      49. | | | 5.2.6.3 Key Developments
      50. | | | 5.2.6.4 SWOT Analysis
      51. | | | 5.2.6.5 Key Strategies
      52. | | 5.2.7 TotalEnergies (FR)
      53. | | | 5.2.7.1 Financial Overview
      54. | | | 5.2.7.2 Products Offered
      55. | | | 5.2.7.3 Key Developments
      56. | | | 5.2.7.4 SWOT Analysis
      57. | | | 5.2.7.5 Key Strategies
      58. | | 5.2.8 Enel Green Power (IT)
      59. | | | 5.2.8.1 Financial Overview
      60. | | | 5.2.8.2 Products Offered
      61. | | | 5.2.8.3 Key Developments
      62. | | | 5.2.8.4 SWOT Analysis
      63. | | | 5.2.8.5 Key Strategies
      64. | | 5.2.9 First Gen Corporation (PH)
      65. | | | 5.2.9.1 Financial Overview
      66. | | | 5.2.9.2 Products Offered
      67. | | | 5.2.9.3 Key Developments
      68. | | | 5.2.9.4 SWOT Analysis
      69. | | | 5.2.9.5 Key Strategies
      70. | 5.3 Appendix
      71. | | 5.3.1 References
      72. | | 5.3.2 Related Reports
    6. LIST OF FIGURES
      1. | 6.1 MARKET SYNOPSIS
      2. | 6.2 NORTH AMERICA MARKET ANALYSIS
      3. | 6.3 US MARKET ANALYSIS BY TYPE
      4. | 6.4 US MARKET ANALYSIS BY APPLICATION
      5. | 6.5 CANADA MARKET ANALYSIS BY TYPE
      6. | 6.6 CANADA MARKET ANALYSIS BY APPLICATION
      7. | 6.7 EUROPE MARKET ANALYSIS
      8. | 6.8 GERMANY MARKET ANALYSIS BY TYPE
      9. | 6.9 GERMANY MARKET ANALYSIS BY APPLICATION
      10. | 6.10 UK MARKET ANALYSIS BY TYPE
      11. | 6.11 UK MARKET ANALYSIS BY APPLICATION
      12. | 6.12 FRANCE MARKET ANALYSIS BY TYPE
      13. | 6.13 FRANCE MARKET ANALYSIS BY APPLICATION
      14. | 6.14 RUSSIA MARKET ANALYSIS BY TYPE
      15. | 6.15 RUSSIA MARKET ANALYSIS BY APPLICATION
      16. | 6.16 ITALY MARKET ANALYSIS BY TYPE
      17. | 6.17 ITALY MARKET ANALYSIS BY APPLICATION
      18. | 6.18 SPAIN MARKET ANALYSIS BY TYPE
      19. | 6.19 SPAIN MARKET ANALYSIS BY APPLICATION
      20. | 6.20 REST OF EUROPE MARKET ANALYSIS BY TYPE
      21. | 6.21 REST OF EUROPE MARKET ANALYSIS BY APPLICATION
      22. | 6.22 APAC MARKET ANALYSIS
      23. | 6.23 CHINA MARKET ANALYSIS BY TYPE
      24. | 6.24 CHINA MARKET ANALYSIS BY APPLICATION
      25. | 6.25 INDIA MARKET ANALYSIS BY TYPE
      26. | 6.26 INDIA MARKET ANALYSIS BY APPLICATION
      27. | 6.27 JAPAN MARKET ANALYSIS BY TYPE
      28. | 6.28 JAPAN MARKET ANALYSIS BY APPLICATION
      29. | 6.29 SOUTH KOREA MARKET ANALYSIS BY TYPE
      30. | 6.30 SOUTH KOREA MARKET ANALYSIS BY APPLICATION
      31. | 6.31 MALAYSIA MARKET ANALYSIS BY TYPE
      32. | 6.32 MALAYSIA MARKET ANALYSIS BY APPLICATION
      33. | 6.33 THAILAND MARKET ANALYSIS BY TYPE
      34. | 6.34 THAILAND MARKET ANALYSIS BY APPLICATION
      35. | 6.35 INDONESIA MARKET ANALYSIS BY TYPE
      36. | 6.36 INDONESIA MARKET ANALYSIS BY APPLICATION
      37. | 6.37 REST OF APAC MARKET ANALYSIS BY TYPE
      38. | 6.38 REST OF APAC MARKET ANALYSIS BY APPLICATION
      39. | 6.39 SOUTH AMERICA MARKET ANALYSIS
      40. | 6.40 BRAZIL MARKET ANALYSIS BY TYPE
      41. | 6.41 BRAZIL MARKET ANALYSIS BY APPLICATION
      42. | 6.42 MEXICO MARKET ANALYSIS BY TYPE
      43. | 6.43 MEXICO MARKET ANALYSIS BY APPLICATION
      44. | 6.44 ARGENTINA MARKET ANALYSIS BY TYPE
      45. | 6.45 ARGENTINA MARKET ANALYSIS BY APPLICATION
      46. | 6.46 REST OF SOUTH AMERICA MARKET ANALYSIS BY TYPE
      47. | 6.47 REST OF SOUTH AMERICA MARKET ANALYSIS BY APPLICATION
      48. | 6.48 MEA MARKET ANALYSIS
      49. | 6.49 GCC COUNTRIES MARKET ANALYSIS BY TYPE
      50. | 6.50 GCC COUNTRIES MARKET ANALYSIS BY APPLICATION
      51. | 6.51 SOUTH AFRICA MARKET ANALYSIS BY TYPE
      52. | 6.52 SOUTH AFRICA MARKET ANALYSIS BY APPLICATION
      53. | 6.53 REST OF MEA MARKET ANALYSIS BY TYPE
      54. | 6.54 REST OF MEA MARKET ANALYSIS BY APPLICATION
      55. | 6.55 KEY BUYING CRITERIA OF ENERGY & POWER
      56. | 6.56 RESEARCH PROCESS OF MRFR
      57. | 6.57 DRO ANALYSIS OF ENERGY & POWER
      58. | 6.58 DRIVERS IMPACT ANALYSIS: ENERGY & POWER
      59. | 6.59 RESTRAINTS IMPACT ANALYSIS: ENERGY & POWER
      60. | 6.60 SUPPLY / VALUE CHAIN: ENERGY & POWER
      61. | 6.61 ENERGY & POWER, BY TYPE, 2024 (% SHARE)
      62. | 6.62 ENERGY & POWER, BY TYPE, 2024 TO 2035 (USD Billion)
      63. | 6.63 ENERGY & POWER, BY APPLICATION, 2024 (% SHARE)
      64. | 6.64 ENERGY & POWER, BY APPLICATION, 2024 TO 2035 (USD Billion)
      65. | 6.65 BENCHMARKING OF MAJOR COMPETITORS
    7. LIST OF TABLES
      1. | 7.1 LIST OF ASSUMPTIONS
      2. | | 7.1.1
      3. | 7.2 North America MARKET SIZE ESTIMATES; FORECAST
      4. | | 7.2.1 BY TYPE, 2025-2035 (USD Billion)
      5. | | 7.2.2 BY APPLICATION, 2025-2035 (USD Billion)
      6. | 7.3 US MARKET SIZE ESTIMATES; FORECAST
      7. | | 7.3.1 BY TYPE, 2025-2035 (USD Billion)
      8. | | 7.3.2 BY APPLICATION, 2025-2035 (USD Billion)
      9. | 7.4 Canada MARKET SIZE ESTIMATES; FORECAST
      10. | | 7.4.1 BY TYPE, 2025-2035 (USD Billion)
      11. | | 7.4.2 BY APPLICATION, 2025-2035 (USD Billion)
      12. | 7.5 Europe MARKET SIZE ESTIMATES; FORECAST
      13. | | 7.5.1 BY TYPE, 2025-2035 (USD Billion)
      14. | | 7.5.2 BY APPLICATION, 2025-2035 (USD Billion)
      15. | 7.6 Germany MARKET SIZE ESTIMATES; FORECAST
      16. | | 7.6.1 BY TYPE, 2025-2035 (USD Billion)
      17. | | 7.6.2 BY APPLICATION, 2025-2035 (USD Billion)
      18. | 7.7 UK MARKET SIZE ESTIMATES; FORECAST
      19. | | 7.7.1 BY TYPE, 2025-2035 (USD Billion)
      20. | | 7.7.2 BY APPLICATION, 2025-2035 (USD Billion)
      21. | 7.8 France MARKET SIZE ESTIMATES; FORECAST
      22. | | 7.8.1 BY TYPE, 2025-2035 (USD Billion)
      23. | | 7.8.2 BY APPLICATION, 2025-2035 (USD Billion)
      24. | 7.9 Russia MARKET SIZE ESTIMATES; FORECAST
      25. | | 7.9.1 BY TYPE, 2025-2035 (USD Billion)
      26. | | 7.9.2 BY APPLICATION, 2025-2035 (USD Billion)
      27. | 7.10 Italy MARKET SIZE ESTIMATES; FORECAST
      28. | | 7.10.1 BY TYPE, 2025-2035 (USD Billion)
      29. | | 7.10.2 BY APPLICATION, 2025-2035 (USD Billion)
      30. | 7.11 Spain MARKET SIZE ESTIMATES; FORECAST
      31. | | 7.11.1 BY TYPE, 2025-2035 (USD Billion)
      32. | | 7.11.2 BY APPLICATION, 2025-2035 (USD Billion)
      33. | 7.12 Rest of Europe MARKET SIZE ESTIMATES; FORECAST
      34. | | 7.12.1 BY TYPE, 2025-2035 (USD Billion)
      35. | | 7.12.2 BY APPLICATION, 2025-2035 (USD Billion)
      36. | 7.13 APAC MARKET SIZE ESTIMATES; FORECAST
      37. | | 7.13.1 BY TYPE, 2025-2035 (USD Billion)
      38. | | 7.13.2 BY APPLICATION, 2025-2035 (USD Billion)
      39. | 7.14 China MARKET SIZE ESTIMATES; FORECAST
      40. | | 7.14.1 BY TYPE, 2025-2035 (USD Billion)
      41. | | 7.14.2 BY APPLICATION, 2025-2035 (USD Billion)
      42. | 7.15 India MARKET SIZE ESTIMATES; FORECAST
      43. | | 7.15.1 BY TYPE, 2025-2035 (USD Billion)
      44. | | 7.15.2 BY APPLICATION, 2025-2035 (USD Billion)
      45. | 7.16 Japan MARKET SIZE ESTIMATES; FORECAST
      46. | | 7.16.1 BY TYPE, 2025-2035 (USD Billion)
      47. | | 7.16.2 BY APPLICATION, 2025-2035 (USD Billion)
      48. | 7.17 South Korea MARKET SIZE ESTIMATES; FORECAST
      49. | | 7.17.1 BY TYPE, 2025-2035 (USD Billion)
      50. | | 7.17.2 BY APPLICATION, 2025-2035 (USD Billion)
      51. | 7.18 Malaysia MARKET SIZE ESTIMATES; FORECAST
      52. | | 7.18.1 BY TYPE, 2025-2035 (USD Billion)
      53. | | 7.18.2 BY APPLICATION, 2025-2035 (USD Billion)
      54. | 7.19 Thailand MARKET SIZE ESTIMATES; FORECAST
      55. | | 7.19.1 BY TYPE, 2025-2035 (USD Billion)
      56. | | 7.19.2 BY APPLICATION, 2025-2035 (USD Billion)
      57. | 7.20 Indonesia MARKET SIZE ESTIMATES; FORECAST
      58. | | 7.20.1 BY TYPE, 2025-2035 (USD Billion)
      59. | | 7.20.2 BY APPLICATION, 2025-2035 (USD Billion)
      60. | 7.21 Rest of APAC MARKET SIZE ESTIMATES; FORECAST
      61. | | 7.21.1 BY TYPE, 2025-2035 (USD Billion)
      62. | | 7.21.2 BY APPLICATION, 2025-2035 (USD Billion)
      63. | 7.22 South America MARKET SIZE ESTIMATES; FORECAST
      64. | | 7.22.1 BY TYPE, 2025-2035 (USD Billion)
      65. | | 7.22.2 BY APPLICATION, 2025-2035 (USD Billion)
      66. | 7.23 Brazil MARKET SIZE ESTIMATES; FORECAST
      67. | | 7.23.1 BY TYPE, 2025-2035 (USD Billion)
      68. | | 7.23.2 BY APPLICATION, 2025-2035 (USD Billion)
      69. | 7.24 Mexico MARKET SIZE ESTIMATES; FORECAST
      70. | | 7.24.1 BY TYPE, 2025-2035 (USD Billion)
      71. | | 7.24.2 BY APPLICATION, 2025-2035 (USD Billion)
      72. | 7.25 Argentina MARKET SIZE ESTIMATES; FORECAST
      73. | | 7.25.1 BY TYPE, 2025-2035 (USD Billion)
      74. | | 7.25.2 BY APPLICATION, 2025-2035 (USD Billion)
      75. | 7.26 Rest of South America MARKET SIZE ESTIMATES; FORECAST
      76. | | 7.26.1 BY TYPE, 2025-2035 (USD Billion)
      77. | | 7.26.2 BY APPLICATION, 2025-2035 (USD Billion)
      78. | 7.27 MEA MARKET SIZE ESTIMATES; FORECAST
      79. | | 7.27.1 BY TYPE, 2025-2035 (USD Billion)
      80. | | 7.27.2 BY APPLICATION, 2025-2035 (USD Billion)
      81. | 7.28 GCC Countries MARKET SIZE ESTIMATES; FORECAST
      82. | | 7.28.1 BY TYPE, 2025-2035 (USD Billion)
      83. | | 7.28.2 BY APPLICATION, 2025-2035 (USD Billion)
      84. | 7.29 South Africa MARKET SIZE ESTIMATES; FORECAST
      85. | | 7.29.1 BY TYPE, 2025-2035 (USD Billion)
      86. | | 7.29.2 BY APPLICATION, 2025-2035 (USD Billion)
      87. | 7.30 Rest of MEA MARKET SIZE ESTIMATES; FORECAST
      88. | | 7.30.1 BY TYPE, 2025-2035 (USD Billion)
      89. | | 7.30.2 BY APPLICATION, 2025-2035 (USD Billion)
      90. | 7.31 PRODUCT LAUNCH/PRODUCT DEVELOPMENT/APPROVAL
      91. | | 7.31.1
      92. | 7.32 ACQUISITION/PARTNERSHIP
      93. | | 7.32.1

    ASEAN Energy Transition Market Segmentation

    Market Segmentation Overview

    • Detailed segmentation data will be available in the full report
    • Comprehensive analysis by multiple parameters
    • Regional and country-level breakdowns
    • Market size forecasts by segment
    Infographic

    Free Sample Request

    Kindly complete the form below to receive a free sample of this Report

    Get Free Sample

    Customer Strories

    “I am very pleased with how market segments have been defined in a relevant way for my purposes (such as "Portable Freezers & refrigerators" and "last-mile"). In general the report is well structured. Thanks very much for your efforts.”

    Victoria Milne

    Founder
    Case Study
    Chemicals and Materials

    Compare Licence

    ×
    Features License Type
    Single User Multiuser License Enterprise User
    Price $4,950 $5,950 $7,250
    Maximum User Access Limit 1 User Upto 10 Users Unrestricted Access Throughout the Organization
    Free Customization
    Direct Access to Analyst
    Deliverable Format
    Platform Access
    Discount on Next Purchase 10% 15% 15%
    Printable Versions