Request Free Sample ×

Kindly complete the form below to receive a free sample of this Report

* Please use a valid business email

Leading companies partner with us for data-driven Insights

clients tt-cursor
Hero Background

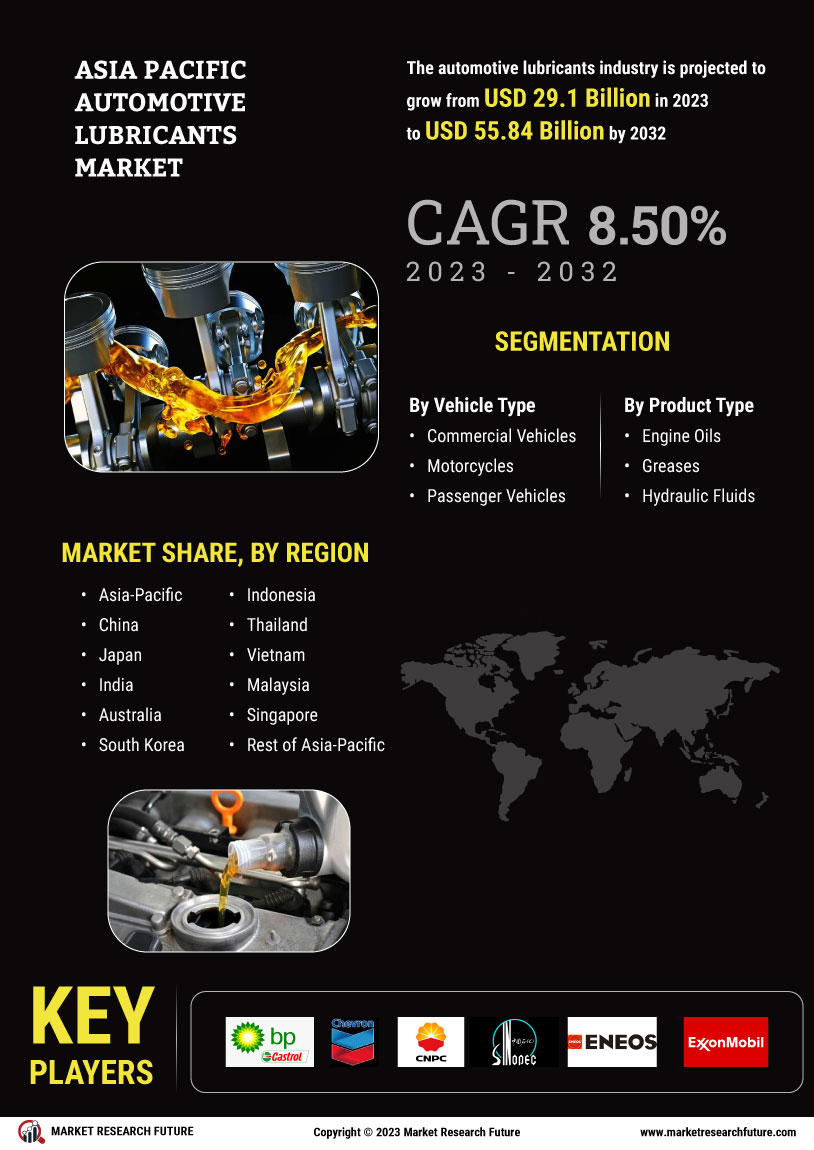
Asia Pacific Automotive Lubricants Market

ID: MRFR/CnM/12397-HCR
128 Pages
Anshula Mandaokar
Last Updated: April 06, 2026
Asia-Pacific Automotive Lubricants Market Research Report Information By Vehicle Type (Commercial Vehicle, Motorcycles, and Passenger Vehicles), By Product Type (Engine Oils, Greases, Hydraulic Fluids, and Transmission & Gear Oils) –and Asia-Pacific Market Forecast Till 2035.
Download PDF ×

We do not share your information with anyone. However, we may send you emails based on your report interest from time to time. You may contact us at any time to opt-out.

  1. 1 SECTION I: EXECUTIVE SUMMARY AND KEY HIGHLIGHTS
    1. 1.1 EXECUTIVE SUMMARY
      1. 1.1.1 Market Overview
      2. 1.1.2 Key Findings
      3. 1.1.3 Market Segmentation
      4. 1.1.4 Competitive Landscape
      5. 1.1.5 Challenges and Opportunities
      6. 1.1.6 Future Outlook
  2. 2 SECTION II: SCOPING, METHODOLOGY AND MARKET STRUCTURE
    1. 2.1 MARKET INTRODUCTION
      1. 2.1.1 Definition
      2. 2.1.2 Scope of the study
        1. 2.1.2.1 Research Objective
        2. 2.1.2.2 Assumption
        3. 2.1.2.3 Limitations
    2. 2.2 RESEARCH METHODOLOGY
      1. 2.2.1 Overview
      2. 2.2.2 Data Mining
      3. 2.2.3 Secondary Research
      4. 2.2.4 Primary Research
        1. 2.2.4.1 Primary Interviews and Information Gathering Process
        2. 2.2.4.2 Breakdown of Primary Respondents
      5. 2.2.5 Forecasting Model
      6. 2.2.6 Market Size Estimation
        1. 2.2.6.1 Bottom-Up Approach
        2. 2.2.6.2 Top-Down Approach
      7. 2.2.7 Data Triangulation
      8. 2.2.8 Validation
  3. 3 SECTION III: QUALITATIVE ANALYSIS
    1. 3.1 MARKET DYNAMICS
      1. 3.1.1 Overview
      2. 3.1.2 Drivers
      3. 3.1.3 Restraints
      4. 3.1.4 Opportunities
    2. 3.2 MARKET FACTOR ANALYSIS
      1. 3.2.1 Value chain Analysis
      2. 3.2.2 Porter's Five Forces Analysis
        1. 3.2.2.1 Bargaining Power of Suppliers
        2. 3.2.2.2 Bargaining Power of Buyers
        3. 3.2.2.3 Threat of New Entrants
        4. 3.2.2.4 Threat of Substitutes
        5. 3.2.2.5 Intensity of Rivalry
      3. 3.2.3 COVID-19 Impact Analysis
        1. 3.2.3.1 Market Impact Analysis
        2. 3.2.3.2 Regional Impact
        3. 3.2.3.3 Opportunity and Threat Analysis
  4. 4 SECTION IV: QUANTITATIVE ANALYSIS
    1. 4.1 Pharmaceutical, BY Material (USD Billion)
      1. 4.1.1 Mineral Oil
      2. 4.1.2 Fully Synthetic Oil
      3. 4.1.3 Semi-Synthetic Oil
      4. 4.1.4 Bio-Based Oil
    2. 4.2 Pharmaceutical, BY Product Type (USD Billion)
      1. 4.2.1 Engine Oil
      2. 4.2.2 Brake Oil
      3. 4.2.3 Gear Oil
      4. 4.2.4 Grease
      5. 4.2.5 Other Fluids
    3. 4.3 Pharmaceutical, BY Application (USD Billion)
      1. 4.3.1 Two Wheelers
      2. 4.3.2 Three Wheelers
      3. 4.3.3 Passenger Cars
      4. 4.3.4 Light-Weight Commercial Vehicles
      5. 4.3.5 Heavy-Weight Commercial Vehicles
  5. 5 SECTION V: COMPETITIVE ANALYSIS
    1. 5.1 Competitive Landscape
      1. 5.1.1 Overview
      2. 5.1.2 Competitive Analysis
      3. 5.1.3 Market share Analysis
      4. 5.1.4 Major Growth Strategy in the Pharmaceutical
      5. 5.1.5 Competitive Benchmarking
      6. 5.1.6 Leading Players in Terms of Number of Developments in the Pharmaceutical
      7. 5.1.7 Key developments and growth strategies
        1. 5.1.7.1 New Product Launch/Service Deployment
        2. 5.1.7.2 Merger & Acquisitions
        3. 5.1.7.3 Joint Ventures
      8. 5.1.8 Major Players Financial Matrix
        1. 5.1.8.1 Sales and Operating Income
        2. 5.1.8.2 Major Players R&D Expenditure. 2023
    2. 5.2 Company Profiles
      1. 5.2.1 ExxonMobil (US)
        1. 5.2.1.1 Financial Overview
        2. 5.2.1.2 Products Offered
        3. 5.2.1.3 Key Developments
        4. 5.2.1.4 SWOT Analysis
        5. 5.2.1.5 Key Strategies
      2. 5.2.2 Shell (GB)
        1. 5.2.2.1 Financial Overview
        2. 5.2.2.2 Products Offered
        3. 5.2.2.3 Key Developments
        4. 5.2.2.4 SWOT Analysis
        5. 5.2.2.5 Key Strategies
      3. 5.2.3 BP (GB)
        1. 5.2.3.1 Financial Overview
        2. 5.2.3.2 Products Offered
        3. 5.2.3.3 Key Developments
        4. 5.2.3.4 SWOT Analysis
        5. 5.2.3.5 Key Strategies
      4. 5.2.4 TotalEnergies (FR)
        1. 5.2.4.1 Financial Overview
        2. 5.2.4.2 Products Offered
        3. 5.2.4.3 Key Developments
        4. 5.2.4.4 SWOT Analysis
        5. 5.2.4.5 Key Strategies
      5. 5.2.5 Chevron (US)
        1. 5.2.5.1 Financial Overview
        2. 5.2.5.2 Products Offered
        3. 5.2.5.3 Key Developments
        4. 5.2.5.4 SWOT Analysis
        5. 5.2.5.5 Key Strategies
      6. 5.2.6 Fuchs Petrolub (DE)
        1. 5.2.6.1 Financial Overview
        2. 5.2.6.2 Products Offered
        3. 5.2.6.3 Key Developments
        4. 5.2.6.4 SWOT Analysis
        5. 5.2.6.5 Key Strategies
      7. 5.2.7 Valvoline (US)
        1. 5.2.7.1 Financial Overview
        2. 5.2.7.2 Products Offered
        3. 5.2.7.3 Key Developments
        4. 5.2.7.4 SWOT Analysis
        5. 5.2.7.5 Key Strategies
      8. 5.2.8 Castrol (GB)
        1. 5.2.8.1 Financial Overview
        2. 5.2.8.2 Products Offered
        3. 5.2.8.3 Key Developments
        4. 5.2.8.4 SWOT Analysis
        5. 5.2.8.5 Key Strategies
      9. 5.2.9 Liqui Moly (DE)
        1. 5.2.9.1 Financial Overview
        2. 5.2.9.2 Products Offered
        3. 5.2.9.3 Key Developments
        4. 5.2.9.4 SWOT Analysis
        5. 5.2.9.5 Key Strategies
    3. 5.3 Appendix
      1. 5.3.1 References
      2. 5.3.2 Related Reports
  6. 6 LIST OF FIGURES
    1. 6.1 MARKET SYNOPSIS
    2. 6.2 APAC MARKET ANALYSIS BY MATERIAL
    3. 6.3 APAC MARKET ANALYSIS BY PRODUCT TYPE
    4. 6.4 APAC MARKET ANALYSIS BY APPLICATION
    5. 6.5 KEY BUYING CRITERIA OF PHARMACEUTICAL
    6. 6.6 RESEARCH PROCESS OF MRFR
    7. 6.7 DRO ANALYSIS OF PHARMACEUTICAL
    8. 6.8 DRIVERS IMPACT ANALYSIS: PHARMACEUTICAL
    9. 6.9 RESTRAINTS IMPACT ANALYSIS: PHARMACEUTICAL
    10. 6.10 SUPPLY / VALUE CHAIN: PHARMACEUTICAL
    11. 6.11 PHARMACEUTICAL, BY MATERIAL, 2024 (% SHARE)
    12. 6.12 PHARMACEUTICAL, BY MATERIAL, 2024 TO 2035 (USD Billion)
    13. 6.13 PHARMACEUTICAL, BY PRODUCT TYPE, 2024 (% SHARE)
    14. 6.14 PHARMACEUTICAL, BY PRODUCT TYPE, 2024 TO 2035 (USD Billion)
    15. 6.15 PHARMACEUTICAL, BY APPLICATION, 2024 (% SHARE)
    16. 6.16 PHARMACEUTICAL, BY APPLICATION, 2024 TO 2035 (USD Billion)
    17. 6.17 BENCHMARKING OF MAJOR COMPETITORS
  7. 7 LIST OF TABLES
    1. 7.1 LIST OF ASSUMPTIONS
  8. 7.1.1
    1. 7.2 APAC MARKET SIZE ESTIMATES; FORECAST
      1. 7.2.1 BY MATERIAL, 2025-2035 (USD Billion)
      2. 7.2.2 BY PRODUCT TYPE, 2025-2035 (USD Billion)
      3. 7.2.3 BY APPLICATION, 2025-2035 (USD Billion)
    2. 7.3 PRODUCT LAUNCH/PRODUCT DEVELOPMENT/APPROVAL
  9. 7.3.1
    1. 7.4 ACQUISITION/PARTNERSHIP
  10. 7.4.1

APAC Pharmaceutical Market Segmentation

Pharmaceutical By Material (USD Billion, 2025-2035)

  • Mineral Oil
  • Fully Synthetic Oil
  • Semi-Synthetic Oil
  • Bio-Based Oil

Pharmaceutical By Product Type (USD Billion, 2025-2035)

  • Engine Oil
  • Brake Oil
  • Gear Oil
  • Grease
  • Other Fluids

Pharmaceutical By Application (USD Billion, 2025-2035)

  • Two Wheelers
  • Three Wheelers
  • Passenger Cars
  • Light-Weight Commercial Vehicles
  • Heavy-Weight Commercial Vehicles