Request Free Sample ×

Kindly complete the form below to receive a free sample of this Report

* Please use a valid business email

Leading companies partner with us for data-driven Insights

clients tt-cursor
Hero Background

Asia Pacific Consumer Electronics Market

ID: MRFR/SEM/20183-HCR
200 Pages
Ankit Gupta
Last Updated: April 06, 2026
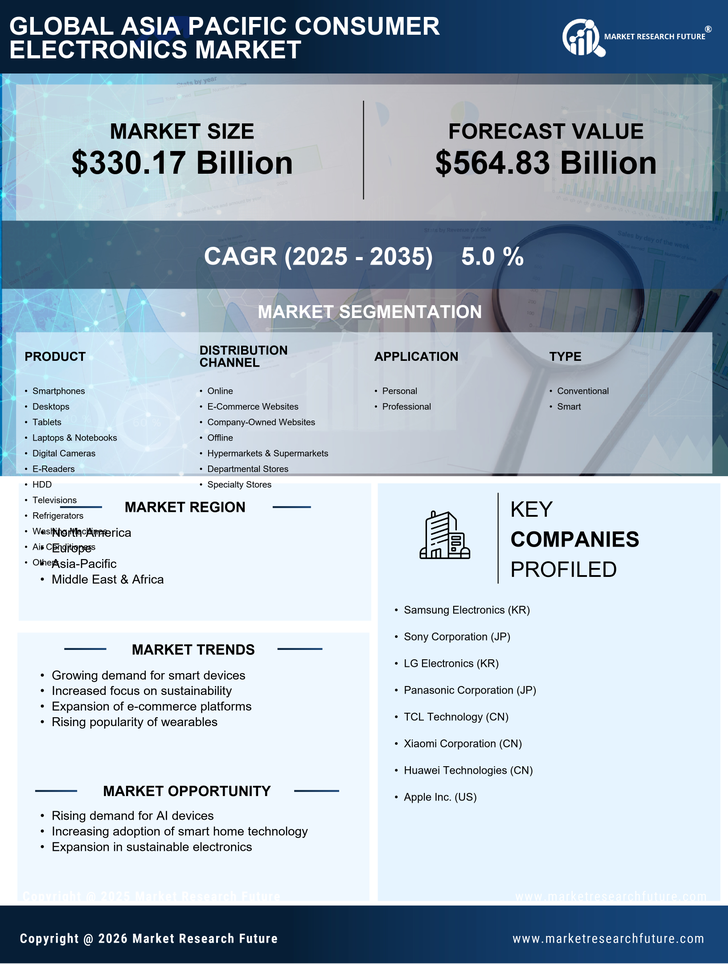
Asia-Pacific Consumer Electronics Market Size, Share and Research Report By Product (Smartphones, Desktops, Tablets, Laptops & Notebooks, Digital Cameras, eReaders, HDD, Television, Refrigerators, Washing Machine, Air Conditioners, and Others), By Distribution Channel (Online, E-Commerce Websites, Company-Owned Websites, Offline, Hypermarkets & Supermarkets, Departmental Stores, and Specialty Stores), By Application (Personal, and Professional), By Type (Conventional, and Smart), By Technology (Near Field Communication (NFC), Magnetic Secure Transmission (MST), Artificial Intelligence (AI), VR (Virtual Reality) Technology, Generation PCL Technology, and Others) –and APAC Industry Forecast Till 2035
Download PDF ×

We do not share your information with anyone. However, we may send you emails based on your report interest from time to time. You may contact us at any time to opt-out.

  1. 1 SECTION I: EXECUTIVE SUMMARY AND KEY HIGHLIGHTS
    1. 1.1 EXECUTIVE SUMMARY
      1. 1.1.1 Market Overview
      2. 1.1.2 Key Findings
      3. 1.1.3 Market Segmentation
      4. 1.1.4 Competitive Landscape
      5. 1.1.5 Challenges and Opportunities
      6. 1.1.6 Future Outlook
  2. 2 SECTION II: SCOPING, METHODOLOGY AND MARKET STRUCTURE
    1. 2.1 MARKET INTRODUCTION
      1. 2.1.1 Definition
      2. 2.1.2 Scope of the study
        1. 2.1.2.1 Research Objective
        2. 2.1.2.2 Assumption
        3. 2.1.2.3 Limitations
    2. 2.2 RESEARCH METHODOLOGY
      1. 2.2.1 Overview
      2. 2.2.2 Data Mining
      3. 2.2.3 Secondary Research
      4. 2.2.4 Primary Research
        1. 2.2.4.1 Primary Interviews and Information Gathering Process
        2. 2.2.4.2 Breakdown of Primary Respondents
      5. 2.2.5 Forecasting Model
      6. 2.2.6 Market Size Estimation
        1. 2.2.6.1 Bottom-Up Approach
        2. 2.2.6.2 Top-Down Approach
      7. 2.2.7 Data Triangulation
      8. 2.2.8 Validation
  3. 3 SECTION III: QUALITATIVE ANALYSIS
    1. 3.1 MARKET DYNAMICS
      1. 3.1.1 Overview
      2. 3.1.2 Drivers
      3. 3.1.3 Restraints
      4. 3.1.4 Opportunities
    2. 3.2 MARKET FACTOR ANALYSIS
      1. 3.2.1 Value chain Analysis
      2. 3.2.2 Porter's Five Forces Analysis
        1. 3.2.2.1 Bargaining Power of Suppliers
        2. 3.2.2.2 Bargaining Power of Buyers
        3. 3.2.2.3 Threat of New Entrants
        4. 3.2.2.4 Threat of Substitutes
        5. 3.2.2.5 Intensity of Rivalry
      3. 3.2.3 COVID-19 Impact Analysis
        1. 3.2.3.1 Market Impact Analysis
        2. 3.2.3.2 Regional Impact
        3. 3.2.3.3 Opportunity and Threat Analysis
  4. 4 SECTION IV: QUANTITATIVE ANALYSIS
    1. 4.1 Semiconductor & Electronics, BY Product Type (USD Million)
      1. 4.1.1 Televisions
      2. 4.1.2 Smartphones
      3. 4.1.3 Laptops
      4. 4.1.4 Wearable Devices
      5. 4.1.5 Audio Equipment
    2. 4.2 Semiconductor & Electronics, BY Distribution Channel (USD Million)
      1. 4.2.1 Online Retail
      2. 4.2.2 Offline Retail
      3. 4.2.3 Direct Sales
      4. 4.2.4 Wholesale
      5. 4.2.5 E-commerce Platforms
    3. 4.3 Semiconductor & Electronics, BY End User (USD Million)
      1. 4.3.1 Individual Consumers
      2. 4.3.2 Businesses
      3. 4.3.3 Educational Institutions
      4. 4.3.4 Government Agencies
      5. 4.3.5 Healthcare Providers
    4. 4.4 Semiconductor & Electronics, BY Technology (USD Million)
      1. 4.4.1 Artificial Intelligence
      2. 4.4.2 Internet of Things
      3. 4.4.3 Augmented Reality
      4. 4.4.4 Virtual Reality
      5. 4.4.5 5G Technology
  5. 5 SECTION V: COMPETITIVE ANALYSIS
    1. 5.1 Competitive Landscape
      1. 5.1.1 Overview
      2. 5.1.2 Competitive Analysis
      3. 5.1.3 Market share Analysis
      4. 5.1.4 Major Growth Strategy in the Semiconductor & Electronics
      5. 5.1.5 Competitive Benchmarking
      6. 5.1.6 Leading Players in Terms of Number of Developments in the Semiconductor & Electronics
      7. 5.1.7 Key developments and growth strategies
        1. 5.1.7.1 New Product Launch/Service Deployment
        2. 5.1.7.2 Merger & Acquisitions
        3. 5.1.7.3 Joint Ventures
      8. 5.1.8 Major Players Financial Matrix
        1. 5.1.8.1 Sales and Operating Income
        2. 5.1.8.2 Major Players R&D Expenditure. 2023
    2. 5.2 Company Profiles
      1. 5.2.1 Samsung Electronics (KR)
        1. 5.2.1.1 Financial Overview
        2. 5.2.1.2 Products Offered
        3. 5.2.1.3 Key Developments
        4. 5.2.1.4 SWOT Analysis
        5. 5.2.1.5 Key Strategies
      2. 5.2.2 Sony Corporation (JP)
        1. 5.2.2.1 Financial Overview
        2. 5.2.2.2 Products Offered
        3. 5.2.2.3 Key Developments
        4. 5.2.2.4 SWOT Analysis
        5. 5.2.2.5 Key Strategies
      3. 5.2.3 LG Electronics (KR)
        1. 5.2.3.1 Financial Overview
        2. 5.2.3.2 Products Offered
        3. 5.2.3.3 Key Developments
        4. 5.2.3.4 SWOT Analysis
        5. 5.2.3.5 Key Strategies
      4. 5.2.4 Panasonic Corporation (JP)
        1. 5.2.4.1 Financial Overview
        2. 5.2.4.2 Products Offered
        3. 5.2.4.3 Key Developments
        4. 5.2.4.4 SWOT Analysis
        5. 5.2.4.5 Key Strategies
      5. 5.2.5 TCL Technology (CN)
        1. 5.2.5.1 Financial Overview
        2. 5.2.5.2 Products Offered
        3. 5.2.5.3 Key Developments
        4. 5.2.5.4 SWOT Analysis
        5. 5.2.5.5 Key Strategies
      6. 5.2.6 Xiaomi Corporation (CN)
        1. 5.2.6.1 Financial Overview
        2. 5.2.6.2 Products Offered
        3. 5.2.6.3 Key Developments
        4. 5.2.6.4 SWOT Analysis
        5. 5.2.6.5 Key Strategies
      7. 5.2.7 Huawei Technologies (CN)
        1. 5.2.7.1 Financial Overview
        2. 5.2.7.2 Products Offered
        3. 5.2.7.3 Key Developments
        4. 5.2.7.4 SWOT Analysis
        5. 5.2.7.5 Key Strategies
      8. 5.2.8 Lenovo Group (CN)
        1. 5.2.8.1 Financial Overview
        2. 5.2.8.2 Products Offered
        3. 5.2.8.3 Key Developments
        4. 5.2.8.4 SWOT Analysis
        5. 5.2.8.5 Key Strategies
      9. 5.2.9 ASUS (TW)
        1. 5.2.9.1 Financial Overview
        2. 5.2.9.2 Products Offered
        3. 5.2.9.3 Key Developments
        4. 5.2.9.4 SWOT Analysis
        5. 5.2.9.5 Key Strategies
      10. 5.2.10 Sharp Corporation (JP)
        1. 5.2.10.1 Financial Overview
        2. 5.2.10.2 Products Offered
        3. 5.2.10.3 Key Developments
        4. 5.2.10.4 SWOT Analysis
        5. 5.2.10.5 Key Strategies
    3. 5.3 Appendix
      1. 5.3.1 References
      2. 5.3.2 Related Reports
  6. 6 LIST OF FIGURES
    1. 6.1 MARKET SYNOPSIS
    2. 6.2 APAC MARKET ANALYSIS BY PRODUCT TYPE
    3. 6.3 APAC MARKET ANALYSIS BY DISTRIBUTION CHANNEL
    4. 6.4 APAC MARKET ANALYSIS BY END USER
    5. 6.5 APAC MARKET ANALYSIS BY TECHNOLOGY
    6. 6.6 KEY BUYING CRITERIA OF SEMICONDUCTOR & ELECTRONICS
    7. 6.7 RESEARCH PROCESS OF MRFR
    8. 6.8 DRO ANALYSIS OF SEMICONDUCTOR & ELECTRONICS
    9. 6.9 DRIVERS IMPACT ANALYSIS: SEMICONDUCTOR & ELECTRONICS
    10. 6.10 RESTRAINTS IMPACT ANALYSIS: SEMICONDUCTOR & ELECTRONICS
    11. 6.11 SUPPLY / VALUE CHAIN: SEMICONDUCTOR & ELECTRONICS
    12. 6.12 SEMICONDUCTOR & ELECTRONICS, BY PRODUCT TYPE, 2024 (% SHARE)
    13. 6.13 SEMICONDUCTOR & ELECTRONICS, BY PRODUCT TYPE, 2024 TO 2035 (USD Million)
    14. 6.14 SEMICONDUCTOR & ELECTRONICS, BY DISTRIBUTION CHANNEL, 2024 (% SHARE)
    15. 6.15 SEMICONDUCTOR & ELECTRONICS, BY DISTRIBUTION CHANNEL, 2024 TO 2035 (USD Million)
    16. 6.16 SEMICONDUCTOR & ELECTRONICS, BY END USER, 2024 (% SHARE)
    17. 6.17 SEMICONDUCTOR & ELECTRONICS, BY END USER, 2024 TO 2035 (USD Million)
    18. 6.18 SEMICONDUCTOR & ELECTRONICS, BY TECHNOLOGY, 2024 (% SHARE)
    19. 6.19 SEMICONDUCTOR & ELECTRONICS, BY TECHNOLOGY, 2024 TO 2035 (USD Million)
    20. 6.20 BENCHMARKING OF MAJOR COMPETITORS
  7. 7 LIST OF TABLES
    1. 7.1 LIST OF ASSUMPTIONS
  8. 7.1.1
    1. 7.2 APAC MARKET SIZE ESTIMATES; FORECAST
      1. 7.2.1 BY PRODUCT TYPE, 2026-2035 (USD Million)
      2. 7.2.2 BY DISTRIBUTION CHANNEL, 2026-2035 (USD Million)
      3. 7.2.3 BY END USER, 2026-2035 (USD Million)
      4. 7.2.4 BY TECHNOLOGY, 2026-2035 (USD Million)
    2. 7.3 PRODUCT LAUNCH/PRODUCT DEVELOPMENT/APPROVAL
  9. 7.3.1
    1. 7.4 ACQUISITION/PARTNERSHIP
  10. 7.4.1

APAC Semiconductor & Electronics Market Segmentation

Semiconductor & Electronics By Product Type (USD Million, 2026-2035)

  • Televisions
  • Smartphones
  • Laptops
  • Wearable Devices
  • Audio Equipment

Semiconductor & Electronics By Distribution Channel (USD Million, 2026-2035)

  • Online Retail
  • Offline Retail
  • Direct Sales
  • Wholesale
  • E-commerce Platforms

Semiconductor & Electronics By End User (USD Million, 2026-2035)

  • Individual Consumers
  • Businesses
  • Educational Institutions
  • Government Agencies
  • Healthcare Providers

Semiconductor & Electronics By Technology (USD Million, 2026-2035)

  • Artificial Intelligence
  • Internet of Things
  • Augmented Reality
  • Virtual Reality
  • 5G Technology