Segmentation Quick Reference
| Dimension | Sub-Segments | Dominant Segment | Fastest Growing Segment |
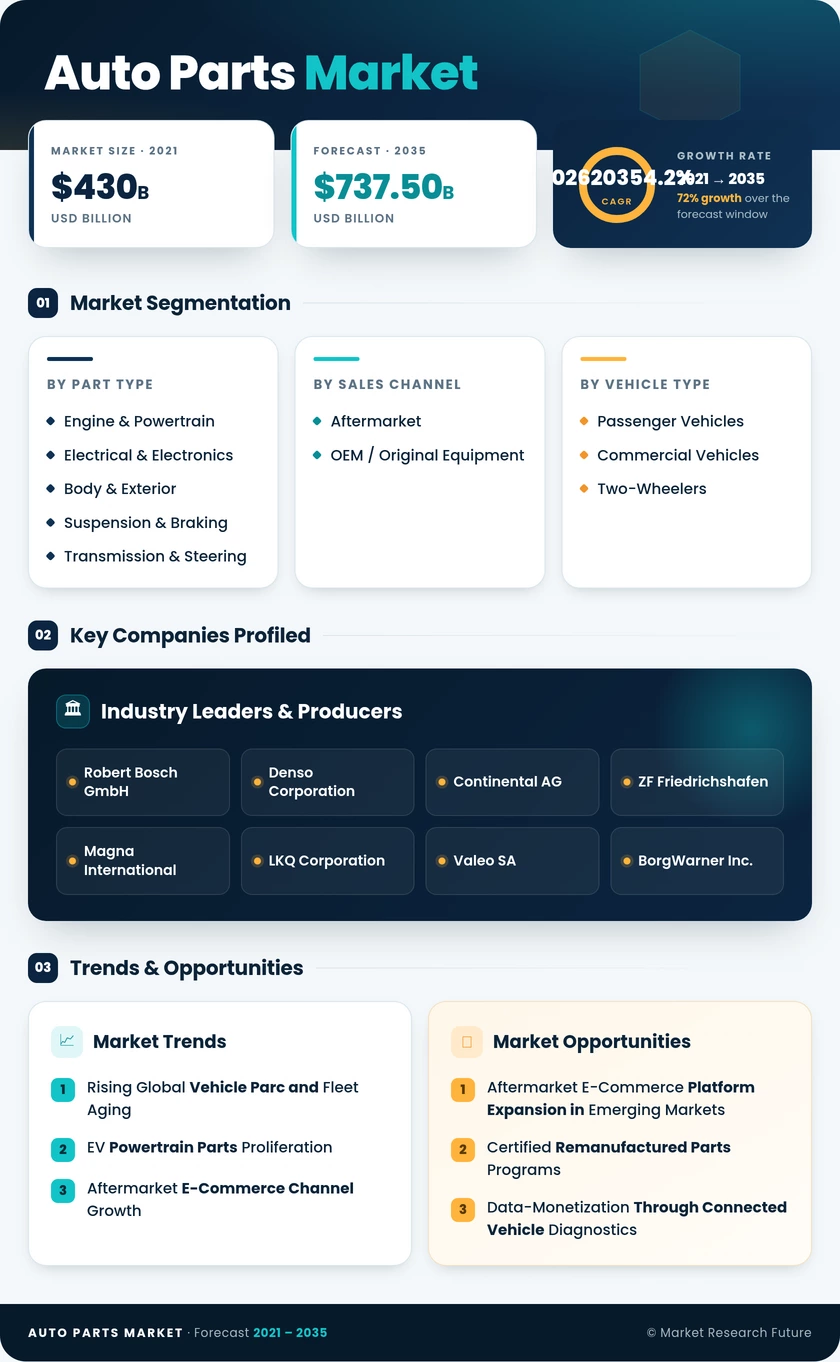
| By Part Type | Engine & Powertrain; Electrical & Electronics; Body & Exterior; Suspension & Braking; Transmission & Steering; Others (HVAC, Filters, Fluids) | Engine & Powertrain (~28%) | Electrical & Electronics (5.8% CAGR) |
| By Sales Channel | Aftermarket; OEM / Original Equipment | Aftermarket (~55%) | OEM / Original Equipment (3.6% CAGR) |
| By Vehicle Type | Passenger Vehicles; Commercial Vehicles; Two-Wheelers | Passenger Vehicles (~62%) | Two-Wheelers (5.1% CAGR) |
Market Segmentation Overview
By Part Type
| Sub-Segment | Key Trend |
| Engine & Powertrain | Sustained by 1.2B+ ICE fleet; hybrid powertrains adding complexity |
| Electrical & Electronics | ADAS sensors, EV battery management systems and high-voltage connectors are driving rapid expansion |
| Body & Exterior | Collision repair demand steady; lightweighting materials increasing unit cost. |
| Suspension & Braking | Commercial fleet inspection cycles ensure recurring replacement demand. |
| Transmission & Steering | Shift to electric power steering and CVTs is reshaping the component mix. |
| Others (HVAC, Filters, Fluids) | Routine maintenance staples; stable demand linked to vehicle-kilometers-traveled |
Engine and powertrain parts anchor the global Auto Parts Market, but the center of gravity is shifting. As ADAS and electrification add dozens of new electronic modules per vehicle, the electrical and electronics segment is capturing an expanding share of total parts revenue while redefining the skills required across the repair value chain.
By Sales Channel
| Sub-Segment | Key Trend |
| Aftermarket | E-commerce platforms are accelerating access; independent workshops are driving volume. |
| OEM / Original Equipment | Certified remanufacturing and extended warranty programs are sustaining growth |
By Vehicle Type
| Sub-Segment | Key Trend |
| Passenger Vehicles | Largest fleet globally; consumer aftermarket DIY and DIFM segments both active |
| Commercial Vehicles | Higher per-unit parts spend; fleet management contracts ensure predictable demand. |
| Two-Wheelers | Fastest growth driven by Asia-Pacific motorization; high replacement frequency |
Passenger vehicles dominate total parts volume, but per-vehicle economics favor commercial fleets where downtime costs justify premium parts and accelerated replacement cycles. Two-wheelers represent the fastest-growing opportunity as rising incomes across Southeast Asia and Sub-Saharan Africa expand the addressable vehicle parc for the Auto Parts Market.