• Cat-intel
  • MedIntelliX
  • Resources
  • About Us
  • Hero Background
    English
    Chinese
    French
    Japanese
    Korean
    German
    Spanish

    Automotive Coolant Market Trends

    ID: MRFR/CnM/3245-CR
    274 Pages
    Anshula Mandaokar
    May 2023

    Automotive Coolant Market Research Report Information By Product (Ethylene Glycol, Propylene Glycol, Glycerin, and Others), By Vehicle Type (Passenger Car, Heavy Commercial Vehicles, Light Commercial Vehicles, and Others), By Technology (Inorganic Additive Technology (IAT), Organic Additive Technology (OAT), and Hybrid Organic Acid Technology (HOAT)), By End User (Original Equipment Manufacture...

    Share:
    Download PDF ×

    We do not share your information with anyone. However, we may send you emails based on your report interest from time to time. You may contact us at any time to opt-out.

    Automotive Coolant Market Infographic
    $ 4,950.0
    $ 5,950.0
    $ 7,250.0

    Market Trends

    Introduction

    The market for automobile cooling liquids is undergoing major changes as we enter the year 2024, owing to a confluence of macroeconomic factors. The technological development of automobiles is leading to more efficient and more eco-friendly cooling fluids, while governmental efforts to reduce emissions and improve vehicle performance are reshaping product standards. Also, the changing consumer behavior, a trend towards products that are both sustainable and high-quality, is influencing the purchasing decisions. These trends are of strategic importance for all the market participants. They not only influence product development and compliance strategies but also the market positioning and the competitive structure.

    Top Trends

    1. Sustainability Initiatives
      With increasing pressure from the authorities to comply with ever more stringent regulations, the industry is concentrating on developing more eco-friendly coolant formulations. For example, BASF has developed bio-based coolants that reduce the carbon footprint. The European Union’s Green Deal, with its goal of reducing emissions, is pushing manufacturers to innovate. This trend will also benefit brand loyalty among consumers who are aware of their responsibility to the environment. Biodegradable coolants are likely to become more widespread in the future, and the use of traditional coolant components will be subject to ever stricter controls.
    2. Technological Advancements
      In recent years, the integration of advanced technology into the cooling systems has increased. ExxonMobil has invested heavily in research and development in order to develop high-performance coolants that increase engine efficiency. Data shows that the cooling requirements of modern engines are more complex and the product portfolio is shifting accordingly. This trend may result in higher operating costs for manufacturers but can improve the performance of products and customer satisfaction.
    3. Electric Vehicle Coolants
      Electric vehicles (EVs) are gaining market share, and demand for special coolants is rising accordingly. Coolants developed by Total Energy have been developed for use in the batteries of EVs. A projection by the International Energy Agency forecasts a 40% increase in the sale of EVs by 2023, which indicates a growing market. This trend will lead to the development of new coolants and new opportunities for coolant manufacturers.
    4. Global Supply Chain Challenges
      The car industry is still experiencing supply disruptions that are affecting the availability of coolants. Among other things, Chevron has reported delays in obtaining raw materials due to the current political situation. According to industry reports, in 2023, 70 per cent of manufacturers had supply chain problems. This trend may lead to price increases and a push towards local sourcing strategies on the part of coolant producers.
    5. Regulatory Compliance and Safety Standards
      Markets are being shaped by stricter regulations on the safety and the environment of cooling fluids. These regulations, such as the EPA's guideline on hazardous substances, are being enforced by governments. These regulations are the basis for ensuring that the products of companies like Shell are safe and sustainable. This trend may result in higher operating costs, but it will increase the credibility of the products and the trust of consumers.
    6. Consumer Awareness and Education
      There is growing emphasis on the education of consumers in the choice of coolants and their care. Brands such as Prestone are investing in advertising to educate consumers about the importance of choosing the right coolant. According to research, around 60% of consumers are unaware of the coolant types and their benefits. This trend may result in a demand for educational resources and an impact on purchasing decisions.
    7. Increased Competition and Market Consolidation
      Competition in the automobile coolant market is growing. This may lead to further mergers and acquisitions. Valvoline, for example, is trying to expand its product range in order to gain market share. An analysis of the industry shows that up to 30 per cent of small manufacturers may not be able to compete with the big companies. This could lead to a more consolidated market, with consequences for price strategy and product diversity.
    8. Focus on Performance Enhancements
      Coolant manufacturers are placing performance-enhancing additives at the forefront of their formulations. For example, Motul has introduced coolants which improve heat transfer and reduce engine wear. A study by the American Automobile Association shows that engines using these coolants can be extended by up to 20 per cent. This trend could lead to higher R&D expenditure and a shift in consumer preferences towards premium products.
    9. Digital Transformation in Marketing
      The cooling fluid market has embraced digital marketing strategies to reach consumers. Brands like Castrol are promoting their products on social media and e-commerce platforms. Data shows that in 2023 the e-commerce sales of auto parts rose by 25 percent. This trend is likely to raise the profile of brands and increase the engagement of consumers, thereby driving sales in the digital space.
    10. Emerging Markets Growth
      The emerging markets are becoming significant players in the field of car coolants. In countries such as India and Brazil, the number of vehicles is growing, which is driving the demand for coolants. According to reports, the consumption of coolants in these countries is expected to grow by 15 per cent annually. This growth may encourage manufacturers to develop new products, such as coolants that are more suited to the tastes of local consumers, and to invest in distribution networks to take advantage of this growth.

    Conclusion: Navigating the Competitive Coolant Landscape

    The 'Automotive Coolant' market is characterized by an intense competition and a high degree of fragmentation. The competition between the established and the newcomers is very strong. The demand for coolants that are both environmentally friendly and high in performance is increasing in the individual regions. This leads to innovations and new product developments. The established companies use their brand name and their distribution network to differentiate themselves, while the newcomers are focusing on sustainability and advanced technology. For the suppliers, the strategic requirement is to invest in the development of artificial intelligence for the purpose of predicting wear and tear, automation for the purpose of increasing productivity, and flexibility for responding to changing customer requirements. The companies that are able to combine these three aspects in the best possible way will probably be the market leaders in the future.

    Author
    Anshula Mandaokar
    Team Lead - Research

    Anshula Mandaokar holds an academic degree in Chemical Engineering and has been contributing to the field for more than 5 years. She has expertise in Market Research and Business Consulting and serves as a Team Lead for a reputed Market Research firm under the Chemicals and Materials domain spectrum. She has worked on multiple projects, generating explicit results in a quick turnaround time. Her understanding of data interpretation justifies her role as a leader.

    Leave a Comment

    FAQs

    What is the projected market valuation of the Automotive Coolant Market by 2035?

    The Automotive Coolant Market is projected to reach a valuation of 11.51 USD Billion by 2035.

    What was the market valuation of the Automotive Coolant Market in 2024?

    In 2024, the Automotive Coolant Market was valued at 7.89 USD Billion.

    What is the expected CAGR for the Automotive Coolant Market during the forecast period 2025 - 2035?

    The expected CAGR for the Automotive Coolant Market during the forecast period 2025 - 2035 is 3.49%.

    Which product segment is anticipated to have the highest valuation by 2035?

    By 2035, the Ethylene Glycol segment is anticipated to reach a valuation of 5.2 USD Billion.

    What is the projected valuation for the Automotive Aftermarket segment by 2035?

    The Automotive Aftermarket segment is projected to reach a valuation of 5.84 USD Billion by 2035.

    Which technology segment is expected to grow significantly by 2035?

    The Organic Additive Technology (OAT) segment is expected to grow significantly, reaching 4.5 USD Billion by 2035.

    What is the anticipated valuation for the Heavy Commercial Vehicles segment by 2035?

    The Heavy Commercial Vehicles segment is anticipated to reach a valuation of 2.2 USD Billion by 2035.

    Who are the key players in the Automotive Coolant Market?

    Key players in the Automotive Coolant Market include Prestone, Zerex, Valvoline, Shell, Castrol, Total, Motul, Glysantin, and BASF.

    Market Summary

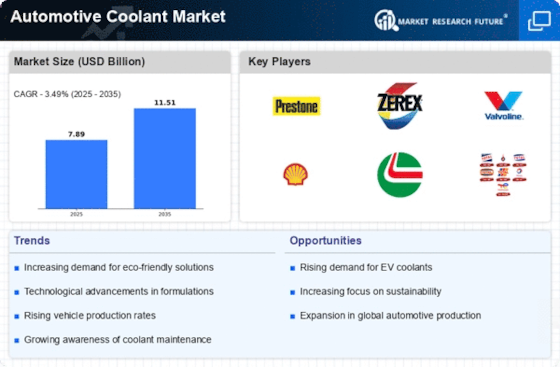
    As per MRFR analysis, the Automotive Coolant Market Size was estimated at 7.89 USD Billion in 2024. The Automotive Coolant industry is projected to grow from 8.166 USD Billion in 2025 to 11.51 USD Billion by 2035, exhibiting a compound annual growth rate (CAGR) of 3.49 during the forecast period 2025 - 2035.

    Key Market Trends & Highlights

    The Automotive Coolant Market is experiencing a transformative shift towards eco-friendly solutions and advanced formulations.

    • The rise of eco-friendly coolants is reshaping consumer preferences in North America, the largest market.
    • Technological advancements in coolant formulations are driving innovation across the Asia-Pacific region, the fastest-growing market.
    • Electric vehicles are influencing coolant requirements, particularly in the passenger car segment, which remains the largest.
    • Increasing vehicle production and stringent environmental regulations are key drivers propelling market growth.

    Market Size & Forecast

    2024 Market Size 7.89 (USD Billion)
    2035 Market Size 11.51 (USD Billion)
    CAGR (2025 - 2035) 3.49%
    Largest Regional Market Share in 2024 North America

    Major Players

    <p>Prestone (US), Zerex (US), Valvoline (US), Shell (GB), Castrol (GB), Total (FR), Motul (FR), Glysantin (DE), BASF (DE)</p>

    Market Trends

    The Automotive Coolant Market is currently experiencing a dynamic evolution, driven by various factors including technological advancements and increasing environmental regulations. The demand for high-performance coolants is on the rise, as consumers and manufacturers alike seek products that enhance engine efficiency and longevity. Furthermore, the shift towards electric vehicles is influencing the types of coolants being developed, as these vehicles require specialized formulations to manage thermal performance effectively. This transition appears to be reshaping the competitive landscape, with traditional coolant manufacturers adapting to meet new requirements. In addition, the growing awareness of sustainability is prompting a shift towards eco-friendly coolant options. Manufacturers are increasingly focusing on biodegradable and non-toxic formulations, which align with global efforts to reduce environmental impact. This trend suggests a potential for innovation within the Automotive Coolant Market, as companies explore alternative materials and production methods. Overall, the market seems poised for growth, with a clear emphasis on performance, sustainability, and adaptation to emerging automotive technologies.

    Rise of Eco-Friendly Coolants

    There is a noticeable trend towards the development and adoption of environmentally friendly coolants. Manufacturers are increasingly formulating products that are biodegradable and non-toxic, responding to consumer demand for sustainable options. This shift not only aligns with global environmental initiatives but also enhances brand reputation among eco-conscious consumers.

    Technological Advancements in Coolant Formulations

    Innovations in coolant technology are becoming more prevalent, with a focus on enhancing thermal efficiency and engine protection. New formulations are being developed to withstand higher temperatures and provide better performance under extreme conditions. This trend indicates a growing emphasis on high-performance products that cater to the needs of modern engines.

    Impact of Electric Vehicles on Coolant Requirements

    The rise of electric vehicles is significantly influencing the Automotive Coolant Market. These vehicles require specialized coolants that can effectively manage battery and motor temperatures. As the market adapts to this shift, manufacturers are likely to invest in research and development to create formulations tailored to the unique needs of electric vehicle technology.

    The automotive coolant market is poised for growth as advancements in engine technology and increasing vehicle production drive demand for high-performance cooling solutions.

    U.S. Department of Energy

    Automotive Coolant Market Market Drivers

    Increasing Vehicle Production

    The automotive industry is witnessing a surge in vehicle production, which directly influences the Automotive Coolant Market. As manufacturers ramp up production to meet consumer demand, the need for high-quality coolants becomes paramount. In 2025, the production of passenger vehicles is projected to reach approximately 80 million units, indicating a robust growth trajectory. This increase in vehicle output necessitates a corresponding rise in coolant supply, as effective temperature regulation is critical for engine performance and longevity. Consequently, manufacturers are focusing on developing advanced coolant formulations that enhance thermal efficiency and protect engine components. The growing emphasis on vehicle performance and reliability is likely to drive the demand for automotive coolants, thereby propelling the Automotive Coolant Market forward.

    Growth of Aftermarket Services

    The expansion of aftermarket services is a notable driver for the Automotive Coolant Market. As vehicles age, the demand for maintenance and replacement parts, including coolants, increases. The aftermarket segment is projected to grow at a compound annual growth rate of around 5% through 2025, reflecting a rising trend in vehicle upkeep. This growth is attributed to the increasing awareness among vehicle owners regarding the importance of regular maintenance to ensure optimal performance and longevity. Consequently, automotive service providers are expanding their offerings to include a variety of coolant options, catering to diverse vehicle requirements. This trend not only boosts the sales of automotive coolants but also enhances the overall market landscape, as consumers seek reliable and effective solutions for their vehicles.

    Stringent Environmental Regulations

    The Automotive Coolant Market is significantly influenced by the implementation of stringent environmental regulations aimed at reducing harmful emissions. Governments across various regions are enforcing laws that mandate the use of eco-friendly coolants, which are less toxic and more sustainable. For instance, regulations concerning the use of ethylene glycol, a common coolant ingredient, have prompted manufacturers to innovate and develop alternatives that comply with environmental standards. The market for bio-based coolants is expected to expand as consumers and manufacturers alike prioritize sustainability. This shift not only aligns with regulatory requirements but also caters to the growing consumer preference for environmentally responsible products. As a result, the Automotive Coolant Market is likely to experience a transformation, with an increasing share of eco-friendly products.

    Rising Popularity of Electric Vehicles

    The rising popularity of electric vehicles (EVs) is emerging as a transformative factor for the Automotive Coolant Market. Although EVs operate differently than traditional internal combustion engine vehicles, they still require effective thermal management solutions. The demand for specialized coolants that can efficiently manage battery temperatures is increasing as more consumers transition to electric mobility. In 2025, it is estimated that the share of electric vehicles in the automotive market will reach approximately 20%, necessitating the development of innovative coolant solutions tailored for EV applications. This shift presents both challenges and opportunities for coolant manufacturers, as they adapt to the unique requirements of electric drivetrains. Consequently, the Automotive Coolant Market is likely to evolve, with a growing emphasis on products that cater to the needs of electric vehicles.

    Technological Innovations in Coolant Formulations

    Technological advancements in coolant formulations are reshaping the Automotive Coolant Market. Innovations such as the development of long-life coolants and advanced synthetic formulations are gaining traction among consumers and manufacturers. These new formulations offer enhanced thermal stability, corrosion resistance, and improved performance under extreme conditions. The market is witnessing a shift towards coolants that can withstand higher temperatures and provide better protection for engine components. As a result, manufacturers are investing in research and development to create cutting-edge products that meet the evolving needs of modern vehicles. This focus on innovation is likely to drive growth in the Automotive Coolant Market, as consumers increasingly seek high-performance solutions that align with their vehicle specifications.

    Market Segment Insights

    By Product: Ethylene Glycol (Largest) vs. Propylene Glycol (Fastest-Growing)

    <p>In the Automotive Coolant Market, the product segment is primarily dominated by Ethylene Glycol, which holds a substantial market share due to its widespread use in a variety of vehicle cooling systems. This chemical is well-regarded for its excellent thermal properties and low-cost advantages, making it the preferred choice among manufacturers and consumers. While Ethylene Glycol remains the largest player, Propylene Glycol has emerged as a significant contender, gaining traction for its non-toxic characteristics and environmental benefits, appealing to a growing market segment focused on sustainability.</p>

    <p>Ethylene Glycol (Dominant) vs. Propylene Glycol (Emerging)</p>

    <p>Ethylene Glycol is recognized for its superior heat transfer properties and is widely utilized in automotive and industrial applications, making it a dominant force in the coolant market. Its affordability and efficiency in lowering freezing points enhance its attractiveness in regions with extreme temperatures. In contrast, Propylene Glycol is making strides as an emerging alternative, especially among eco-conscious consumers and industries. Despite being more expensive, the non-toxic nature of Propylene Glycol positions it as a safer option for both vehicles and the environment. This shift towards safety and sustainability is expected to drive its growth, with manufacturers increasingly investing in its development.</p>

    By Vehicle Type: Passenger Car (Largest) vs. Heavy Commercial Vehicles (Fastest-Growing)

    <p>In the Automotive Coolant Market, the distribution of market share among different vehicle types reveals passenger cars as the largest segment. They account for a significant portion of the overall coolant demand, driven by the high volume of registered vehicles globally and the essential nature of coolant for efficient engine performance. Heavy commercial vehicles follow, albeit at a smaller share, but are gaining traction due to the rise in logistics and transportation requirements in numerous markets.</p>

    <p>Passenger Car (Dominant) vs. Light Commercial Vehicles (Emerging)</p>

    <p>Passenger cars remain the dominant segment in the automotive coolant market largely due to their widespread usage and fundamental role in vehicle maintenance. As urbanization accelerates and disposable incomes rise, the reliance on personal vehicles intensifies. In contrast, light commercial vehicles are emerging as a significant segment, driven by the expanding e-commerce and delivery services sectors. Their specific coolant requirements differ from passenger cars, emphasizing formulations that cater to slightly different performance and durability needs. This divergence creates opportunities for specialized products tailored to the varying demands of light commercial vehicle operators.</p>

    By Technology: IAT (Largest) vs. OAT (Fastest-Growing)

    <p>The Automotive Coolant Market is characterized by distinct segments including Inorganic Additive Technology (IAT), Organic Additive Technology (OAT), and Hybrid Organic Acid Technology (HOAT). Among these, IAT holds a significant proportion of the market due to its extensive use in traditional coolant formulations, catering primarily to older vehicle models. Meanwhile, OAT is gaining traction rapidly, appealing to manufacturers and consumers looking for long-lasting protection and efficiency, thus presenting a notable shift in market dynamics.</p>

    <p>Technology: IAT (Dominant) vs. OAT (Emerging)</p>

    <p>Inorganic Additive Technology (IAT) remains the dominant player in the Automotive Coolant Market, widely recognized for its reliability and effectiveness in preventing corrosion and scaling. It is commonly preferred for older vehicle models thanks to its robust formulation using traditional chemical additives. Conversely, Organic Additive Technology (OAT) is emerging as a modern alternative, gaining popularity due to its environmentally friendly attributes and extended service life. OAT coolants offer superior thermal stability and improved performance in newer vehicles, driving consumer demand. This evolution signifies a shift towards more sustainable cooling solutions, with players in the market adapting to fulfill evolving consumer preferences.</p>

    By End User: OEM (Largest) vs. Automotive Aftermarket (Fastest-Growing)

    <p>In the Automotive Coolant Market, the segmentation between Original Equipment Manufacturer (OEM) and Automotive Aftermarket reveals substantial differences in market share. The OEM segment holds a significant portion of the market as it caters to the manufacturing of vehicles, ensuring that engines run smoothly through the provision of high-quality coolants. In contrast, the Automotive Aftermarket segment, while smaller in share, plays a crucial role in vehicle maintenance and repair, thriving as consumers seek quality products to extend the lifespan of their vehicles.</p>

    <p>OEM (Dominant) vs. Automotive Aftermarket (Emerging)</p>

    <p>The Original Equipment Manufacturer (OEM) segment is characterized by its established presence in the Automotive Coolant Market, providing essential products integrated into vehicle manufacturing. These coolants are typically formulated to meet strict OEM specifications for performance and quality, appealing to vehicle manufacturers aiming for reliability. In contrast, the Automotive Aftermarket segment is emerging strongly as more vehicle owners engage in DIY maintenance and seek to replace their coolant products. This segment offers a wide variety of formulations to suit diverse consumer needs and preferences, thus driving growth through increased demand for accessible and high-performance aftermarket coolants.</p>

    Get more detailed insights about Automotive Coolant Market Research Report – Global Forecast till 2032

    Regional Insights

    North America : Market Leader in Coolants

    North America is the largest market for automotive coolants, holding approximately 40% of the global market share. The region's growth is driven by increasing vehicle production, stringent environmental regulations, and a rising focus on vehicle maintenance. The demand for high-performance coolants is also on the rise, fueled by advancements in automotive technology and consumer awareness regarding vehicle longevity. The United States and Canada are the leading countries in this region, with major players like Prestone, Zerex, and Valvoline dominating the market. The competitive landscape is characterized by a mix of established brands and emerging players, all striving to innovate and meet the evolving needs of consumers. The presence of key manufacturers ensures a robust supply chain and availability of diverse coolant products.

    Europe : Regulatory-Driven Market Growth

    Europe is the second-largest market for automotive coolants, accounting for around 30% of the global market share. The region's growth is significantly influenced by stringent EU regulations aimed at reducing environmental impact and promoting sustainable automotive practices. The increasing adoption of electric vehicles and hybrid technologies is also driving demand for specialized coolants, which are essential for efficient thermal management. Germany, France, and the UK are the leading countries in this market, with key players like BASF, Glysantin, and Total leading the charge. The competitive landscape is marked by innovation, with companies investing in R&D to develop eco-friendly coolant solutions. The presence of established automotive manufacturers further enhances market dynamics, ensuring a steady demand for high-quality coolants.

    Asia-Pacific : Emerging Market Potential

    Asia-Pacific is witnessing rapid growth in the automotive coolant market, holding approximately 25% of the global market share. The region's expansion is driven by increasing vehicle production, rising disposable incomes, and a growing middle class. Additionally, government initiatives to enhance automotive safety and environmental standards are catalyzing demand for high-quality coolants, particularly in countries like China and India. China and India are the leading countries in this region, with a competitive landscape featuring both local and international players. Companies like Shell and Castrol are actively expanding their presence, while local manufacturers are also emerging to cater to the growing demand. The market is characterized by a focus on innovation and cost-effective solutions, ensuring a diverse range of products for consumers.

    Middle East and Africa : Untapped Market Opportunities

    The Middle East and Africa region is gradually emerging in the automotive coolant market, currently holding about 5% of the global market share. The growth is primarily driven by increasing vehicle ownership, urbanization, and a rising focus on vehicle maintenance. Additionally, the region's harsh climatic conditions necessitate the use of high-quality coolants to ensure vehicle performance and longevity, creating a demand for specialized products. Countries like South Africa and the UAE are leading the market in this region, with a competitive landscape that includes both international brands and local manufacturers. The presence of key players is growing, as they seek to tap into the region's potential. The market is characterized by a focus on affordability and accessibility, ensuring that consumers have access to essential automotive products.

    Key Players and Competitive Insights

    The Automotive Coolant Market is currently characterized by a dynamic competitive landscape, driven by increasing vehicle production and a growing emphasis on vehicle maintenance. Key players such as Prestone (US), Valvoline (US), and Shell (GB) are strategically positioning themselves through innovation and regional expansion. Prestone (US) focuses on enhancing product formulations to improve performance and longevity, while Valvoline (US) emphasizes its extensive distribution network to capture a larger market share. Shell (GB) is leveraging its global presence to introduce eco-friendly coolant solutions, reflecting a broader industry trend towards sustainability. Collectively, these strategies contribute to a competitive environment that is increasingly focused on technological advancements and consumer preferences.

    In terms of business tactics, companies are localizing manufacturing to reduce costs and optimize supply chains. The Automotive Coolant Market appears moderately fragmented, with several players vying for market share. This fragmentation allows for niche players to emerge, yet the influence of major companies remains substantial, as they set trends and standards that smaller firms often follow. The collective actions of these key players shape the market structure, fostering an environment where innovation and efficiency are paramount.

    In August 2025, Prestone (US) announced the launch of a new line of environmentally friendly coolants designed to meet the growing demand for sustainable automotive products. This strategic move not only aligns with global sustainability goals but also positions Prestone as a leader in eco-conscious automotive solutions. The introduction of these products is likely to enhance brand loyalty among environmentally aware consumers, thereby strengthening its market position.

    In September 2025, Valvoline (US) expanded its manufacturing capabilities by investing in a new facility in Mexico, aimed at increasing production efficiency and reducing lead times. This expansion is significant as it allows Valvoline to better serve the North American market, responding swiftly to demand fluctuations. The strategic investment underscores Valvoline's commitment to optimizing its supply chain and enhancing its competitive edge in a rapidly evolving market.

    In July 2025, Shell (GB) entered into a partnership with a leading automotive manufacturer to develop a new range of high-performance coolants tailored for electric vehicles. This collaboration is indicative of Shell's forward-thinking approach, as it seeks to capitalize on the growing electric vehicle segment. By aligning its product offerings with the needs of modern vehicles, Shell is likely to enhance its relevance in a market that is increasingly shifting towards electrification.

    As of October 2025, the Automotive Coolant Market is witnessing trends such as digitalization, sustainability, and the integration of artificial intelligence in product development. Strategic alliances are becoming more prevalent, as companies recognize the value of collaboration in driving innovation. The competitive landscape is evolving, with a noticeable shift from price-based competition to a focus on technological advancements and supply chain reliability. This evolution suggests that future differentiation will hinge on the ability to innovate and adapt to changing consumer demands, rather than merely competing on cost.

    Key Companies in the Automotive Coolant Market market include

    Industry Developments

    • Q2 2024: BASF launches new Glysantin® G64 engine coolant for modern engines BASF announced the launch of its new Glysantin® G64 engine coolant, designed to meet the requirements of modern downsized engines and hybrid vehicles, expanding its product portfolio in the automotive coolant sector.
    • Q2 2024: Valvoline Inc. Announces Opening of New Manufacturing Facility in China Valvoline Inc. opened a new manufacturing facility in China to increase production capacity for automotive coolants and lubricants, aiming to meet growing demand in the Asia-Pacific region.
    • Q3 2024: Chevron and Cummins announce partnership to develop next-generation engine coolants Chevron and Cummins entered a strategic partnership to co-develop advanced engine coolants tailored for high-efficiency commercial vehicles, focusing on improved thermal management and sustainability.
    • Q3 2024: Prestone Launches EV-Specific Coolant for Battery Thermal Management Prestone introduced a new coolant product specifically formulated for electric vehicle battery thermal management systems, targeting the growing EV market.
    • Q4 2024: TotalEnergies inaugurates new research center for automotive fluids in France TotalEnergies opened a new research and development center in France dedicated to automotive fluids, including coolants, to accelerate innovation for next-generation vehicles.
    • Q4 2024: Old World Industries Expands Distribution Agreement with AutoZone Old World Industries, maker of PEAK coolants, expanded its distribution agreement with AutoZone, increasing the availability of its coolant products across North America.
    • Q1 2025: Shell launches bio-based coolant for commercial vehicle fleets Shell introduced a new bio-based automotive coolant aimed at commercial vehicle fleets, emphasizing reduced environmental impact and compliance with new sustainability standards.
    • Q1 2025: ExxonMobil appoints new Vice President for Global Automotive Fluids ExxonMobil announced the appointment of a new Vice President to lead its global automotive fluids division, including the coolant business, as part of its strategy to strengthen market leadership.
    • Q2 2025: Clariant and Mahle sign agreement to co-develop sustainable engine coolants Clariant and Mahle signed a collaboration agreement to jointly develop sustainable engine coolant solutions for next-generation internal combustion and hybrid vehicles.
    • Q2 2025: BASF to invest €50 million in coolant production expansion in Germany BASF announced a €50 million investment to expand its coolant production facility in Germany, aiming to increase output and support growing demand in Europe.
    • Q3 2025: Valvoline secures supply contract with major European automaker for advanced coolants Valvoline secured a multi-year supply contract with a leading European automaker to provide advanced engine coolants for new vehicle models.
    • Q3 2025: PETRONAS launches new long-life coolant for heavy-duty vehicles PETRONAS introduced a new long-life coolant product designed for heavy-duty commercial vehicles, offering extended service intervals and enhanced engine protection.

    Future Outlook

    Automotive Coolant Market Future Outlook

    <p>The Automotive Coolant Market is projected to grow at a 3.49% CAGR from 2024 to 2035, driven by increasing vehicle production, technological advancements, and environmental regulations.</p>

    New opportunities lie in:

    • <p>Development of eco-friendly coolant formulations</p>
    • <p>Expansion into emerging markets with tailored products</p>
    • <p>Integration of smart coolant monitoring systems for fleet management</p>

    <p>By 2035, the market is expected to achieve robust growth, reflecting evolving consumer and regulatory demands.</p>

    Market Segmentation

    Automotive Coolant Market Product Outlook

    • Ethylene Glycol
    • Propylene Glycol
    • Glycerin
    • Others

    Automotive Coolant Market End User Outlook

    • Original Equipment Manufacturer (OEM)
    • Automotive Aftermarket

    Automotive Coolant Market Technology Outlook

    • Inorganic Additive Technology (IAT)
    • Organic Additive Technology (OAT)
    • Hybrid Organic Acid Technology (HOAT)

    Automotive Coolant Market Vehicle Type Outlook

    • Passenger Car
    • Heavy Commercial Vehicles
    • Light Commercial Vehicles
    • Others

    Report Scope

    MARKET SIZE 20247.89(USD Billion)
    MARKET SIZE 20258.166(USD Billion)
    MARKET SIZE 203511.51(USD Billion)
    COMPOUND ANNUAL GROWTH RATE (CAGR)3.49% (2024 - 2035)
    REPORT COVERAGERevenue Forecast, Competitive Landscape, Growth Factors, and Trends
    BASE YEAR2024
    Market Forecast Period2025 - 2035
    Historical Data2019 - 2024
    Market Forecast UnitsUSD Billion
    Key Companies ProfiledMarket analysis in progress
    Segments CoveredMarket segmentation analysis in progress
    Key Market OpportunitiesGrowing demand for eco-friendly automotive coolants driven by regulatory changes and consumer preferences.
    Key Market DynamicsRising demand for eco-friendly automotive coolants driven by stringent environmental regulations and consumer preferences.
    Countries CoveredNorth America, Europe, APAC, South America, MEA

    Market Highlights

    Author

    Anshula Mandaokar
    Team Lead - Research

    She holds an experience of about 6+ years in market research and business consulting, working under the spectrum of information communication technology, telecommunications and semiconductor domains. aarti conceptualizes and implements a scalable business strategy and provides strategic leadership to the clients. her expertise lies in market estimation, competitive intelligence, pipeline analysis, customer assessment, etc.

    Leave a Comment

    Latest Comments

    John Doe
    john@example.com

    This is a great article! Really helped me understand the topic better.

    Posted on July 23, 2025, 10:15 AM
    Jane Smith
    jane@domain.com

    Thanks for sharing this. I’ve bookmarked it for later reference.

    Posted on July 22, 2025, 7:45 PM

    FAQs

    What is the projected market valuation of the Automotive Coolant Market by 2035?

    The Automotive Coolant Market is projected to reach a valuation of 11.51 USD Billion by 2035.

    What was the market valuation of the Automotive Coolant Market in 2024?

    In 2024, the Automotive Coolant Market was valued at 7.89 USD Billion.

    What is the expected CAGR for the Automotive Coolant Market during the forecast period 2025 - 2035?

    The expected CAGR for the Automotive Coolant Market during the forecast period 2025 - 2035 is 3.49%.

    Which product segment is anticipated to have the highest valuation by 2035?

    By 2035, the Ethylene Glycol segment is anticipated to reach a valuation of 5.2 USD Billion.

    What is the projected valuation for the Automotive Aftermarket segment by 2035?

    The Automotive Aftermarket segment is projected to reach a valuation of 5.84 USD Billion by 2035.

    Which technology segment is expected to grow significantly by 2035?

    The Organic Additive Technology (OAT) segment is expected to grow significantly, reaching 4.5 USD Billion by 2035.

    What is the anticipated valuation for the Heavy Commercial Vehicles segment by 2035?

    The Heavy Commercial Vehicles segment is anticipated to reach a valuation of 2.2 USD Billion by 2035.

    Who are the key players in the Automotive Coolant Market?

    Key players in the Automotive Coolant Market include Prestone, Zerex, Valvoline, Shell, Castrol, Total, Motul, Glysantin, and BASF.

    1. EXECUTIVE SUMMARY
      1. \r\n1.1 MARKET ATTRACTIVENESS ANALYSIS 23
      2. \r\n1.1.1
    2. GLOBAL AUTOMOTIVE COOLANT MARKET, BY TECHNOLOGY 24
      1. \r\n1.1.2 GLOBAL AUTOMOTIVE
    3. COOLANT MARKET, BY PRODUCT 25
      1. \r\n1.1.3 GLOBAL AUTOMOTIVE COOLANT MARKET,
      2. BY VEHICLE TYPE 26
    4. \r\n1.1.4 GLOBAL AUTOMOTIVE COOLANT MARKET, BY END USE
      1. 27
    5. \r\n1.1.5 GLOBAL AUTOMOTIVE COOLANT MARKET, BY REGION 28
      1. \r\n2 MARKET
      2. INTRODUCTION
      3. \r\n2.1 DEFINITION 29
      4. \r\n2.2 SCOPE OF THE STUDY 29
      5. \r\n2.3
      6. MARKET STRUCTURE 29
      7. \r\n3 RESEARCH METHODOLOGY
      8. \r\n3.1 RESEARCH PROCESS
      9. 30
      10. \r\n3.2 PRIMARY RESEARCH 31
      11. \r\n3.3 SECONDARY RESEARCH 31
      12. \r\n3.4
      13. MARKET SIZE ESTIMATION 32
      14. \r\n3.5 FORECAST MODEL 34
      15. \r\n3.6 LIST OF
      16. ASSUMPTIONS 34
      17. \r\n4 MARKET DYNAMICS
      18. \r\n4.1 INTRODUCTION 35
      19. \r\n4.2
      20. DRIVERS 37
      21. \r\n4.2.1 INCREASING DEMAND IN THE GLOBAL AUTOMOTIVE AFTERMARKET
      22. 37
      23. \r\n4.2.2 GROWING SALE OF COMMERCIAL VEHICLES ACROSS THE GLOBE 38
      24. \r\n4.2.3
      25. DRIVERS IMPACT ANALYSIS 40
      26. \r\n4.3 RESTRAINTS 41
      27. \r\n4.3.1 VOLATILE
      28. RAW MATERIAL (CRUDE OIL) PRICES 41
      29. \r\n4.3.2 RESTRAINTS IMPACT ANALYSIS 42
      30. \r\n4.4
      31. OPPORTUNITIES 42
      32. \r\n4.4.1 EXPANDING AUTOMOTIVE INDUSTRY IN LATIN AMERICA
      33. AND THE MIDDLE EAST 42
      34. \r\n4.5 CHALLENGES 43
      35. \r\n4.5.1 INCREASING ADOPTION
      36. OF ELECTRIC VEHICLES 43
      37. \r\n5 MARKET FACTOR ANALYSIS
      38. \r\n5.1 SUPPLY
      39. CHAIN ANALYSIS 45
      40. \r\n5.1.1 RAW MATERIALS SUPPLIERS 46
      41. \r\n5.1.1.1 RAW
      42. MATERIAL SUPPLIERS OF ETHYLENE GLYCOL 46
      43. \r\n5.1.1.2 RAW MATERIAL SUPPLIERS
      44. OF PROPYLENE GLYCOL 46
      45. \r\n5.1.2 AUTOMOTIVE COOLANT PRODUCERS 46
      46. \r\n5.1.3
      47. DISTRIBUTION CHANNELS 46
      48. \r\n5.1.4 END USE 47
      49. \r\n5.2 PORTER’S
      50. FIVE FORCES MODEL 48
      51. \r\n5.2.1 THREAT OF NEW ENTRANTS 49
      52. \r\n5.2.2 RIVALRY
      53. 49
      54. \r\n5.2.3 THREAT OF SUBSTITUTES 49
      55. \r\n5.2.4 BARGAINING POWER OF
      56. SUPPLIERS 49
      57. \r\n5.2.5 BARGAINING POWER OF BUYERS 50
      58. \r\n5.3 PRICING
      59. ANALYSIS – BY REGION (USD/GALLON), 2023 50
      60. \r\n5.4 GLOBAL AUTOMOTIVE
      61. SALES AND PRODUCTION OVERVIEW (2023-2032) 50
      62. \r\n5.5 REGULATORY CONTEXT 51
      63. \r\n5.5.1
      64. STANDARD SPECIFICATION FOR GLYCOL BASE ENGINE COOLANT FOR AUTOMOBILE AND LIGHT-DUTY
      65. SERVICE 51
      66. \r\n5.6 IMPACT OF COVID-19 53
      67. \r\n6 GLOBAL AUTOMOTIVE COOLANTS
    6. MARKET, BY TECHNOLOGY
      1. \r\n6.1 OVERVIEW 56
      2. \r\n6.1.1 AUTOMOTIVE COOLANTS:
      3. MARKET ESTIMATES & FORECAST BY TECHNOLOGY, 2023-2032 57
      4. \r\n6.1.2 AUTOMOTIVE
      5. COOLANTS: MARKET ESTIMATES & FORECAST BY TECHNOLOGY, 2023-2032 58
      6. \r\n6.2
      7. INORGANIC ADDITIVE TECHNOLOGY (IAT) 59
      8. \r\n6.2.1 INORGANIC ADDITIVE TECHNOLOGY
      9. (IAT): MARKET ESTIMATES & FORECAST BY REGION,2023-2032 59
      10. \r\n6.3 ORGANIC
      11. ADDITIVE TECHNOLOGY (OAT) 60
      12. \r\n6.3.1 ORGANIC ADDITIVE TECHNOLOGY (OAT):
      13. MARKET ESTIMATES & FORECAST BY REGION,2023-2032 61
      14. \r\n6.4 HYBRID ORGANIC
      15. ACID TECHNOLOGY (HOAT) 62
      16. \r\n6.4.1 HYBRID ORGANIC ACID TECHNOLOGY (HOAT):
      17. MARKET ESTIMATES & FORECAST BY REGION,2023-2032 62
      18. \r\n7 GLOBAL AUTOMOTIVE
    7. COOLANTS MARKET, BY PRODUCT
      1. \r\n7.1 OVERVIEW 64
      2. \r\n7.1.1 AUTOMOTIVE
      3. COOLANTS: MARKET ESTIMATES & FORECAST BY PRODUCT, 2023-2032 65
      4. \r\n7.1.2
      5. AUTOMOTIVE COOLANTS: MARKET ESTIMATES & FORECAST BY PRODUCT, 2023-2032 66
      6. \r\n7.2
      7. ETHYLENE GLYCOL 67
      8. \r\n7.2.1 ETHYLENE GLYCOL: MARKET ESTIMATES & FORECAST
      9. BY REGION, 2023-2032 67
      10. \r\n7.3 PROPYLENE GLYCOL 68
      11. \r\n7.3.1 PROPYLENE
      12. GLYCOL: MARKET ESTIMATES & FORECAST BY REGION, 2023-2032 69
      13. \r\n7.4 GLYCERIN
      14. 70
      15. \r\n7.4.1 GLYCERIN: MARKET ESTIMATES & FORECAST BY REGION, 2023-2032
      16. 70
      17. \r\n7.5 OTHERS 71
      18. \r\n7.5.1 OTHERS: MARKET ESTIMATES & FORECAST
      19. BY REGION, 2023-2032 71
    8. \r\n8 GLOBAL AUTOMOTIVE COOLANTS MARKET, BY VEHICLE
      1. TYPE
      2. \r\n8.1 OVERVIEW 73
      3. \r\n8.1.1 AUTOMOTIVE COOLANTS: MARKET ESTIMATES
      4. & FORECAST BY VEHICLE TYPE, 2023-2032 74
      5. \r\n8.1.2 AUTOMOTIVE COOLANTS:
      6. MARKET ESTIMATES & FORECAST BY VEHICLE TYPE, 2023-2032 75
      7. \r\n8.2 PASSENGER
      8. CARS 76
      9. \r\n8.2.1 PASSENGER CARS: MARKET ESTIMATES & FORECAST BY REGION,
      10. \r\n8.2.2 PASSENGER CARS: MARKET ESTIMATES & FORECAST BY
      11. REGION, 2023-2032 77
      12. \r\n8.3 HEAVY COMMERCIAL VEHICLES 77
      13. \r\n8.3.1
      14. HEAVY COMMERCIAL VEHICLES: MARKET ESTIMATES & FORECAST BY REGION, 2023-2032
      15. 78
      16. \r\n8.3.2 HEAVY COMMERCIAL VEHICLES: MARKET ESTIMATES & FORECAST BY
      17. REGION, 2023-2032 78
      18. \r\n8.4 LIGHT COMMERCIAL VEHICLES 79
      19. \r\n8.4.1
      20. LIGHT COMMERCIAL VEHICLES: MARKET ESTIMATES & FORECAST BY REGION, 2023-2032
      21. 79
      22. \r\n8.4.2 LIGHT COMMERCIAL VEHICLES: MARKET ESTIMATES & FORECAST BY
      23. REGION, 2023-2032 80
      24. \r\n8.5 OTHERS 80
      25. \r\n8.5.1 OTHERS: MARKET ESTIMATES
      26. & FORECAST BY REGION, 2023-2032 80
      27. \r\n8.5.2 OTHERS: MARKET ESTIMATES
      28. & FORECAST BY REGION, 2023-2032 81
      29. \r\n9 GLOBAL AUTOMOTIVE COOLANTS MARKET,
      30. BY END USER
      31. \r\n9.1 OVERVIEW 82
      32. \r\n9.1.1 AUTOMOTIVE COOLANTS: MARKET
      33. ESTIMATES & FORECAST BY END USER, 2023-2032 83
      34. \r\n9.1.2 AUTOMOTIVE COOLANTS:
      35. MARKET ESTIMATES & FORECAST BY END USER, 2023-2032 84
      36. \r\n9.2 ORIGINAL
      37. EQUIPMENT MANUFACTURER (OEM) 85
      38. \r\n9.2.1 ORIGINAL EQUIPMENT MANUFACTURER
      39. (OEM): MARKET ESTIMATES & FORECAST BY REGION, 2023-2032 85
      40. \r\n9.2.2 ORIGINAL
      41. EQUIPMENT MANUFACTURER (OEM): MARKET ESTIMATES & FORECAST BY REGION, 2023-2032
      42. 86
      43. \r\n9.3 AUTOMOTIVE AFTERMARKET 86
      44. \r\n9.3.1 AUTOMOTIVE AFTERMARKET:
      45. MARKET ESTIMATES & FORECAST BY REGION, 2023-2032 87
      46. \r\n9.3.2 AUTOMOTIVE
      47. AFTERMARKET: MARKET ESTIMATES & FORECAST BY REGION, 2023-2032 87
      48. \r\n10
    9. GLOBAL AUTOMOTIVE COOLANTS MARKET, BY REGION
      1. \r\n10.1 OVERVIEW 88
      2. \r\n10.2
      3. NORTH AMERICA 91
      4. \r\n10.2.1 US 96
      5. \r\n10.2.2 CANADA 100
      6. \r\n10.3
      7. EUROPE 105
      8. \r\n10.3.1 GERMANY 111
      9. \r\n10.3.2 UK 115
      10. \r\n10.3.3
      11. FRANCE 119
      12. \r\n10.3.4 SPAIN 123
      13. \r\n10.3.5 ITALY 127
      14. \r\n10.3.6
      15. RUSSIA 131
      16. \r\n10.3.7 BENELUX 135
      17. \r\n10.3.8 POLAND 139
      18. \r\n10.3.9
      19. REST OF EUROPE 143
      20. \r\n10.4 ASIA-PACIFIC 148
      21. \r\n10.4.1 CHINA 154
      22. \r\n10.4.2
      23. JAPAN 158
      24. \r\n10.4.3 INDIA 162
      25. \r\n10.4.4 AUSTRALIA AND NEW ZEALAND
      26. 166
      27. \r\n10.4.5 INDONESIA 170
      28. \r\n10.4.6 SOUTH KOREA 174
      29. \r\n10.4.7
      30. THAILAND 178
      31. \r\n10.4.8 REST OF ASIA-PACIFIC 182
      32. \r\n10.5 MIDDLE EAST
      33. & AFRICA 186
      34. \r\n10.5.1 GCC 191
      35. \r\n10.5.2 TURKEY 195
      36. \r\n10.5.3
      37. SOUTH AFRICA 199
      38. \r\n10.5.4 REST OF THE MIDDLE EAST & AFRICA 203
      39. \r\n10.6
      40. LATIN AMERICA 207
      41. \r\n10.6.1 BRAZIL 213
      42. \r\n10.6.2 MEXICO 217
      43. \r\n10.6.3
      44. ARGENTINA 221
      45. \r\n10.6.4 REST OF LATIN AMERICA 225
      46. \r\n11 COMPETITIVE
      47. LANDSCAPE
      48. \r\n11.1 COMPETITIVE OVERVIEW 229
      49. \r\n11.2 GLOBAL MARKET STRATEGY
      50. ANALYSIS 229
      51. \r\n11.3 KEY DEVELOPMENTS 230
      52. \r\n11.4 COMPETITIVE BENCHMARKING
      53. 232
      54. \r\n12 COMPANY PROFILES
      55. \r\n12.1 VALVOLINE INC. 233
      56. \r\n12.1.1
      57. COMPANY OVERVIEW 233
      58. \r\n12.1.2 FINANCIAL OVERVIEW 234
      59. \r\n12.1.3 PRODUCTS
      60. OFFERED 235
      61. \r\n12.1.4 KEY DEVELOPMENTS 235
      62. \r\n12.1.5 SWOT ANALYSIS
      63. 236
      64. \r\n12.1.6 KEY STRATEGIES 236
      65. \r\n12.2 EXXONMOBIL CORPORATION 237
      66. \r\n12.2.1
      67. COMPANY OVERVIEW 237
      68. \r\n12.2.2 FINANCIAL OVERVIEW 237
      69. \r\n12.2.3 PRODUCTS
      70. OFFERED 238
      71. \r\n12.2.4 KEY DEVELOPMENTS 238
      72. \r\n12.2.5 SWOT ANALYSIS
      73. 238
      74. \r\n12.2.6 KEY STRATEGIES 239
      75. \r\n12.3 BASF SE 240
      76. \r\n12.3.1
      77. COMPANY OVERVIEW 240
      78. \r\n12.3.2 FINANCIAL OVERVIEW 241
      79. \r\n12.3.3 PRODUCTS
      80. OFFERED 242
      81. \r\n12.3.4 KEY DEVELOPMENTS 242
      82. \r\n12.3.5 SWOT ANALYSIS
      83. 243
      84. \r\n12.3.6 KEY STRATEGIES 243
      85. \r\n12.4 TOTAL 244
      86. \r\n12.4.1
      87. COMPANY OVERVIEW 244
      88. \r\n12.4.2 FINANCIAL OVERVIEW 245
      89. \r\n12.4.3 PRODUCTS
      90. OFFERED 246
      91. \r\n12.4.4 KEY DEVELOPMENTS 246
      92. \r\n12.4.5 SWOT ANALYSIS
      93. 247
      94. \r\n12.4.6 KEY STRATEGIES 247
      95. \r\n12.5 CHEVRON CORPORATION 248
      96. \r\n12.5.1
      97. COMPANY OVERVIEW 248
      98. \r\n12.5.2 FINANCIAL OVERVIEW 249
      99. \r\n12.5.3 PRODUCTS
      100. OFFERED 250
      101. \r\n12.5.4 KEY DEVELOPMENTS 250
      102. \r\n12.5.5 SWOT ANALYSIS
      103. 251
      104. \r\n12.5.6 KEY STRATEGIES 251
      105. \r\n12.6 ROYAL DUTCH SHELL PLC 252
      106. \r\n12.6.1
      107. COMPANY OVERVIEW 252
      108. \r\n12.6.2 FINANCIAL OVERVIEW 253
      109. \r\n12.6.3 PRODUCTS
      110. OFFERED 254
      111. \r\n12.6.4 KEY DEVELOPMENTS 254
      112. \r\n12.6.5 SWOT ANALYSIS
      113. 255
      114. \r\n12.6.6 KEY STRATEGIES 255
      115. \r\n12.7 OLD WORLD INDUSTRIES, LLC
      116. 256
      117. \r\n12.7.1 COMPANY OVERVIEW 256
      118. \r\n12.7.2 FINANCIAL OVERVIEW 256
      119. \r\n12.7.3
      120. PRODUCTS OFFERED 256
      121. \r\n12.7.4 KEY DEVELOPMENTS 257
      122. \r\n12.7.5 SWOT
      123. ANALYSIS 258
      124. \r\n12.7.6 KEY STRATEGIES 258
      125. \r\n12.8 PRESTONE PRODUCTS
      126. CORPORATION 259
      127. \r\n12.8.1 COMPANY OVERVIEW 259
      128. \r\n12.8.2 FINANCIAL
      129. OVERVIEW 259
      130. \r\n12.8.3 PRODUCTS OFFERED 259
      131. \r\n12.8.4 KEY DEVELOPMENTS
      132. 260
      133. \r\n12.8.5 SWOT ANALYSIS 260
      134. \r\n12.8.6 KEY STRATEGIES 261
      135. \r\n12.9
      136. ARTECO 262
      137. \r\n12.9.1 COMPANY OVERVIEW 262
      138. \r\n12.9.2 FINANCIAL OVERVIEW
      139. 262
      140. \r\n12.9.3 PRODUCTS OFFERED 263
      141. \r\n12.9.4 KEY DEVELOPMENTS 263
      142. \r\n12.9.5
      143. SWOT ANALYSIS 264
      144. \r\n12.9.6 KEY STRATEGIES 264
      145. \r\n12.10 RECOCHEM CORPORATION
      146. 265
      147. \r\n12.10.1 COMPANY OVERVIEW 265
      148. \r\n12.10.2 FINANCIAL OVERVIEW
      149. 265
      150. \r\n12.10.3 PRODUCTS OFFERED 266
      151. \r\n12.10.4 KEY DEVELOPMENTS 267
      152. \r\n12.10.5
      153. SWOT ANALYSIS 268
      154. \r\n12.10.6 KEY STRATEGIES 268
      155. \r\n12.11 AMSOIL INC.
      156. 269
      157. \r\n12.11.1 COMPANY OVERVIEW 269
      158. \r\n12.11.2 FINANCIAL OVERVIEW
      159. 269
      160. \r\n12.11.3 PRODUCTS OFFERED 269
      161. \r\n12.11.4 KEY DEVELOPMENTS 269
      162. \r\n12.11.5
      163. SWOT ANALYSIS 270
      164. \r\n12.11.6 KEY STRATEGIES 270
      165. \r\n12.12 MOTUL 271
      166. \r\n12.12.1
      167. COMPANY OVERVIEW 271
      168. \r\n12.12.2 FINANCIAL OVERVIEW 271
      169. \r\n12.12.3
      170. PRODUCTS OFFERED 271
      171. \r\n12.12.4 KEY DEVELOPMENTS 272
      172. \r\n12.12.5 SWOT
      173. ANALYSIS 272
      174. \r\n12.12.6 KEY STRATEGIES 272
      175. \r\n13 APPENDIX
      176. \r\n13.1
      177. REFERENCES 273
      178. \r\n13.2 RELATED REPORTS 274
      179. \r\n14 LIST OF TABLES
      180. \r\nTABLE
    10. LIST OF ASSUMPTIONS 34
      1. \r\nTABLE 2 NUMBER OF UNITS SOLD, 2023-2032 50
      2. \r\nTABLE
    11. NUMBER OF UNITS PRODUCED, 2023-2032 50
      1. \r\nTABLE 4 PHYSICAL AND CHEMICAL
      2. REQUIREMENTS FOR CONCENTRATES 52
      3. \r\nTABLE 5 PHYSICAL AND CHEMICAL REQUIREMENTS
      4. FOR PREDILUTE 52
      5. \r\nTABLE 6 AUTOMOTIVE COOLANTS MARKET ESTIMATES & FORECAST,
      6. BY TECHNOLOGY, 2023-2032 (USD MILLION) 57
      7. \r\nTABLE 7 AUTOMOTIVE COOLANTS
    12. MARKET ESTIMATES & FORECAST, BY TECHNOLOGY, 2023-2032 (MILLION GALLONS) 58
      1. \r\nTABLE
    13. INORGANIC ADDITIVE TECHNOLOGY (IAT) MARKET ESTIMATES & FORECAST, BY REGION,
      1. \r\nTABLE 9 INORGANIC ADDITIVE TECHNOLOGY (IAT)
    14. MARKET ESTIMATES & FORECAST, BY REGION, 2023-2032 (MILLION GALLONS) 60
      1. \r\nTABLE
    15. ORGANIC ADDITIVE TECHNOLOGY (OAT) MARKET ESTIMATES & FORECAST, BY REGION,
      1. \r\nTABLE 11 ORGANIC ADDITIVE TECHNOLOGY (OAT)
    16. MARKET ESTIMATES & FORECAST, BY REGION, 2023-2032 (MILLION GALLONS) 61
      1. \r\nTABLE
    17. HYBRID ORGANIC ACID TECHNOLOGY (HOAT) MARKET ESTIMATES & FORECAST, BY REGION,
      1. \r\nTABLE 13 HYBRID ORGANIC ACID TECHNOLOGY (HOAT)
    18. MARKET ESTIMATES & FORECAST, BY REGION, 2023-2032 (MILLION GALLONS) 63
      1. \r\nTABLE
    19. AUTOMOTIVE COOLANTS MARKET ESTIMATES & FORECAST, BY PRODUCT, 2023-2032 (USD
      1. MILLION) 65
      2. \r\nTABLE 15 AUTOMOTIVE COOLANTS MARKET ESTIMATES & FORECAST,
      3. BY PRODUCT, 2023-2032 (MILLION GALLONS) 66
      4. \r\nTABLE 16 ETHYLENE GLYCOL MARKET
      5. ESTIMATES & FORECAST, BY REGION, 2023-2032 (USD MILLION) 67
      6. \r\nTABLE
    20. ETHYLENE GLYCOL MARKET ESTIMATES & FORECAST, BY REGION, 2023-2032 (MILLION
      1. GALLONS) 68
      2. \r\nTABLE 18 PROPYLENE GLYCOL MARKET ESTIMATES & FORECAST,
      3. BY REGION, 2023-2032 (USD MILLION) 69
      4. \r\nTABLE 19 PROPYLENE GLYCOL MARKET
      5. ESTIMATES & FORECAST, BY REGION, 2023-2032 (MILLION GALLONS) 69
      6. \r\nTABLE
    21. GLYCERIN MARKET ESTIMATES & FORECAST, BY REGION, 2023-2032 (USD MILLION)
      1. 70
    22. \r\nTABLE 21 GLYCERIN MARKET ESTIMATES & FORECAST, BY REGION, 2023-2032
      1. (MILLION GALLONS) 71
      2. \r\nTABLE 22 OTHERS MARKET ESTIMATES & FORECAST,
      3. BY REGION, 2023-2032 (USD MILLION) 71
      4. \r\nTABLE 23 OTHERS MARKET ESTIMATES
      5. & FORECAST, BY REGION, 2023-2032 (MILLION GALLONS) 72
      6. \r\nTABLE 24 AUTOMOTIVE
    23. COOLANTS MARKET ESTIMATES & FORECAST, BY VEHICLE TYPE, 2023-2032 (USD MILLION)
      1. 74
    24. \r\nTABLE 25 AUTOMOTIVE COOLANTS MARKET ESTIMATES & FORECAST, BY VEHICLE
      1. TYPE, 2023-2032 (MILLION GALLONS) 75
      2. \r\nTABLE 26 PASSENGER CARS MARKET ESTIMATES
      3. & FORECAST, BY REGION, 2023-2032 (USD MILLION) 76
      4. \r\nTABLE 27 PASSENGER
    25. CARS MARKET ESTIMATES & FORECAST, BY REGION, 2023-2032 (MILLION GALLONS) 77
      1. \r\nTABLE
    26. HEAVY COMMERCIAL VEHICLES MARKET ESTIMATES & FORECAST, BY REGION, 2023-2032
      1. (USD MILLION) 78
      2. \r\nTABLE 29 HEAVY COMMERCIAL VEHICLES MARKET ESTIMATES &
      3. FORECAST, BY REGION, 2023-2032 (MILLION GALLONS) 78
      4. \r\nTABLE 30 LIGHT COMMERCIAL
    27. VEHICLES MARKET ESTIMATES & FORECAST, BY REGION, 2023-2032 (USD MILLION) 79
      1. \r\nTABLE
    28. LIGHT COMMERCIAL VEHICLES MARKET ESTIMATES & FORECAST, BY REGION, 2023-2032
      1. (MILLION GALLONS) 80
      2. \r\nTABLE 32 OTHERS MARKET ESTIMATES & FORECAST,
      3. BY REGION, 2023-2032 (USD MILLION) 80
      4. \r\nTABLE 33 OTHERS MARKET ESTIMATES
      5. & FORECAST, BY REGION, 2023-2032 (MILLION GALLONS) 81
      6. \r\nTABLE 34 AUTOMOTIVE
    29. COOLANTS MARKET ESTIMATES & FORECAST, BY END USER, 2023-2032 (USD MILLION) 83
      1. \r\nTABLE
    30. AUTOMOTIVE COOLANTS MARKET ESTIMATES & FORECAST, BY END USER, 2023-2032 (MILLION
      1. GALLONS) 84
      2. \r\nTABLE 36 ORIGINAL EQUIPMENT MANUFACTURER (OEM) MARKET ESTIMATES
      3. & FORECAST, BY REGION, 2023-2032 (USD MILLION) 85
      4. \r\nTABLE 37 ORIGINAL
    31. EQUIPMENT MANUFACTURER (OEM) MARKET ESTIMATES & FORECAST, BY REGION, 2023-2032
      1. (MILLION GALLONS) 86
      2. \r\nTABLE 38 AUTOMOTIVE AFTERMARKET MARKET ESTIMATES
      3. & FORECAST, BY REGION, 2023-2032 (USD MILLION) 87
      4. \r\nTABLE 39 AUTOMOTIVE
    32. AFTERMARKET MARKET ESTIMATES & FORECAST, BY REGION, 2023-2032 (MILLION GALLONS)
      1. 87
    33. \r\nTABLE 40 GLOBAL AUTOMOTIVE COOLANTS MARKET, BY REGION, 2023-2032 (USD
      1. MILLION) 89
    34. \r\nTABLE 41 GLOBAL AUTOMOTIVE COOLANTS MARKET, BY REGION, 2023-2032
      1. (MILLION GALLONS) 90
      2. \r\nTABLE 42 NORTH AMERICA: AUTOMOTIVE COOLANTS MARKET,
      3. BY COUNTRY, 2023-2032 (USD MILLION) 91
      4. \r\nTABLE 43 NORTH AMERICA: AUTOMOTIVE
    35. COOLANTS MARKET, BY COUNTRY, 2023-2032 (MILLION GALLONS) 92
      1. \r\nTABLE 44 NORTH
    36. AMERICA: AUTOMOTIVE COOLANTS MARKET, BY TECHNOLOGY, 2023-2032 (USD MILLION) 92
      1. \r\nTABLE
    37. NORTH AMERICA: AUTOMOTIVE COOLANTS MARKET, BY TECHNOLOGY, 2023-2032 (MILLION
      1. GALLONS) 93
    38. \r\nTABLE 46 NORTH AMERICA: AUTOMOTIVE COOLANTS MARKET, BY PRODUCT,
      1. \r\nTABLE 47 NORTH AMERICA: AUTOMOTIVE COOLANTS
    39. MARKET, BY PRODUCT, 2023-2032 (MILLION GALLONS) 94
      1. \r\nTABLE 48 NORTH AMERICA:
    40. AUTOMOTIVE COOLANTS MARKET, BY VEHICLE TYPE, 2023-2032 (USD MILLION) 94
      1. \r\nTABLE
    41. NORTH AMERICA: AUTOMOTIVE COOLANTS MARKET, BY VEHICLE TYPE, 2023-2032 (MILLION
      1. GALLONS) 95
    42. \r\nTABLE 50 NORTH AMERICA: AUTOMOTIVE COOLANTS MARKET, BY END
      1. USER, 2023-2032 (USD MILLION) 95
      2. \r\nTABLE 51 NORTH AMERICA: AUTOMOTIVE COOLANTS
    43. MARKET, BY END USER, 2023-2032 (MILLION GALLONS) 96
      1. \r\nTABLE 52 US: AUTOMOTIVE
    44. COOLANTS MARKET, BY TECHNOLOGY, 2023-2032 (USD MILLION) 96
      1. \r\nTABLE 53 US:
    45. AUTOMOTIVE COOLANTS MARKET, BY TECHNOLOGY, 2023-2032 (MILLION GALLONS) 97
      1. \r\nTABLE
    46. US: AUTOMOTIVE COOLANTS MARKET, BY PRODUCT, 2023-2032 (USD MILLION) 97
      1. \r\nTABLE
    47. US: AUTOMOTIVE COOLANTS MARKET, BY PRODUCT, 2023-2032 (MILLION GALLONS) 98
      1. \r\nTABLE
    48. US: AUTOMOTIVE COOLANTS MARKET, BY VEHICLE TYPE, 2023-2032 (USD MILLION) 98
      1. \r\nTABLE
    49. US: AUTOMOTIVE COOLANTS MARKET, BY VEHICLE TYPE, 2023-2032 (MILLION GALLONS)
      1. 99
    50. \r\nTABLE 58 US: AUTOMOTIVE COOLANTS MARKET, BY END USER, 2023-2032 (USD
      1. MILLION) 99
    51. \r\nTABLE 59 US: AUTOMOTIVE COOLANTS MARKET, BY END USER, 2023-2032
      1. (MILLION GALLONS) 100
      2. \r\nTABLE 60 CANADA: AUTOMOTIVE COOLANTS MARKET, BY
      3. TECHNOLOGY, 2023-2032 (USD MILLION) 100
      4. \r\nTABLE 61 CANADA: AUTOMOTIVE COOLANTS
    52. MARKET, BY TECHNOLOGY, 2023-2032 (MILLION GALLONS) 101
      1. \r\nTABLE 62 CANADA:
    53. AUTOMOTIVE COOLANTS MARKET, BY PRODUCT, 2023-2032 (USD MILLION) 101
      1. \r\nTABLE
    54. CANADA: AUTOMOTIVE COOLANTS MARKET, BY PRODUCT, 2023-2032 (MILLION GALLONS) 102
      1. \r\nTABLE
    55. CANADA: AUTOMOTIVE COOLANTS MARKET, BY VEHICLE TYPE, 2023-2032 (USD MILLION)
      1. 102
    56. \r\nTABLE 65 CANADA: AUTOMOTIVE COOLANTS MARKET, BY VEHICLE TYPE, 2023-2032
      1. (MILLION GALLONS) 103
      2. \r\nTABLE 66 CANADA: AUTOMOTIVE COOLANTS MARKET, BY
      3. END USER, 2023-2032 (USD MILLION) 103
      4. \r\nTABLE 67 CANADA: AUTOMOTIVE COOLANTS
    57. MARKET, BY END USER, 2023-2032 (MILLION GALLONS) 104
      1. \r\nTABLE 68 EUROPE:
    58. AUTOMOTIVE COOLANTS MARKET, BY COUNTRY, 2023-2032 (USD MILLION) 106
      1. \r\nTABLE
    59. EUROPE: AUTOMOTIVE COOLANTS MARKET, BY COUNTRY, 2023-2032 (MILLION GALLONS) 107
      1. \r\nTABLE
    60. EUROPE: AUTOMOTIVE COOLANTS MARKET, BY TECHNOLOGY, 2023-2032 (USD MILLION) 107
      1. \r\nTABLE
    61. EUROPE: AUTOMOTIVE COOLANTS MARKET, BY TECHNOLOGY, 2023-2032 (MILLION GALLONS)
      1. 108
    62. \r\nTABLE 72 EUROPE: AUTOMOTIVE COOLANTS MARKET, BY PRODUCT, 2023-2032
      1. (USD MILLION) 108
    63. \r\nTABLE 73 EUROPE: AUTOMOTIVE COOLANTS MARKET, BY PRODUCT,
      1. \r\nTABLE 74 EUROPE: AUTOMOTIVE COOLANTS MARKET,
      2. BY VEHICLE TYPE, 2023-2032 (USD MILLION) 109
      3. \r\nTABLE 75 EUROPE: AUTOMOTIVE
    64. COOLANTS MARKET, BY VEHICLE TYPE, 2023-2032 (MILLION GALLONS) 110
      1. \r\nTABLE
    65. EUROPE: AUTOMOTIVE COOLANTS MARKET, BY END USER, 2023-2032 (USD MILLION) 110
      1. \r\nTABLE
    66. EUROPE: AUTOMOTIVE COOLANTS MARKET, BY END USER, 2023-2032 (MILLION GALLONS)
      1. 111
    67. \r\nTABLE 78 GERMANY: AUTOMOTIVE COOLANTS MARKET, BY TECHNOLOGY, 2023-2032
      1. (USD MILLION) 111
    68. \r\nTABLE 79 GERMANY: AUTOMOTIVE COOLANTS MARKET, BY TECHNOLOGY,
      1. \r\nTABLE 80 GERMANY: AUTOMOTIVE COOLANTS
    69. MARKET, BY PRODUCT, 2023-2032 (USD MILLION) 112
      1. \r\nTABLE 81 GERMANY: AUTOMOTIVE
    70. COOLANTS MARKET, BY PRODUCT, 2023-2032 (MILLION GALLONS) 113
      1. \r\nTABLE 82
    71. GERMANY: AUTOMOTIVE COOLANTS MARKET, BY VEHICLE TYPE, 2023-2032 (USD MILLION) 113
      1. \r\nTABLE
    72. GERMANY: AUTOMOTIVE COOLANTS MARKET, BY VEHICLE TYPE, 2023-2032 (MILLION GALLONS)
      1. 114
    73. \r\nTABLE 84 GERMANY: AUTOMOTIVE COOLANTS MARKET, BY END USER, 2023-2032
      1. (USD MILLION) 114
    74. \r\nTABLE 85 GERMANY: AUTOMOTIVE COOLANTS MARKET, BY END
      1. USER, 2023-2032 (MILLION GALLONS) 115
      2. \r\nTABLE 86 UK: AUTOMOTIVE COOLANTS
    75. MARKET, BY TECHNOLOGY, 2023-2032 (USD MILLION) 115
      1. \r\nTABLE 87 UK: AUTOMOTIVE
    76. COOLANTS MARKET, BY TECHNOLOGY, 2023-2032 (MILLION GALLONS) 116
      1. \r\nTABLE
    77. UK: AUTOMOTIVE COOLANTS MARKET, BY PRODUCT, 2023-2032 (USD MILLION) 116
      1. \r\nTABLE
    78. UK: AUTOMOTIVE COOLANTS MARKET, BY PRODUCT, 2023-2032 (MILLION GALLONS) 117
      1. \r\nTABLE
    79. UK: AUTOMOTIVE COOLANTS MARKET, BY VEHICLE TYPE, 2023-2032 (USD MILLION) 117
      1. \r\nTABLE
    80. UK: AUTOMOTIVE COOLANTS MARKET, BY VEHICLE TYPE, 2023-2032 (MILLION GALLONS)
      1. 118
    81. \r\nTABLE 92 UK: AUTOMOTIVE COOLANTS MARKET, BY END USER, 2023-2032 (USD
      1. MILLION) 118
    82. \r\nTABLE 93 UK: AUTOMOTIVE COOLANTS MARKET, BY END USER, 2023-2032
      1. (MILLION GALLONS) 119
      2. \r\nTABLE 94 FRANCE: AUTOMOTIVE COOLANTS MARKET, BY
      3. TECHNOLOGY, 2023-2032 (USD MILLION) 119
      4. \r\nTABLE 95 FRANCE: AUTOMOTIVE COOLANTS
    83. MARKET, BY TECHNOLOGY, 2023-2032 (MILLION GALLONS) 120
      1. \r\nTABLE 96 FRANCE:
    84. AUTOMOTIVE COOLANTS MARKET, BY PRODUCT, 2023-2032 (USD MILLION) 120
      1. \r\nTABLE
    85. FRANCE: AUTOMOTIVE COOLANTS MARKET, BY PRODUCT, 2023-2032 (MILLION GALLONS) 121
      1. \r\nTABLE
    86. FRANCE: AUTOMOTIVE COOLANTS MARKET, BY VEHICLE TYPE, 2023-2032 (USD MILLION)
      1. 121
    87. \r\nTABLE 99 FRANCE: AUTOMOTIVE COOLANTS MARKET, BY VEHICLE TYPE, 2023-2032
      1. (MILLION GALLONS) 122
      2. \r\nTABLE 100 FRANCE: AUTOMOTIVE COOLANTS MARKET, BY
      3. END USER, 2023-2032 (USD MILLION) 122
      4. \r\nTABLE 101 FRANCE: AUTOMOTIVE COOLANTS
    88. MARKET, BY END USER, 2023-2032 (MILLION GALLONS) 123
      1. \r\nTABLE 102 SPAIN:
    89. AUTOMOTIVE COOLANTS MARKET, BY TECHNOLOGY, 2023-2032 (USD MILLION) 123
      1. \r\nTABLE
    90. SPAIN: AUTOMOTIVE COOLANTS MARKET, BY TECHNOLOGY, 2023-2032 (MILLION GALLONS)
      1. 124
    91. \r\nTABLE 104 SPAIN: AUTOMOTIVE COOLANTS MARKET, BY PRODUCT, 2023-2032
      1. (USD MILLION) 124
    92. \r\nTABLE 105 SPAIN: AUTOMOTIVE COOLANTS MARKET, BY PRODUCT,
      1. \r\nTABLE 106 SPAIN: AUTOMOTIVE COOLANTS MARKET,
      2. BY VEHICLE TYPE, 2023-2032 (USD MILLION) 125
      3. \r\nTABLE 107 SPAIN: AUTOMOTIVE
    93. COOLANTS MARKET, BY VEHICLE TYPE, 2023-2032 (MILLION GALLONS) 126
      1. \r\nTABLE
    94. SPAIN: AUTOMOTIVE COOLANTS MARKET, BY END USER, 2023-2032 (USD MILLION) 126
      1. \r\nTABLE
    95. SPAIN: AUTOMOTIVE COOLANTS MARKET, BY END USER, 2023-2032 (MILLION GALLONS)
      1. 127
    96. \r\nTABLE 110 ITALY: AUTOMOTIVE COOLANTS MARKET, BY TECHNOLOGY, 2023-2032
      1. (USD MILLION) 127
    97. \r\nTABLE 111 ITALY: AUTOMOTIVE COOLANTS MARKET, BY TECHNOLOGY,
      1. \r\nTABLE 112 ITALY: AUTOMOTIVE COOLANTS MARKET,
      2. BY PRODUCT, 2023-2032 (USD MILLION) 128
      3. \r\nTABLE 113 ITALY: AUTOMOTIVE COOLANTS
    98. MARKET, BY PRODUCT, 2023-2032 (MILLION GALLONS) 129
      1. \r\nTABLE 114 ITALY: AUTOMOTIVE
    99. COOLANTS MARKET, BY VEHICLE TYPE, 2023-2032 (USD MILLION) 129
      1. \r\nTABLE 115
    100. ITALY: AUTOMOTIVE COOLANTS MARKET, BY VEHICLE TYPE, 2023-2032 (MILLION GALLONS)
      1. 130
    101. \r\nTABLE 116 ITALY: AUTOMOTIVE COOLANTS MARKET, BY END USER, 2023-2032
      1. (USD MILLION) 130
    102. \r\nTABLE 117 ITALY: AUTOMOTIVE COOLANTS MARKET, BY END
      1. USER, 2023-2032 (MILLION GALLONS) 131
      2. \r\nTABLE 118 RUSSIA: AUTOMOTIVE COOLANTS
    103. MARKET, BY TECHNOLOGY, 2023-2032 (USD MILLION) 131
      1. \r\nTABLE 119 RUSSIA: AUTOMOTIVE
    104. COOLANTS MARKET, BY TECHNOLOGY, 2023-2032 (MILLION GALLONS) 132
      1. \r\nTABLE
    105. RUSSIA: AUTOMOTIVE COOLANTS MARKET, BY PRODUCT, 2023-2032 (USD MILLION) 132
      1. \r\nTABLE
    106. RUSSIA: AUTOMOTIVE COOLANTS MARKET, BY PRODUCT, 2023-2032 (MILLION GALLONS)
      1. 133
    107. \r\nTABLE 122 RUSSIA: AUTOMOTIVE COOLANTS MARKET, BY VEHICLE TYPE, 2023-2032
      1. (USD MILLION) 133
    108. \r\nTABLE 123 RUSSIA: AUTOMOTIVE COOLANTS MARKET, BY VEHICLE
      1. TYPE, 2023-2032 (MILLION GALLONS) 134
      2. \r\nTABLE 124 RUSSIA: AUTOMOTIVE COOLANTS
    109. MARKET, BY END USER, 2023-2032 (USD MILLION) 134
      1. \r\nTABLE 125 RUSSIA: AUTOMOTIVE
    110. COOLANTS MARKET, BY END USER, 2023-2032 (MILLION GALLONS) 135
      1. \r\nTABLE 126
    111. BENELUX: AUTOMOTIVE COOLANTS MARKET, BY TECHNOLOGY, 2023-2032 (USD MILLION) 135
      1. \r\nTABLE
    112. BENELUX: AUTOMOTIVE COOLANTS MARKET, BY TECHNOLOGY, 2023-2032 (MILLION GALLONS)
      1. 136
    113. \r\nTABLE 128 BENELUX: AUTOMOTIVE COOLANTS MARKET, BY PRODUCT, 2023-2032
      1. (USD MILLION) 136
    114. \r\nTABLE 129 BENELUX: AUTOMOTIVE COOLANTS MARKET, BY PRODUCT,
      1. \r\nTABLE 130 BENELUX: AUTOMOTIVE COOLANTS
    115. MARKET, BY VEHICLE TYPE, 2023-2032 (USD MILLION) 137
      1. \r\nTABLE 131 BENELUX:
    116. AUTOMOTIVE COOLANTS MARKET, BY VEHICLE TYPE, 2023-2032 (MILLION GALLONS) 138
      1. \r\nTABLE
    117. BENELUX: AUTOMOTIVE COOLANTS MARKET, BY END USER, 2023-2032 (USD MILLION) 138
      1. \r\nTABLE
    118. BENELUX: AUTOMOTIVE COOLANTS MARKET, BY END USER, 2023-2032 (MILLION GALLONS)
      1. 139
    119. \r\nTABLE 134 POLAND: AUTOMOTIVE COOLANTS MARKET, BY TECHNOLOGY, 2023-2032
      1. (USD MILLION) 139
    120. \r\nTABLE 135 POLAND: AUTOMOTIVE COOLANTS MARKET, BY TECHNOLOGY,
      1. \r\nTABLE 136 POLAND: AUTOMOTIVE COOLANTS
    121. MARKET, BY PRODUCT, 2023-2032 (USD MILLION) 140
      1. \r\nTABLE 137 POLAND: AUTOMOTIVE
    122. COOLANTS MARKET, BY PRODUCT, 2023-2032 (MILLION GALLONS) 141
      1. \r\nTABLE 138
    123. POLAND: AUTOMOTIVE COOLANTS MARKET, BY VEHICLE TYPE, 2023-2032 (USD MILLION) 141
      1. \r\nTABLE
    124. POLAND: AUTOMOTIVE COOLANTS MARKET, BY VEHICLE TYPE, 2023-2032 (MILLION GALLONS)
      1. 142
    125. \r\nTABLE 140 POLAND: AUTOMOTIVE COOLANTS MARKET, BY END USER, 2023-2032
      1. (USD MILLION) 142
    126. \r\nTABLE 141 POLAND: AUTOMOTIVE COOLANTS MARKET, BY END
      1. USER, 2023-2032 (MILLION GALLONS) 143
      2. \r\nTABLE 142 REST OF EUROPE: AUTOMOTIVE
    127. COOLANTS MARKET, BY TECHNOLOGY, 2023-2032 (USD MILLION) 143
      1. \r\nTABLE 143
    128. REST OF EUROPE: AUTOMOTIVE COOLANTS MARKET, BY TECHNOLOGY, 2023-2032 (MILLION GALLONS)
      1. 144
    129. \r\nTABLE 144 REST OF EUROPE: AUTOMOTIVE COOLANTS MARKET, BY PRODUCT,
      1. \r\nTABLE 145 REST OF EUROPE: AUTOMOTIVE COOLANTS
    130. MARKET, BY PRODUCT, 2023-2032 (MILLION GALLONS) 145
      1. \r\nTABLE 146 REST OF
    131. EUROPE: AUTOMOTIVE COOLANTS MARKET, BY VEHICLE TYPE, 2023-2032 (USD MILLION) 145
      1. \r\nTABLE
    132. REST OF EUROPE: AUTOMOTIVE COOLANTS MARKET, BY VEHICLE TYPE, 2023-2032 (MILLION
      1. GALLONS) 146
      2. \r\nTABLE 148 REST OF EUROPE: AUTOMOTIVE COOLANTS MARKET, BY
      3. END USER, 2023-2032 (USD MILLION) 146
      4. \r\nTABLE 149 REST OF EUROPE: AUTOMOTIVE
    133. COOLANTS MARKET, BY END USER, 2023-2032 (MILLION GALLONS) 147
      1. \r\nTABLE 150
    134. ASIA-PACIFIC: AUTOMOTIVE COOLANTS MARKET, BY COUNTRY, 2023-2032 (USD MILLION) 149
      1. \r\nTABLE
    135. ASIA-PACIFIC: AUTOMOTIVE COOLANTS MARKET, BY COUNTRY, 2023-2032 (MILLION GALLONS)
      1. 149
    136. \r\nTABLE 152 ASIA-PACIFIC: AUTOMOTIVE COOLANTS MARKET, BY TECHNOLOGY,
      1. \r\nTABLE 153 ASIA-PACIFIC: AUTOMOTIVE COOLANTS
    137. MARKET, BY TECHNOLOGY, 2023-2032 (MILLION GALLONS) 150
      1. \r\nTABLE 154 ASIA-PACIFIC:
    138. AUTOMOTIVE COOLANTS MARKET, BY PRODUCT, 2023-2032 (USD MILLION) 151
      1. \r\nTABLE
    139. ASIA-PACIFIC: AUTOMOTIVE COOLANTS MARKET, BY PRODUCT, 2023-2032 (MILLION GALLONS)
      1. 151
    140. \r\nTABLE 156 ASIA-PACIFIC: AUTOMOTIVE COOLANTS MARKET, BY VEHICLE TYPE,
      1. \r\nTABLE 157 ASIA-PACIFIC: AUTOMOTIVE COOLANTS
    141. MARKET, BY VEHICLE TYPE, 2023-2032 (MILLION GALLONS) 152
      1. \r\nTABLE 158 ASIA-PACIFIC:
    142. AUTOMOTIVE COOLANTS MARKET, BY END USER, 2023-2032 (USD MILLION) 153
      1. \r\nTABLE
    143. ASIA-PACIFIC: AUTOMOTIVE COOLANTS MARKET, BY END USER, 2023-2032 (MILLION GALLONS)
      1. 153
    144. \r\nTABLE 160 CHINA: AUTOMOTIVE COOLANTS MARKET, BY TECHNOLOGY, 2023-2032
      1. (USD MILLION) 154
    145. \r\nTABLE 161 CHINA: AUTOMOTIVE COOLANTS MARKET, BY TECHNOLOGY,
      1. \r\nTABLE 162 CHINA: AUTOMOTIVE COOLANTS MARKET,
      2. BY PRODUCT, 2023-2032 (USD MILLION) 155
      3. \r\nTABLE 163 CHINA: AUTOMOTIVE COOLANTS
    146. MARKET, BY PRODUCT, 2023-2032 (MILLION GALLONS) 155
      1. \r\nTABLE 164 CHINA: AUTOMOTIVE
    147. COOLANTS MARKET, BY VEHICLE TYPE, 2023-2032 (USD MILLION) 156
      1. \r\nTABLE 165
    148. CHINA: AUTOMOTIVE COOLANTS MARKET, BY VEHICLE TYPE, 2023-2032 (MILLION GALLONS)
      1. 156
    149. \r\nTABLE 166 CHINA: AUTOMOTIVE COOLANTS MARKET, BY END USER, 2023-2032
      1. (USD MILLION) 157
    150. \r\nTABLE 167 CHINA: AUTOMOTIVE COOLANTS MARKET, BY END
      1. USER, 2023-2032 (MILLION GALLONS) 157
      2. \r\nTABLE 168 JAPAN: AUTOMOTIVE COOLANTS
    151. MARKET, BY TECHNOLOGY, 2023-2032 (USD MILLION) 158
      1. \r\nTABLE 169 JAPAN: AUTOMOTIVE
    152. COOLANTS MARKET, BY TECHNOLOGY, 2023-2032 (MILLION GALLONS) 158
      1. \r\nTABLE
    153. JAPAN: AUTOMOTIVE COOLANTS MARKET, BY PRODUCT, 2023-2032 (USD MILLION) 159
      1. \r\nTABLE
    154. JAPAN: AUTOMOTIVE COOLANTS MARKET, BY PRODUCT, 2023-2032 (MILLION GALLONS) 159
      1. \r\nTABLE
    155. JAPAN: AUTOMOTIVE COOLANTS MARKET, BY VEHICLE TYPE, 2023-2032 (USD MILLION)
      1. 160
    156. \r\nTABLE 173 JAPAN: AUTOMOTIVE COOLANTS MARKET, BY VEHICLE TYPE, 2023-2032
      1. (MILLION GALLONS) 160
      2. \r\nTABLE 174 JAPAN: AUTOMOTIVE COOLANTS MARKET, BY
      3. END USER, 2023-2032 (USD MILLION) 161
      4. \r\nTABLE 175 JAPAN: AUTOMOTIVE COOLANTS
    157. MARKET, BY END USER, 2023-2032 (MILLION GALLONS) 161
      1. \r\nTABLE 176 INDIA:
    158. AUTOMOTIVE COOLANTS MARKET, BY TECHNOLOGY, 2023-2032 (USD MILLION) 162
      1. \r\nTABLE
    159. INDIA: AUTOMOTIVE COOLANTS MARKET, BY TECHNOLOGY, 2023-2032 (MILLION GALLONS)
      1. 162
    160. \r\nTABLE 178 INDIA: AUTOMOTIVE COOLANTS MARKET, BY PRODUCT, 2023-2032
      1. (USD MILLION) 163
    161. \r\nTABLE 179 INDIA: AUTOMOTIVE COOLANTS MARKET, BY PRODUCT,
      1. \r\nTABLE 180 INDIA: AUTOMOTIVE COOLANTS MARKET,
      2. BY VEHICLE TYPE, 2023-2032 (USD MILLION) 164
      3. \r\nTABLE 181 INDIA: AUTOMOTIVE
    162. COOLANTS MARKET, BY VEHICLE TYPE, 2023-2032 (MILLION GALLONS) 164
      1. \r\nTABLE
    163. INDIA: AUTOMOTIVE COOLANTS MARKET, BY END USER, 2023-2032 (USD MILLION) 165
      1. \r\nTABLE
    164. INDIA: AUTOMOTIVE COOLANTS MARKET, BY END USER, 2023-2032 (MILLION GALLONS)
      1. 165
      2. \r\nTABLE 184 AUSTRALIA AND NEW ZEALAND: AUTOMOTIVE COOLANTS MARKET, BY
      3. TECHNOLOGY, 2023-2032 (USD MILLION) 166
      4. \r\nTABLE 185 AUSTRALIA AND NEW ZEALAND:
    165. AUTOMOTIVE COOLANTS MARKET, BY TECHNOLOGY, 2023-2032 (MILLION GALLONS) 166
      1. \r\nTABLE
    166. AUSTRALIA AND NEW ZEALAND: AUTOMOTIVE COOLANTS MARKET, BY PRODUCT, 2023-2032
      1. (USD MILLION) 167
      2. \r\nTABLE 187 AUSTRALIA AND NEW ZEALAND: AUTOMOTIVE COOLANTS
    167. MARKET, BY PRODUCT, 2023-2032 (MILLION GALLONS) 167
      1. \r\nTABLE 188 AUSTRALIA
    168. AND NEW ZEALAND: AUTOMOTIVE COOLANTS MARKET, BY VEHICLE TYPE, 2023-2032 (USD MILLION)
      1. 168
      2. \r\nTABLE 189 AUSTRALIA AND NEW ZEALAND: AUTOMOTIVE COOLANTS MARKET, BY
      3. VEHICLE TYPE, 2023-2032 (MILLION GALLONS) 168
      4. \r\nTABLE 190 AUSTRALIA AND
    169. NEW ZEALAND: AUTOMOTIVE COOLANTS MARKET, BY END USER, 2023-2032 (USD MILLION) 169
      1. \r\nTABLE
    170. AUSTRALIA AND NEW ZEALAND: AUTOMOTIVE COOLANTS MARKET, BY END USER, 2023-2032
      1. (MILLION GALLONS) 169
      2. \r\nTABLE 192 INDONESIA: AUTOMOTIVE COOLANTS MARKET,
      3. BY TECHNOLOGY, 2023-2032 (USD MILLION) 170
      4. \r\nTABLE 193 INDONESIA: AUTOMOTIVE
    171. COOLANTS MARKET, BY TECHNOLOGY, 2023-2032 (MILLION GALLONS) 170
      1. \r\nTABLE
    172. INDONESIA: AUTOMOTIVE COOLANTS MARKET, BY PRODUCT, 2023-2032 (USD MILLION) 171
      1. \r\nTABLE
    173. INDONESIA: AUTOMOTIVE COOLANTS MARKET, BY PRODUCT, 2023-2032 (MILLION GALLONS)
      1. 171
    174. \r\nTABLE 196 INDONESIA: AUTOMOTIVE COOLANTS MARKET, BY VEHICLE TYPE,
      1. \r\nTABLE 197 INDONESIA: AUTOMOTIVE COOLANTS MARKET,
      2. BY VEHICLE TYPE, 2023-2032 (MILLION GALLONS) 172
      3. \r\nTABLE 198 INDONESIA:
    175. AUTOMOTIVE COOLANTS MARKET, BY END USER, 2023-2032 (USD MILLION) 173
      1. \r\nTABLE
    176. INDONESIA: AUTOMOTIVE COOLANTS MARKET, BY END USER, 2023-2032 (MILLION GALLONS)
      1. 173
    177. \r\nTABLE 200 SOUTH KOREA: AUTOMOTIVE COOLANTS MARKET, BY TECHNOLOGY,
      1. \r\nTABLE 201 SOUTH KOREA: AUTOMOTIVE COOLANTS
    178. MARKET, BY TECHNOLOGY, 2023-2032 (MILLION GALLONS) 174
      1. \r\nTABLE 202 SOUTH
    179. KOREA: AUTOMOTIVE COOLANTS MARKET, BY PRODUCT, 2023-2032 (USD MILLION) 175
      1. \r\nTABLE
    180. SOUTH KOREA: AUTOMOTIVE COOLANTS MARKET, BY PRODUCT, 2023-2032 (MILLION GALLONS)
      1. 175
    181. \r\nTABLE 204 SOUTH KOREA: AUTOMOTIVE COOLANTS MARKET, BY VEHICLE TYPE,
      1. \r\nTABLE 205 SOUTH KOREA: AUTOMOTIVE COOLANTS
    182. MARKET, BY VEHICLE TYPE, 2023-2032 (MILLION GALLONS) 176
      1. \r\nTABLE 206 SOUTH
    183. KOREA: AUTOMOTIVE COOLANTS MARKET, BY END USER, 2023-2032 (USD MILLION) 177
      1. \r\nTABLE
    184. SOUTH KOREA: AUTOMOTIVE COOLANTS MARKET, BY END USER, 2023-2032 (MILLION GALLONS)
      1. 177
    185. \r\nTABLE 208 THAILAND: AUTOMOTIVE COOLANTS MARKET, BY TECHNOLOGY, 2023-2032
      1. (USD MILLION) 178
    186. \r\nTABLE 209 THAILAND: AUTOMOTIVE COOLANTS MARKET, BY TECHNOLOGY,
      1. \r\nTABLE 210 THAILAND: AUTOMOTIVE COOLANTS
    187. MARKET, BY PRODUCT, 2023-2032 (USD MILLION) 179
      1. \r\nTABLE 211 THAILAND: AUTOMOTIVE
    188. COOLANTS MARKET, BY PRODUCT, 2023-2032 (MILLION GALLONS) 179
      1. \r\nTABLE 212
    189. THAILAND: AUTOMOTIVE COOLANTS MARKET, BY VEHICLE TYPE, 2023-2032 (USD MILLION) 180
      1. \r\nTABLE
    190. THAILAND: AUTOMOTIVE COOLANTS MARKET, BY VEHICLE TYPE, 2023-2032 (MILLION GALLONS)
      1. 180
    191. \r\nTABLE 214 THAILAND: AUTOMOTIVE COOLANTS MARKET, BY END USER, 2023-2032
      1. (USD MILLION) 181
    192. \r\nTABLE 215 THAILAND: AUTOMOTIVE COOLANTS MARKET, BY END
      1. USER, 2023-2032 (MILLION GALLONS) 181
      2. \r\nTABLE 216 REST OF ASIA-PACIFIC:
    193. AUTOMOTIVE COOLANTS MARKET, BY TECHNOLOGY, 2023-2032 (USD MILLION) 182
      1. \r\nTABLE
    194. REST OF ASIA-PACIFIC: AUTOMOTIVE COOLANTS MARKET, BY TECHNOLOGY, 2023-2032 (MILLION
      1. GALLONS) 182
      2. \r\nTABLE 218 REST OF ASIA-PACIFIC: AUTOMOTIVE COOLANTS MARKET,
      3. BY PRODUCT, 2023-2032 (USD MILLION) 183
      4. \r\nTABLE 219 REST OF ASIA-PACIFIC:
    195. AUTOMOTIVE COOLANTS MARKET, BY PRODUCT, 2023-2032 (MILLION GALLONS) 183
      1. \r\nTABLE
    196. REST OF ASIA-PACIFIC: AUTOMOTIVE COOLANTS MARKET, BY VEHICLE TYPE, 2023-2032
      1. (USD MILLION) 184
      2. \r\nTABLE 221 REST OF ASIA-PACIFIC: AUTOMOTIVE COOLANTS
    197. MARKET, BY VEHICLE TYPE, 2023-2032 (MILLION GALLONS) 184
      1. \r\nTABLE 222 REST
    198. OF ASIA-PACIFIC: AUTOMOTIVE COOLANTS MARKET, BY END USER, 2023-2032 (USD MILLION)
      1. 185
    199. \r\nTABLE 223 REST OF ASIA-PACIFIC: AUTOMOTIVE COOLANTS MARKET, BY END
      1. USER, 2023-2032 (MILLION GALLONS) 185
      2. \r\nTABLE 224 MIDDLE EAST & AFRICA:
    200. AUTOMOTIVE COOLANTS MARKET, BY COUNTRY, 2023-2032 (USD MILLION) 186
      1. \r\nTABLE
    201. MIDDLE EAST & AFRICA: AUTOMOTIVE COOLANTS MARKET, BY COUNTRY, 2023-2032
      1. (MILLION GALLONS) 187
      2. \r\nTABLE 226 MIDDLE EAST & AFRICA: AUTOMOTIVE COOLANTS
    202. MARKET, BY TECHNOLOGY, 2023-2032 (USD MILLION) 187
      1. \r\nTABLE 227 MIDDLE EAST
    203. & AFRICA: AUTOMOTIVE COOLANTS MARKET, BY TECHNOLOGY, 2023-2032 (MILLION GALLONS)
      1. 188
      2. \r\nTABLE 228 MIDDLE EAST & AFRICA: AUTOMOTIVE COOLANTS MARKET, BY
      3. PRODUCT, 2023-2032 (USD MILLION) 188
      4. \r\nTABLE 229 MIDDLE EAST & AFRICA:
    204. AUTOMOTIVE COOLANTS MARKET, BY PRODUCT, 2023-2032 (MILLION GALLONS) 189
      1. \r\nTABLE
    205. MIDDLE EAST & AFRICA: AUTOMOTIVE COOLANTS MARKET, BY VEHICLE TYPE, 2023-2032
      1. (USD MILLION) 189
      2. \r\nTABLE 231 MIDDLE EAST & AFRICA: AUTOMOTIVE COOLANTS
    206. MARKET, BY VEHICLE TYPE, 2023-2032 (MILLION GALLONS) 190
      1. \r\nTABLE 232 MIDDLE
    207. EAST & AFRICA: AUTOMOTIVE COOLANTS MARKET, BY END USER, 2023-2032 (USD MILLION)
      1. 190
      2. \r\nTABLE 233 MIDDLE EAST & AFRICA: AUTOMOTIVE COOLANTS MARKET, BY
      3. END USER, 2023-2032 (MILLION GALLONS) 191
      4. \r\nTABLE 234 GCC: AUTOMOTIVE COOLANTS
    208. MARKET, BY TECHNOLOGY, 2023-2032 (USD MILLION) 191
      1. \r\nTABLE 235 GCC: AUTOMOTIVE
    209. COOLANTS MARKET, BY TECHNOLOGY, 2023-2032 (MILLION GALLONS) 192
      1. \r\nTABLE
    210. GCC: AUTOMOTIVE COOLANTS MARKET, BY PRODUCT, 2023-2032 (USD MILLION) 192
      1. \r\nTABLE
    211. GCC: AUTOMOTIVE COOLANTS MARKET, BY PRODUCT, 2023-2032 (MILLION GALLONS) 193
      1. \r\nTABLE
    212. GCC: AUTOMOTIVE COOLANTS MARKET, BY VEHICLE TYPE, 2023-2032 (USD MILLION) 193
      1. \r\nTABLE
    213. GCC: AUTOMOTIVE COOLANTS MARKET, BY VEHICLE TYPE, 2023-2032 (MILLION GALLONS)
      1. 194
    214. \r\nTABLE 240 GCC: AUTOMOTIVE COOLANTS MARKET, BY END USER, 2023-2032
      1. (USD MILLION) 194
    215. \r\nTABLE 241 GCC: AUTOMOTIVE COOLANTS MARKET, BY END USER,
      1. \r\nTABLE 242 TURKEY: AUTOMOTIVE COOLANTS
    216. MARKET, BY TECHNOLOGY, 2023-2032 (USD MILLION) 195
      1. \r\nTABLE 243 TURKEY: AUTOMOTIVE
    217. COOLANTS MARKET, BY TECHNOLOGY, 2023-2032 (MILLION GALLONS) 195
      1. \r\nTABLE
    218. TURKEY: AUTOMOTIVE COOLANTS MARKET, BY PRODUCT, 2023-2032 (USD MILLION) 196
      1. \r\nTABLE
    219. TURKEY: AUTOMOTIVE COOLANTS MARKET, BY PRODUCT, 2023-2032 (MILLION GALLONS)
      1. 196
    220. \r\nTABLE 246 TURKEY: AUTOMOTIVE COOLANTS MARKET, BY VEHICLE TYPE, 2023-2032
      1. (USD MILLION) 197
    221. \r\nTABLE 247 TURKEY: AUTOMOTIVE COOLANTS MARKET, BY VEHICLE
      1. TYPE, 2023-2032 (MILLION GALLONS) 197
      2. \r\nTABLE 248 TURKEY: AUTOMOTIVE COOLANTS
    222. MARKET, BY END USER, 2023-2032 (USD MILLION) 198
      1. \r\nTABLE 249 TURKEY: AUTOMOTIVE
    223. COOLANTS MARKET, BY END USER, 2023-2032 (MILLION GALLONS) 198
      1. \r\nTABLE 250
    224. SOUTH AFRICA: AUTOMOTIVE COOLANTS MARKET, BY TECHNOLOGY, 2023-2032 (USD MILLION)
      1. 199
    225. \r\nTABLE 251 SOUTH AFRICA: AUTOMOTIVE COOLANTS MARKET, BY TECHNOLOGY,
      1. \r\nTABLE 252 SOUTH AFRICA: AUTOMOTIVE COOLANTS
    226. MARKET, BY PRODUCT, 2023-2032 (USD MILLION) 200
      1. \r\nTABLE 253 SOUTH AFRICA:
    227. AUTOMOTIVE COOLANTS MARKET, BY PRODUCT, 2023-2032 (MILLION GALLONS) 200
      1. \r\nTABLE
    228. SOUTH AFRICA: AUTOMOTIVE COOLANTS MARKET, BY VEHICLE TYPE, 2023-2032 (USD MILLION)
      1. 201
    229. \r\nTABLE 255 SOUTH AFRICA: AUTOMOTIVE COOLANTS MARKET, BY VEHICLE TYPE,
      1. \r\nTABLE 256 SOUTH AFRICA: AUTOMOTIVE COOLANTS
    230. MARKET, BY END USER, 2023-2032 (USD MILLION) 202
      1. \r\nTABLE 257 SOUTH AFRICA:
    231. AUTOMOTIVE COOLANTS MARKET, BY END USER, 2023-2032 (MILLION GALLONS) 202
      1. \r\nTABLE
    232. REST OF THE MIDDLE EAST & AFRICA: AUTOMOTIVE COOLANTS MARKET, BY TECHNOLOGY,
      1. \r\nTABLE 259 REST OF THE MIDDLE EAST & AFRICA:
    233. AUTOMOTIVE COOLANTS MARKET, BY TECHNOLOGY, 2023-2032 (MILLION GALLONS) 203
      1. \r\nTABLE
    234. REST OF THE MIDDLE EAST & AFRICA: AUTOMOTIVE COOLANTS MARKET, BY PRODUCT,
      1. \r\nTABLE 261 REST OF THE MIDDLE EAST & AFRICA:
    235. AUTOMOTIVE COOLANTS MARKET, BY PRODUCT, 2023-2032 (MILLION GALLONS) 204
      1. \r\nTABLE
    236. REST OF THE MIDDLE EAST & AFRICA: AUTOMOTIVE COOLANTS MARKET, BY VEHICLE
      1. TYPE, 2023-2032 (USD MILLION) 205
      2. \r\nTABLE 263 REST OF THE MIDDLE EAST &
    237. AFRICA: AUTOMOTIVE COOLANTS MARKET, BY VEHICLE TYPE, 2023-2032 (MILLION GALLONS)
      1. 205
      2. \r\nTABLE 264 REST OF THE MIDDLE EAST & AFRICA: AUTOMOTIVE COOLANTS
    238. MARKET, BY END USER, 2023-2032 (USD MILLION) 206
      1. \r\nTABLE 265 REST OF THE
    239. MIDDLE EAST & AFRICA: AUTOMOTIVE COOLANTS MARKET, BY END USER, 2023-2032 (MILLION
      1. GALLONS) 206
    240. \r\nTABLE 266 LATIN AMERICA: AUTOMOTIVE COOLANTS MARKET, BY COUNTRY,
      1. \r\nTABLE 267 LATIN AMERICA: AUTOMOTIVE COOLANTS
    241. MARKET, BY COUNTRY, 2023-2032 (MILLION GALLONS) 208
      1. \r\nTABLE 268 LATIN AMERICA:
    242. AUTOMOTIVE COOLANTS MARKET, BY TECHNOLOGY, 2023-2032 (USD MILLION) 209
      1. \r\nTABLE
    243. LATIN AMERICA: AUTOMOTIVE COOLANTS MARKET, BY TECHNOLOGY, 2023-2032 (MILLION
      1. GALLONS) 209
    244. \r\nTABLE 270 LATIN AMERICA: AUTOMOTIVE COOLANTS MARKET, BY PRODUCT,
      1. \r\nTABLE 271 LATIN AMERICA: AUTOMOTIVE COOLANTS
    245. MARKET, BY PRODUCT, 2023-2032 (MILLION GALLONS) 210
      1. \r\nTABLE 272 LATIN AMERICA:
    246. AUTOMOTIVE COOLANTS MARKET, BY VEHICLE TYPE, 2023-2032 (USD MILLION) 211
      1. \r\nTABLE
    247. LATIN AMERICA: AUTOMOTIVE COOLANTS MARKET, BY VEHICLE TYPE, 2023-2032 (MILLION
      1. GALLONS) 211
    248. \r\nTABLE 274 LATIN AMERICA: AUTOMOTIVE COOLANTS MARKET, BY END
      1. USER, 2023-2032 (USD MILLION) 212
      2. \r\nTABLE 275 LATIN AMERICA: AUTOMOTIVE
    249. COOLANTS MARKET, BY END USER, 2023-2032 (MILLION GALLONS) 212
      1. \r\nTABLE 276
    250. BRAZIL: AUTOMOTIVE COOLANTS MARKET, BY TECHNOLOGY, 2023-2032 (USD MILLION) 213
      1. \r\nTABLE
    251. BRAZIL: AUTOMOTIVE COOLANTS MARKET, BY TECHNOLOGY, 2023-2032 (MILLION GALLONS)
      1. 213
    252. \r\nTABLE 278 BRAZIL: AUTOMOTIVE COOLANTS MARKET, BY PRODUCT, 2023-2032
      1. (USD MILLION) 214
    253. \r\nTABLE 279 BRAZIL: AUTOMOTIVE COOLANTS MARKET, BY PRODUCT,
      1. \r\nTABLE 280 BRAZIL: AUTOMOTIVE COOLANTS
    254. MARKET, BY VEHICLE TYPE, 2023-2032 (USD MILLION) 215
      1. \r\nTABLE 281 BRAZIL:
    255. AUTOMOTIVE COOLANTS MARKET, BY VEHICLE TYPE, 2023-2032 (MILLION GALLONS) 215
      1. \r\nTABLE
    256. BRAZIL: AUTOMOTIVE COOLANTS MARKET, BY END USER, 2023-2032 (USD MILLION) 216
      1. \r\nTABLE
    257. BRAZIL: AUTOMOTIVE COOLANTS MARKET, BY END USER, 2023-2032 (MILLION GALLONS)
      1. 216
    258. \r\nTABLE 284 MEXICO: AUTOMOTIVE COOLANTS MARKET, BY TECHNOLOGY, 2023-2032
      1. (USD MILLION) 217
    259. \r\nTABLE 285 MEXICO: AUTOMOTIVE COOLANTS MARKET, BY TECHNOLOGY,
      1. \r\nTABLE 286 MEXICO: AUTOMOTIVE COOLANTS
    260. MARKET, BY PRODUCT, 2023-2032 (USD MILLION) 218
      1. \r\nTABLE 287 MEXICO: AUTOMOTIVE
    261. COOLANTS MARKET, BY PRODUCT, 2023-2032 (MILLION GALLONS) 218
      1. \r\nTABLE 288
    262. MEXICO: AUTOMOTIVE COOLANTS MARKET, BY VEHICLE TYPE, 2023-2032 (USD MILLION) 219
      1. \r\nTABLE
    263. MEXICO: AUTOMOTIVE COOLANTS MARKET, BY VEHICLE TYPE, 2023-2032 (MILLION GALLONS)
      1. 219
    264. \r\nTABLE 290 MEXICO: AUTOMOTIVE COOLANTS MARKET, BY END USER, 2023-2032
      1. (USD MILLION) 220
    265. \r\nTABLE 291 MEXICO: AUTOMOTIVE COOLANTS MARKET, BY END
      1. USER, 2023-2032 (MILLION GALLONS) 220
      2. \r\nTABLE 292 ARGENTINA: AUTOMOTIVE
    266. COOLANTS MARKET, BY TECHNOLOGY, 2023-2032 (USD MILLION) 221
      1. \r\nTABLE 293
    267. ARGENTINA: AUTOMOTIVE COOLANTS MARKET, BY TECHNOLOGY, 2023-2032 (MILLION GALLONS)
      1. 221
    268. \r\nTABLE 294 ARGENTINA: AUTOMOTIVE COOLANTS MARKET, BY PRODUCT, 2023-2032
      1. (USD MILLION) 222
      2. \r\nTABLE 295 ARGENTINA: AUTOMOTIVE COOLANTS MARKET, BY
      3. PRODUCT, 2023-2032 (MILLION GALLONS) 222
      4. \r\nTABLE 296 ARGENTINA: AUTOMOTIVE
    269. COOLANTS MARKET, BY VEHICLE TYPE, 2023-2032 (USD MILLION) 223
      1. \r\nTABLE 297
    270. ARGENTINA: AUTOMOTIVE COOLANTS MARKET, BY VEHICLE TYPE, 2023-2032 (MILLION GALLONS)
      1. 223
    271. \r\nTABLE 298 ARGENTINA: AUTOMOTIVE COOLANTS MARKET, BY END USER, 2023-2032
      1. (USD MILLION) 224
      2. \r\nTABLE 299 ARGENTINA: AUTOMOTIVE COOLANTS MARKET, BY
      3. END USER, 2023-2032 (MILLION GALLONS) 224
      4. \r\nTABLE 300 REST OF LATIN AMERICA:
    272. AUTOMOTIVE COOLANTS MARKET, BY TECHNOLOGY, 2023-2032 (USD MILLION) 225
      1. \r\nTABLE
    273. REST OF LATIN AMERICA: AUTOMOTIVE COOLANTS MARKET, BY TECHNOLOGY, 2023-2032
      1. (MILLION GALLONS) 225
      2. \r\nTABLE 302 REST OF LATIN AMERICA: AUTOMOTIVE COOLANTS
    274. MARKET, BY PRODUCT, 2023-2032 (USD MILLION) 226
      1. \r\nTABLE 303 REST OF LATIN
    275. AMERICA: AUTOMOTIVE COOLANTS MARKET, BY PRODUCT, 2023-2032 (MILLION GALLONS) 226
      1. \r\nTABLE
    276. REST OF LATIN AMERICA: AUTOMOTIVE COOLANTS MARKET, BY VEHICLE TYPE, 2023-2032
      1. (USD MILLION) 227
      2. \r\nTABLE 305 REST OF LATIN AMERICA: AUTOMOTIVE COOLANTS
    277. MARKET, BY VEHICLE TYPE, 2023-2032 (MILLION GALLONS) 227
      1. \r\nTABLE 306 REST
    278. OF LATIN AMERICA: AUTOMOTIVE COOLANTS MARKET, BY END USER, 2023-2032 (USD MILLION)
      1. 228
    279. \r\nTABLE 307 REST OF LATIN AMERICA: AUTOMOTIVE COOLANTS MARKET, BY END
      1. USER, 2023-2032 (MILLION GALLONS) 228
      2. \r\nTABLE 308 KEY DEVELOPMENTS 230
      3. \r\nTABLE
    280. VALVOLINE INC.: PRODUCTS OFFERED 235
      1. \r\nTABLE 310 VALVOLINE INC.: KEY
      2. DEVELOPMENTS 235
      3. \r\nTABLE 311 EXXONMOBIL CORPORATION: PRODUCTS OFFERED 238
      4. \r\nTABLE
    281. BASF SE: PRODUCTS OFFERED 242
      1. \r\nTABLE 313 BASF SE: KEY DEVELOPMENTS
      2. 242
      3. \r\nTABLE 314 TOTAL: PRODUCTS OFFERED 246
      4. \r\nTABLE 315 CHEVRON
      5. CORPORATION: PRODUCTS OFFERED 250
      6. \r\nTABLE 316 ROYAL DUTCH SHELL PLC: PRODUCTS
      7. OFFERED 254
      8. \r\nTABLE 317 OLD WORLD INDUSTRIES, LLC: PRODUCTS OFFERED 256
      9. \r\nTABLE
    282. OLD WORLD INDUSTRIES, LLC: KEY DEVELOPMENTS 257
      1. \r\nTABLE 319 PRESTONE
      2. PRODUCTS CORPORATION: PRODUCTS OFFERED 259
      3. \r\nTABLE 320 PRESTONE PRODUCTS
      4. CORPORATION: KEY DEVELOPMENTS 260
      5. \r\nTABLE 321 ARTECO: PRODUCTS OFFERED 263
      6. \r\nTABLE
    283. RECOCHEM CORPORATION: PRODUCTS OFFERED 266
      1. \r\nTABLE 323 RECOCHEM CORPORATION:
      2. KEY DEVELOPMENTS 267
      3. \r\nTABLE 324 AMSOIL INC.: PRODUCTS OFFERED 269
      4. \r\nTABLE
    284. MOTUL: PRODUCTS OFFERED 271
      1. \r\n15 LIST OF FIGURES
      2. \r\nFIGURE 1
      3. MARKET SYNOPSIS 22
      4. \r\nFIGURE 2 MARKET ATTRACTIVENESS ANALYSIS: GLOBAL AUTOMOTIVE
      5. COOLANT MARKET 23
      6. \r\nFIGURE 3 GLOBAL AUTOMOTIVE COOLANT MARKET ANALYSIS,
      7. BY TECHNOLOGY 24
      8. \r\nFIGURE 4 GLOBAL AUTOMOTIVE COOLANT MARKET ANALYSIS, BY
      9. PRODUCT 25
    285. \r\nFIGURE 5 GLOBAL AUTOMOTIVE COOLANT MARKET ANALYSIS, BY VEHICLE
      1. TYPE 26
    286. \r\nFIGURE 6 GLOBAL AUTOMOTIVE COOLANT MARKET ANALYSIS, BY END USE
      1. 27
    287. \r\nFIGURE 7 GLOBAL AUTOMOTIVE COOLANT MARKET ANALYSIS, BY REGION 28
      1. \r\nFIGURE
    288. GLOBAL AUTOMOTIVE COOLANT MARKET: STRUCTURE \\ 29
      1. \r\nFIGURE 9 RESEARCH
      2. PROCESS 30
      3. \r\nFIGURE 10 TOP-DOWN & BOTTOM-UP APPROACHES 33
      4. \r\nFIGURE
    289. MARKET DYNAMICS OF GLOBAL AUTOMOTIVE COOLANT MARKET 36
      1. \r\nFIGURE 12 AVERAGE
      2. AGE OF VEHICLES IN THE US MARKET 37
      3. \r\nFIGURE 13 AVERAGE AGE OF PASSENGER
      4. CARS, BY COUNTRY, 2023 38
      5. \r\nFIGURE 14 SALE OF COMMERCIAL VEHICLES IN THE
      6. AMERICAS, 2023-2032 39
      7. \r\nFIGURE 15 SALE OF COMMERCIAL VEHICLES IN EUROPE,
      8. \r\nFIGURE 16 SALE OF COMMERCIAL VEHICLES IN CHINA AND INDIA,
      9. \r\nFIGURE 17 DRIVERS IMPACT ANALYSIS: AUTOMOTIVE COOLANT MARKET
      10. 40
      11. \r\nFIGURE 18 BRENT CRUDE OIL PRICES (2023-2032) 41
      12. \r\nFIGURE 19
      13. RESTRAINTS IMPACT ANALYSIS: GLOBAL AUTOMOTIVE COOLANT MARKET 42
      14. \r\nFIGURE
    290. GLOBAL ELECTRIC VEHICLES SALES FORECAST (% OF TOTAL VEHICLE SALES), (2023-2032)
      1. 44
      2. \r\nFIGURE 21 NUMBER OF ELECTRIC CARS IN CIRCULATION IN THE US, 2023-2032
      3. 44
      4. \r\nFIGURE 22 SUPPLY CHAIN: GLOBAL AUTOMOTIVE COOLANT MARKET 45
      5. \r\nFIGURE
    291. PORTER'S FIVE FORCES ANALYSIS OF THE GLOBAL AUTOMOTIVE COOLANT MARKET 48
      1. \r\nFIGURE
    292. GLOBAL AUTOMOTIVE COOLANTS MARKET, BY TECHNOLOGY, 2023 (% SHARE) 56
      1. \r\nFIGURE
    293. GLOBAL AUTOMOTIVE COOLANTS MARKET, BY TECHNOLOGY, 2023 TO 2027 (USD MILLION)
      1. 57
    294. \r\nFIGURE 26 GLOBAL AUTOMOTIVE COOLANTS MARKET, BY TECHNOLOGY, 2023 TO
      1. \r\nFIGURE 27 GLOBAL AUTOMOTIVE COOLANTS MARKET,
      2. BY PRODUCT, 2023 (% SHARE) 64
      3. \r\nFIGURE 28 GLOBAL AUTOMOTIVE COOLANTS MARKET,
      4. BY PRODUCT, 2023 TO 2027 (USD MILLION) 65
      5. \r\nFIGURE 29 GLOBAL AUTOMOTIVE
    295. COOLANTS MARKET, BY PRODUCT, 2023 TO 2027 (MILLION GALLONS) 66
      1. \r\nFIGURE
    296. GLOBAL AUTOMOTIVE COOLANTS MARKET, BY VEHICLE TYPE, 2023 (% SHARE) 73
      1. \r\nFIGURE
    297. GLOBAL AUTOMOTIVE COOLANTS MARKET, BY VEHICLE TYPE, 2023 TO 2027 (USD MILLION)
      1. 74
    298. \r\nFIGURE 32 GLOBAL AUTOMOTIVE COOLANTS MARKET, BY VEHICLE TYPE, 2023
      1. TO 2027 (MILLION GALLONS) 75
      2. \r\nFIGURE 33 GLOBAL AUTOMOTIVE COOLANTS MARKET,
      3. BY END USER, 2023 (% SHARE) 82
      4. \r\nFIGURE 34 GLOBAL AUTOMOTIVE COOLANTS MARKET,
      5. BY END USER, 2023 TO 2027 (USD MILLION) 83
      6. \r\nFIGURE 35 GLOBAL AUTOMOTIVE
    299. COOLANTS MARKET, BY END USER, 2023 TO 2027 (MILLION GALLONS) 84
      1. \r\nFIGURE
    300. GLOBAL AUTOMOTIVE COOLANTS MARKET, BY REGION, 2023 (% SHARE) 88
      1. \r\nFIGURE
    301. GLOBAL AUTOMOTIVE COOLANTS MARKET, BY REGION, 2023-2032 (USD MILLION) 89
      1. \r\nFIGURE
    302. GLOBAL AUTOMOTIVE COOLANTS MARKET, BY REGION, 2023-2032 (MILLION GALLONS) 90
      1. \r\nFIGURE
    303. NORTH AMERICA: AUTOMOTIVE COOLANTS MARKET SHARE, BY COUNTRY, 2023 (% SHARE) 91
      1. \r\nFIGURE
    304. EUROPE: AUTOMOTIVE COOLANTS MARKET SHARE, BY COUNTRY, 2023 (% SHARE) 105
      1. \r\nFIGURE
    305. ASIA-PACIFIC: AUTOMOTIVE COOLANTS MARKET SHARE, BY COUNTRY, 2023 (% SHARE) 148
      1. \r\nFIGURE
    306. MIDDLE EAST & AFRICA: AUTOMOTIVE COOLANTS MARKET SHARE, BY COUNTRY, 2023
      1. (% SHARE) 186
      2. \r\nFIGURE 43 LATIN AMERICA: AUTOMOTIVE COOLANTS MARKET SHARE,
      3. BY COUNTRY, 2023 (% SHARE) 207
      4. \r\nFIGURE 44 MAJOR MANUFACTURER STRATEGY ANALYSIS,
      5. \r\nFIGURE 45 BENCHMARKING OF MAJOR COMPETITORS 232
      6. \r\nFIGURE
    307. VALVOLINE INC.: FINANCIAL OVERVIEW SNAPSHOT 234
      1. \r\nFIGURE 47 VALVOLINE
      2. INC.: SWOT ANALYSIS 236
      3. \r\nFIGURE 48 EXXONMOBIL CORPORATION: FINANCIAL OVERVIEW
      4. SNAPSHOT 237
      5. \r\nFIGURE 49 EXXONMOBIL CORPORATION: SWOT ANALYSIS 238
      6. \r\nFIGURE
    308. BASF SE: FINANCIAL OVERVIEW SNAPSHOT 241
      1. \r\nFIGURE 51 BASF SE: SWOT ANALYSIS
      2. 243
      3. \r\nFIGURE 52 TOTAL: FINANCIAL OVERVIEW SNAPSHOT 245
      4. \r\nFIGURE
    309. TOTAL: SWOT ANALYSIS 247
      1. \r\nFIGURE 54 CHEVRON CORPORATION: FINANCIAL OVERVIEW
      2. SNAPSHOT 249
      3. \r\nFIGURE 55 CHEVRON CORPORATION: SWOT ANALYSIS 251
      4. \r\nFIGURE
    310. ROYAL DUTCH SHELL PLC: FINANCIAL OVERVIEW SNAPSHOT 253
      1. \r\nFIGURE 57 ROYAL
      2. DUTCH SHELL PLC: SWOT ANALYSIS 255
      3. \r\nFIGURE 58 OLD WORLD INDUSTRIES, LLC:
      4. SWOT ANALYSIS 258
      5. \r\nFIGURE 59 PRESTONE PRODUCTS CORPORATION: SWOT ANALYSIS
      6. 260
      7. \r\nFIGURE 60 ARTECO: SWOT ANALYSIS 264
      8. \r\nFIGURE 61 RECOCHEM CORPORATION:
      9. SWOT ANALYSIS 268
      10. \r\nFIGURE 62 AMSOIL INC.: SWOT ANALYSIS 270
      11. \r\nFIGURE
    311. MOTUL: SWOT ANALYSIS 272

    Automotive Coolant Product Outlook (USD Billion, 2018-2032)

    • Ethylene Glycol
    • Propylene Glycol
    • Glycerin
    • Others

    Automotive Coolant Vehicle Type Outlook (USD Billion, 2018-2032)

    • Passenger Car
    • Heavy Commercial Vehicles
    • Light Commercial Vehicles
    • Others

    Automotive Coolant Technology Outlook (USD Billion, 2018-2032)

    • Inorganic Additive Technology (IAT)
    • Organic Additive Technology (OAT)
    • Hybrid Organic Acid Technology (HOAT)

    Automotive Coolant End User Outlook (USD Billion, 2018-2032)

    • Original Equipment Manufacturer (OEM)
    • Automotive Aftermarket

    Automotive Coolant Regional Outlook (USD Billion, 2018-2032)

    • North America Outlook (USD Billion, 2018-2032)

      • North America Automotive Coolant by Product
        • Ethylene Glycol
        • Propylene Glycol
        • Glycerin
        • Others
      • North America Automotive Coolant by Vehicle Type
        • Passenger Car
        • Heavy Commercial Vehicles
        • Light Commercial Vehicles
        • Others
      • North America Automotive Coolant by Technology
        • Inorganic Additive Technology (IAT)
        • Organic Additive Technology (OAT)
        • Hybrid Organic Acid Technology (HOAT)
      • North America Automotive Coolant by End User
        • Original Equipment Manufacturer (OEM)
        • Automotive Aftermarket
      • US Outlook (USD Billion, 2018-2032)

      • US Automotive Coolant by Product
        • Ethylene Glycol
        • Propylene Glycol
        • Glycerin
        • Others
      • US Automotive Coolant by Vehicle Type
        • Passenger Car
        • Heavy Commercial Vehicles
        • Light Commercial Vehicles
        • Others
      • US Automotive Coolant by Technology
        • Inorganic Additive Technology (IAT)
        • Organic Additive Technology (OAT)
        • Hybrid Organic Acid Technology (HOAT)
      • US Automotive Coolant by End User
        • Original Equipment Manufacturer (OEM)
        • Automotive Aftermarket
      • CANADA Outlook (USD Billion, 2018-2032)

      • CANADA Automotive Coolant by Product
        • Ethylene Glycol
        • Propylene Glycol
        • Glycerin
        • Others
      • CANADA Automotive Coolant by Vehicle Type
        • Passenger Car
        • Heavy Commercial Vehicles
        • Light Commercial Vehicles
        • Others
      • CANADA Automotive Coolant by Technology
        • Inorganic Additive Technology (IAT)
        • Organic Additive Technology (OAT)
        • Hybrid Organic Acid Technology (HOAT)
      • CANADA Automotive Coolant by End User
        • Original Equipment Manufacturer (OEM)
        • Automotive Aftermarket
    • Europe Outlook (USD Billion, 2018-2032)

      • Europe Automotive Coolant by Product
        • Ethylene Glycol
        • Propylene Glycol
        • Glycerin
        • Others
      • Europe Automotive Coolant by Vehicle Type
        • Passenger Car
        • Heavy Commercial Vehicles
        • Light Commercial Vehicles
        • Others
      • Europe Automotive Coolant by Technology
        • Inorganic Additive Technology (IAT)
        • Organic Additive Technology (OAT)
        • Hybrid Organic Acid Technology (HOAT)
      • Europe Automotive Coolant by End User
        • Original Equipment Manufacturer (OEM)
        • Automotive Aftermarket
      • Germany Outlook (USD Billion, 2018-2032)

      • Germany Automotive Coolant by Product
        • Ethylene Glycol
        • Propylene Glycol
        • Glycerin
        • Others
      • Germany Automotive Coolant by Vehicle Type
        • Passenger Car
        • Heavy Commercial Vehicles
        • Light Commercial Vehicles
        • Others
      • Germany Automotive Coolant by Technology
        • Inorganic Additive Technology (IAT)
        • Organic Additive Technology (OAT)
        • Hybrid Organic Acid Technology (HOAT)
      • Germany Automotive Coolant by End User
        • Original Equipment Manufacturer (OEM)
        • Automotive Aftermarket
      • France Outlook (USD Billion, 2018-2032)

      • France Automotive Coolant by Product
        • Ethylene Glycol
        • Propylene Glycol
        • Glycerin
        • Others
      • France Automotive Coolant by Vehicle Type
        • Passenger Car
        • Heavy Commercial Vehicles
        • Light Commercial Vehicles
        • Others
      • France Automotive Coolant by Technology
        • Inorganic Additive Technology (IAT)
        • Organic Additive Technology (OAT)
        • Hybrid Organic Acid Technology (HOAT)
      • France Automotive Coolant by End User
        • Original Equipment Manufacturer (OEM)
        • Automotive Aftermarket
      • UK Outlook (USD Billion, 2018-2032)

      • UK Automotive Coolant by Product
        • Ethylene Glycol
        • Propylene Glycol
        • Glycerin
        • Others
      • UK Automotive Coolant by Vehicle Type
        • Passenger Car
        • Heavy Commercial Vehicles
        • Light Commercial Vehicles
        • Others
      • UK Automotive Coolant by Technology
        • Inorganic Additive Technology (IAT)
        • Organic Additive Technology (OAT)
        • Hybrid Organic Acid Technology (HOAT)
      • UK Automotive Coolant by End User
        • Original Equipment Manufacturer (OEM)
        • Automotive Aftermarket
      • ITALY Outlook (USD Billion, 2018-2032)

      • ITALY Automotive Coolant by Product
        • Ethylene Glycol
        • Propylene Glycol
        • Glycerin
        • Others
      • ITALY Automotive Coolant by Vehicle Type
        • Passenger Car
        • Heavy Commercial Vehicles
        • Light Commercial Vehicles
        • Others
      • ITALY Automotive Coolant by Technology
        • Inorganic Additive Technology (IAT)
        • Organic Additive Technology (OAT)
        • Hybrid Organic Acid Technology (HOAT)
      • ITALY Automotive Coolant by End User
        • Original Equipment Manufacturer (OEM)
        • Automotive Aftermarket
      • SPAIN Outlook (USD Billion, 2018-2032)

      • Spain Automotive Coolant by Product
        • Ethylene Glycol
        • Propylene Glycol
        • Glycerin
        • Others
      • Spain Automotive Coolant by Vehicle Type
        • Passenger Car
        • Heavy Commercial Vehicles
        • Light Commercial Vehicles
        • Others
      • Spain Automotive Coolant by Technology
        • Inorganic Additive Technology (IAT)
        • Organic Additive Technology (OAT)
        • Hybrid Organic Acid Technology (HOAT)
      • Spain Automotive Coolant by End User
        • Original Equipment Manufacturer (OEM)
        • Automotive Aftermarket
      • Rest Of Europe Outlook (USD Billion, 2018-2032)

      • Rest Of Europe Automotive Coolant by Product
        • Ethylene Glycol
        • Propylene Glycol
        • Glycerin
        • Others
      • Rest Of Europe Automotive Coolant by Vehicle Type
        • Passenger Car
        • Heavy Commercial Vehicles
        • Light Commercial Vehicles
        • Others
      • Rest Of Europe Automotive Coolant by Technology
        • Inorganic Additive Technology (IAT)
        • Organic Additive Technology (OAT)
        • Hybrid Organic Acid Technology (HOAT)
      • REST OF EUROPE Automotive Coolant by End User
        • Original Equipment Manufacturer (OEM)
        • Automotive Aftermarket
    • Asia-Pacific Outlook (USD Billion, 2018-2032)

      • Asia-Pacific Automotive Coolant by Product
        • Ethylene Glycol
        • Propylene Glycol
        • Glycerin
        • Others
      • Asia-Pacific Automotive Coolant by Vehicle Type
        • Passenger Car
        • Heavy Commercial Vehicles
        • Light Commercial Vehicles
        • Others
      • Asia-Pacific Automotive Coolant by Technology
        • Inorganic Additive Technology (IAT)
        • Organic Additive Technology (OAT)
        • Hybrid Organic Acid Technology (HOAT)
      • Asia-Pacific Automotive Coolant by End User
        • Original Equipment Manufacturer (OEM)
        • Automotive Aftermarket
      • China Outlook (USD Billion, 2018-2032)

      • China Automotive Coolant by Product
        • Ethylene Glycol
        • Propylene Glycol
        • Glycerin
        • Others
      • China Automotive Coolant by Vehicle Type
        • Passenger Car
        • Heavy Commercial Vehicles
        • Light Commercial Vehicles
        • Others
      • China Automotive Coolant by Technology
        • Inorganic Additive Technology (IAT)
        • Organic Additive Technology (OAT)
        • Hybrid Organic Acid Technology (HOAT)
      • China Automotive Coolant by End User
        • Original Equipment Manufacturer (OEM)
        • Automotive Aftermarket
      • Japan Outlook (USD Billion, 2018-2032)

      • Japan Automotive Coolant by Product
        • Ethylene Glycol
        • Propylene Glycol
        • Glycerin
        • Others
      • Japan Automotive Coolant by Vehicle Type
        • Passenger Car
        • Heavy Commercial Vehicles
        • Light Commercial Vehicles
        • Others
      • Japan Automotive Coolant by Technology
        • Inorganic Additive Technology (IAT)
        • Organic Additive Technology (OAT)
        • Hybrid Organic Acid Technology (HOAT)
      • Japan Automotive Coolant by End User
        • Original Equipment Manufacturer (OEM)
        • Automotive Aftermarket
      • India Outlook (USD Billion, 2018-2032)

      • India Automotive Coolant by Product
        • Ethylene Glycol
        • Propylene Glycol
        • Glycerin
        • Others
      • India Automotive Coolant by Vehicle Type
        • Passenger Car
        • Heavy Commercial Vehicles
        • Light Commercial Vehicles
        • Others
      • India Automotive Coolant by Technology
        • Inorganic Additive Technology (IAT)
        • Organic Additive Technology (OAT)
        • Hybrid Organic Acid Technology (HOAT)
      • India Automotive Coolant by End User
        • Original Equipment Manufacturer (OEM)
        • Automotive Aftermarket
      • Australia Outlook (USD Billion, 2018-2032)

      • Australia Automotive Coolant by Product
        • Ethylene Glycol
        • Propylene Glycol
        • Glycerin
        • Others
      • Australia Automotive Coolant by Vehicle Type
        • Passenger Car
        • Heavy Commercial Vehicles
        • Light Commercial Vehicles
        • Others
      • Australia Automotive Coolant by Technology
        • Inorganic Additive Technology (IAT)
        • Organic Additive Technology (OAT)
        • Hybrid Organic Acid Technology (HOAT)
      • Australia Automotive Coolant by End User
        • Original Equipment Manufacturer (OEM)
        • Automotive Aftermarket
      • Rest of Asia-Pacific Outlook (USD Billion, 2018-2032)

      • Rest of Asia-Pacific Automotive Coolant by Product
        • Ethylene Glycol
        • Propylene Glycol
        • Glycerin
        • Others
      • Rest of Asia-Pacific Automotive Coolant by Vehicle Type
        • Passenger Car
        • Heavy Commercial Vehicles
        • Light Commercial Vehicles
        • Others
      • Rest of Asia-Pacific Automotive Coolant by Technology
        • Inorganic Additive Technology (IAT)
        • Organic Additive Technology (OAT)
        • Hybrid Organic Acid Technology (HOAT)
      • Rest of Asia-Pacific Automotive Coolant by End User
        • Original Equipment Manufacturer (OEM)
        • Automotive Aftermarket
    • Rest of the World Outlook (USD Billion, 2018-2032)

      • Rest of the World Automotive Coolant by Product
        • Ethylene Glycol
        • Propylene Glycol
        • Glycerin
        • Others
      • Rest of the World Automotive Coolant by Vehicle Type
        • Passenger Car
        • Heavy Commercial Vehicles
        • Light Commercial Vehicles
        • Others
      • Rest of the World Automotive Coolant by Technology
        • Inorganic Additive Technology (IAT)
        • Organic Additive Technology (OAT)
        • Hybrid Organic Acid Technology (HOAT)
      • Rest of the World Automotive Coolant by End User
        • Original Equipment Manufacturer (OEM)
        • Automotive Aftermarket
      • Middle East Outlook (USD Billion, 2018-2032)

      • Middle East Automotive Coolant by Product
        • Ethylene Glycol
        • Propylene Glycol
        • Glycerin
        • Others
      • Middle East Automotive Coolant by Vehicle Type
        • Passenger Car
        • Heavy Commercial Vehicles
        • Light Commercial Vehicles
        • Others
      • Middle East Automotive Coolant by Technology
        • Inorganic Additive Technology (IAT)
        • Organic Additive Technology (OAT)
        • Hybrid Organic Acid Technology (HOAT)
      • Middle East Automotive Coolant by End User
        • Original Equipment Manufacturer (OEM)
        • Automotive Aftermarket
      • Africa Outlook (USD Billion, 2018-2032)

      • Africa Automotive Coolant by Product
        • Ethylene Glycol
        • Propylene Glycol
        • Glycerin
        • Others
      • Africa Automotive Coolant by Vehicle Type
        • Passenger Car
        • Heavy Commercial Vehicles
        • Light Commercial Vehicles
        • Others
      • Africa Automotive Coolant by Technology
        • Inorganic Additive Technology (IAT)
        • Organic Additive Technology (OAT)
        • Hybrid Organic Acid Technology (HOAT)
      • Africa Automotive Coolant by End User
        • Original Equipment Manufacturer (OEM)
        • Automotive Aftermarket
      • Latin America Outlook (USD Billion, 2018-2032)

      • Latin America Automotive Coolant by Product
        • Ethylene Glycol
        • Propylene Glycol
        • Glycerin
        • Others
      • Latin America Automotive Coolant by Vehicle Type
        • Passenger Car
        • Heavy Commercial Vehicles
        • Light Commercial Vehicles
        • Others
      • Latin America Automotive Coolant by Technology
        • Inorganic Additive Technology (IAT)
        • Organic Additive Technology (OAT)
        • Hybrid Organic Acid Technology (HOAT)
      • Latin America Automotive Coolant by End User
        • Original Equipment Manufacturer (OEM)
        • Automotive Aftermarket
    Infographic

    Free Sample Request

    Kindly complete the form below to receive a free sample of this Report

    Get Free Sample

    Customer Strories

    “I am very pleased with how market segments have been defined in a relevant way for my purposes (such as "Portable Freezers & refrigerators" and "last-mile"). In general the report is well structured. Thanks very much for your efforts.”

    Victoria Milne

    Founder
    Case Study
    Chemicals and Materials