Automotive Display Market (2025 - 2035)

Automotive Display Market Size, Share & Growth Analysis Report By Product Type (Center Stack Display, Instrument Cluster Display, Head-Up Display, Rear-Seat Entertainment Display, Others), By Display Technology (Liquid Crystal Display (LCD), Organic Light-Emitting Diode (OLED), Others (MicroLED, E-Paper)), By Vehicle Type (Passenger Cars, Commercial Vehicles), By Display Size (≤5-Inch, 6–10 Inch, >10 Inch) and By Regional (North America, Europe, South America, Asia Pacific, Middle East and Africa) – Industry Growth & Forecast to 2035
ID: MRFR/AT/5489-HCR
100 Pages
Shubham Munde, Swapnil Palwe
Last Updated: July 01, 2026
Automotive Display Market
Market Size
Forecast Period2025-2035
CAGR (2025-2035)10.3%
2025 Market SizeUSD 26.80 Billion
2035 Market SizeUSD 71.42 Billion
Key Players
Continental AG
Robert Bosch GmbH
LG Display Co., Ltd.
Samsung Display Co., Ltd.
BOE Technology Group
Denso Corporation
Opportunities
  • Wide-Format and Curved Display Integration
  • AR-HUD Penetration in Mid-Range Vehicles
  • Emerging-Market Commercial Vehicle Digitization

Automotive Display Market Summary

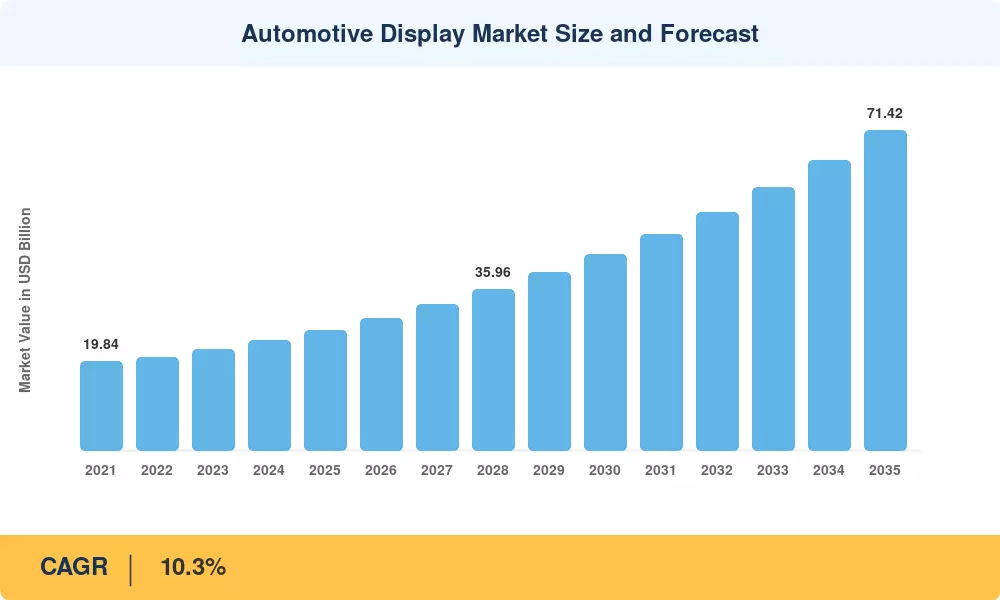
The Automotive Display Market reached an estimated USD 26.80 billion in 2025 and is projected to expand from USD 29.56 billion in 2026 to USD 71.42 billion by 2035, registering a compound annual growth rate of 10.3% across the forecast window. Two structural forces anchor this trajectory: the rapid electrification of passenger fleets the IEA projects global EV sales surpassing 20 million units by 2026 [1]  and the parallel shift toward software-defined vehicle architectures that demand higher-resolution, larger-format cockpit screens.

Legacy analog gauge clusters and single-purpose infotainment units are giving way to integrated digital cockpits where a unified computing platform drives instrument clusters, center stacks, heads-up displays, and passenger screens simultaneously. Continental AG's investment of over EUR 1 billion in its automotive HMI division between 2023 and 2025 signals the capital intensity required to serve this transition [2]. Regulatory action is also accelerating adoption: Euro NCAP's Driver Engagement Protocol v1.0 now awards safety credits for augmented-reality head-up displays, prompting OEMs to specify display-rich dashboards across mid-range trims [3].

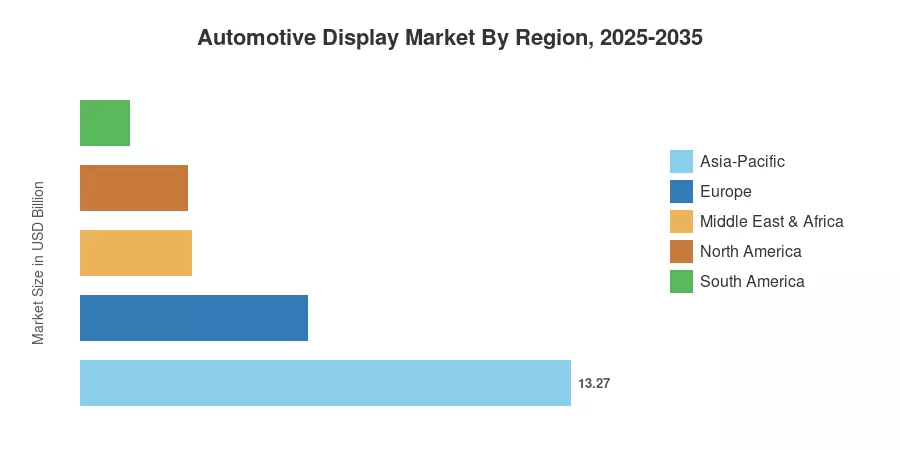
Asia-Pacific commands roughly 49.5% of the Automotive Display Market, propelled by Chinese EV production and panel-maker capacity expansions from BOE and CSOT. Europe holds the second-largest share at approximately 23%, driven by premium German automakers embedding wide-format screens. North America, accounting for about 19%, is the fastest-accelerating Western region as connected-vehicle mandates from NHTSA expand digital instrument requirements [4]. The decade ahead will be defined by how quickly OLED cost curves converge with LCD pricing — and which suppliers capture the resulting volume swing.


Key Report Takeaways

• By Product Type & Display Technology

  • Center stack displays accounted for approximately 43% of the Automotive Display Market in 2025, underscoring their role as the primary HMI surface in modern cockpits.
  • Head-up displays are forecast to advance at a 10.8% CAGR through 2035, benefiting from Euro NCAP incentives and AR overlay integration.
  • Liquid crystal displays represented roughly 61% of total display shipments by value in 2025, although OLED units are expanding at an 11.5% CAGR as manufacturing yields improve.

• By Vehicle Type & Display Size

  • Passenger cars dominated the Automotive Display Market with an estimated 81% share in 2025.
  • Panels exceeding 10 inches are projected to grow at a 12.0% CAGR through 2035, reflecting OEM preference for wide-format and curved installations.

• By Region

  • Asia-Pacific captured approximately 49.5% of the Automotive Display Market in 2025, with China alone representing over half of the regional revenue.
  • Commercial vehicles constitute the fastest-growing end-use segment globally, registering a 12.6% CAGR as fleet operators digitize dashboards.


Automotive Display Market Size and Forecast (2021–2035)

Market estimates draw on a triangulated methodology combining OEM procurement data, panel-maker shipment disclosures, and tier-1 integrator revenue filings, cross-validated against vehicle production volumes from OICA and regional trade statistics.
Automotive Display Market Size and Forecast
Our Impact
Enabled $4.3B Revenue Impact for Fortune 500 and Leading Multinationals
Partnering with 2000+ Global Organizations Each Year
30K+ Citations by Top-Tier Firms in the Industry

Driver Impact Analysis

Driver ~% Impact on CAGR Geographic Relevance Impact Timeline
EV electrification and digital cockpit demand ~25% Global Short-term (≤2 yr)
Software-defined vehicle architectures ~20% North America, Europe Medium-term (2–4 yr)
Euro NCAP driver engagement protocols ~15% Europe, Asia-Pacific Short-term (≤2 yr)
AR-HUD integration in mid-range vehicles ~12% Europe, China Medium-term (2–4 yr)
Chinese EV production scaling ~12% Asia-Pacific Short-term (≤2 yr)
Consumer preference for larger screen formats ~9% Global Long-term (≥4 yr)
Autonomous driving display requirements ~7% North America, Europe Long-term (≥4 yr)


EV Electrification and Digital Cockpit Demand

Battery-electric vehicles arrive without mechanical instrument linkages, making digital displays the default interface from day one. The IEA's Global EV Outlook 2025 projects cumulative global EV stock to exceed 100 million units by 2027, each requiring at a minimum an instrument cluster and center stack screen [1]. This structural volume floor gives panel makers a guaranteed demand runway that traditional ICE refreshes never provided, compressing payback periods on new fab lines.

Software-Defined Vehicle Architectures

Automakers, including Volkswagen, GM, and Hyundai, have publicly committed over USD 30 billion collectively to SDV platform development between 2024 and 2028 [9]. These architectures centralize compute, enabling over-the-air updates that add display-driven features post-sale — from new gauge themes to expanded navigation overlays. The result is rising display content per vehicle and a willingness among OEMs to specify higher-resolution panels.

Regulatory Driver Engagement Incentives

Euro NCAP's Driver Engagement Protocol v1.0, effective from January 2025, assigns up to four points for vehicles equipped with augmented-reality head-up displays that overlay navigation guidance onto the driver's sightline [3]. Since OEMs calibrate trim specifications to maximize Euro NCAP star ratings, the protocol directly lifts HUD attach rates across European model lines and is expected to influence parallel standards in ASEAN and Latin America by 2028.

Chinese EV Production Scaling

China produced over 9.5 million new energy vehicles in 2024, and domestic panel suppliers BOE, CSOT, and Tianma collectively shipped more than 60 million automotive-grade displays during the same period [8]. This concentration of demand and supply within a single geography is compressing lead times, lowering per-unit costs, and generating technology spillovers — particularly in curved AMOLED panels — that are now being exported to European and North American OEM programs.


Restraints Impact Analysis

Restraint impact percentages below represent estimated drag on the headline CAGR and are directional rather than additive. Each figure reflects the restraint's potential to slow adoption or increase cost within its relevant timeframe.

Restraint ~% Drag on CAGR Geographic Relevance Impact Timeline
Display driver IC supply constraints ~–2.0% Global Short-term (≤2 yr)
OLED cost premium over LCD ~–1.5% Global Medium-term (2–4 yr)
UNECE cybersecurity & type-approval regs ~–1.2% Europe, Asia-Pacific Medium-term (2–4 yr)
Driver distraction scrutiny limiting screen placement ~–0.8% North America, Europe Short-term (≤2 yr)
Rare-earth and indium price volatility ~–0.5% Global Long-term (≥4 yr)


Display Driver IC Supply Constraints

Automotive-grade display driver ICs have validation cycles of 12-18 months, and capacity at the 40 nm and 28 nm nodes for these chips is still constrained. Automotive is just a small part of these mature nodes at TSMC and UMC in Taiwan, causing periodic allocation shortages that can push vehicle launches back one to two quarters [6]. The scarcity peaked in 2022, but there is still a residual constraint, especially for high-channel-count drivers needed by ultra-wide displays.


OLED Cost Premium

A 12.3-inch automotive OLED panel still costs approximately 2.2× its LCD equivalent, according to DSCC estimates [13]. While the gap is narrowing as Samsung Display and LG Display ramp Gen 8.5 OLED fabs, cost parity is unlikely before 2030. This pricing overhang keeps OLED confined largely to premium segments, slowing its penetration into the high-volume mid-range tiers where the Automotive Display Market generates the bulk of unit shipments.

UNECE Cybersecurity Regulations

The OEMs are required to show end-to-end protection of linked display subsystems [14] under the UNECE Regulation No. 155 and to implement cyber-security management systems for all new vehicle types marketed in the EU, Japan and South Korea. Compliance extends cockpit platform validation cycles by six to nine months and increases engineering costs by an estimated 8-12%, especially for tier-2 display module integrators without in-house cybersecurity knowledge.


Automotive Display Market Opportunities

Wide-Format and Curved Display Integration

Some high-end OEMs have gone for dashboard-spanning displays with over 50 inches of combined screen real estate. With yields improving on Gen 8.5 curved panel lines, production costs are dropping fast enough to make pillar-to-pillar installations possible for volume models by 2029, opening up a sizable income source for panel suppliers and integrators.


AR-HUD Penetration in Mid-Range Vehicles

Augmented-reality head-up displays currently feature in fewer than 5% of new vehicles globally. Declining waveguide combiner costs — projected to fall below USD 35 per unit by 2028 — will enable fitment in vehicles priced under USD 30,000, potentially tripling addressable volumes within three years.

Emerging-Market Commercial Vehicle Digitization

India's Bharat NCAP crash-test regime and Brazil's CONTRAN digital tachograph mandate are accelerating cockpit modernization in commercial fleets that historically relied on analog instruments. The Automotive Display Market in these regions remains underpenetrated, representing a greenfield opportunity for ruggedized LCD and hybrid-OLED module suppliers.

Data Monetization Through Connected Displays

OEMs are experimenting with subscription services supplied through center-stack and passenger screens, from real-time navigation overlays to in-cabin commerce. Data services for connected cars might produce USD 250-400 billion in annual income globally (USD 250-400 billion USD) by 2030, with the display being the main monetization surface for these offers [11].


Flexible and Foldable Display Innovation

Advances in polyimide substrate technology are enabling non-planar display form factors that conform to curved dash surfaces, door panels, and even steering-wheel hubs. Samsung Display's 2024 demonstration of a rollable automotive panel signals the beginning of a form-factor diversification cycle that could reshape cockpit design philosophy over the next decade.


Automotive Display Market Future Outlook

AI-Driven Adaptive Cockpits

Generative-AI personal assistants embedded in cockpit software stacks will transform displays from passive information surfaces into context-aware interfaces. NVIDIA's DRIVE IX platform, already adopted by BYD, Hyundai, and Zeekr, uses driver-state cameras and NLP models to dynamically reconfigure on-screen content — dimming non-essential widgets during highway driving and expanding navigation detail in complex urban environments [12].

Autonomous Driving and Reconfigurable Interiors

As Level 3 and Level 4 autonomy expands, the windshield-centric display paradigm will give way to entertainment-oriented, multi-passenger screen layouts. SAE Level 4 operating domains, expected to cover limited urban corridors in Europe and China by 2030, will unlock demand for retractable or repositionable displays that adapt to manual and autonomous modes — a category that does not meaningfully exist today [12].

Electrification Supercycle Sustaining Volume Growth

BloombergNEF projects global passenger EV sales will surpass 30 million units annually by 2030 [19]. Every one of those vehicles ships with at least two digital displays, establishing a structural demand floor that insulates the Automotive Display Market from the cyclical swings of ICE production. Battery cost declines are simultaneously lowering EV price points, pushing display-rich cockpits into mass-market segments.

Sustainability and Circular-Economy Pressures

The European Commission's proposed End-of-Life Vehicles Regulation revision mandates minimum recycled-content thresholds for electronic components by 2031 [20]. Display manufacturers are responding with design-for-disassembly panel architectures and indium-recovery programs. Companies that integrate circularity into their supply chains early will gain a procurement advantage as OEM sustainability scorecards tighten.


Automotive Display Market Segmentation

By Product Type

Segment Key Metric Primary Demand Driver
Center Stack Display ~43% share (2025) Primary HMI interface for infotainment and climate
Instrument Cluster Display USD 6.43 Billion (2025) ICE-to-digital gauge migration
Head-Up Display 10.8% CAGR (2026–2035) AR overlay navigation; Euro NCAP incentives
Rear-Seat Entertainment Display USD 1.47 Billion (2025) Premium-segment content consumption
Others 3.2% share (2025) Mirror replacements, pillar displays


Center stack displays remain the highest-value product category within the Automotive Display Market because they serve as the focal point for infotainment, HVAC control, and increasingly, vehicle settings. Average screen sizes in this category have grown from 8 inches in 2020 to over 12 inches in 2025, and 15-inch panels are becoming common in new EV platforms. Head-up displays, while a smaller share of units, command premium ASPs and are poised to absorb a disproportionate share of incremental spending as AR waveguide combiners become cost-competitive.

By Display Technology

Segment Key Metric Primary Demand Driver
Liquid Crystal Display (LCD) ~61% share (2025) Cost advantage; mature supply chain
Organic Light-Emitting Diode (OLED) 11.5% CAGR (2026–2035) Superior contrast; flexible form factors
Others (MicroLED, E-Paper) USD 0.78 Billion (2025) Niche instrument and ambient lighting uses


LCD panels continue to dominate the Automotive Display Market by both volume and value, supported by a deeply amortized manufacturing base and price points that remain roughly half those of equivalent OLED modules. OLED is gaining ground rapidly, however, particularly in premium Chinese and European models where curved and edge-to-edge designs justify the cost premium. Samsung Display and LG Display are both investing in tandem-stack OLED architectures that extend panel lifetimes beyond 30,000 hours — a critical threshold for automotive warranty requirements.

By Vehicle Type

Segment Key Metric Primary Demand Driver
Passenger Cars ~81% share (2025) Consumer-driven cockpit digitization
Commercial Vehicles 12.6% CAGR (2026–2035) Fleet telematics mandates; digital tachographs


Passenger cars generate the overwhelming majority of display revenue, but commercial vehicles are catching up. Regulatory mandates requiring digital speed indicators, electronic mirrors, and telematics dashboards are converting what was historically a single analog gauge cluster into a two- or three-screen cockpit, dramatically increasing display content per truck.

By Display Size

Segment Key Metric Primary Demand Driver
≤5-Inch 8.2% share (2025) Rear-camera monitors; secondary info screens
6–10 Inch ~59% share (2025) Standard center stack and cluster sizes
>10 Inch 12.0% CAGR (2026–2035) Wide-format and curved panel preference


The 6–10 inch segment captures the largest share because it encompasses the most common instrument cluster and center stack sizes across mainstream vehicle platforms. Panels exceeding 10 inches, however, are the fastest-growing category as OEMs pursue differentiation through expansive screen layouts — a trend that feeds directly into higher ASPs and increased glass content per vehicle.


Regional Market Share Analysis

Region Key Metric (2025) Primary Investment Themes
Asia-Pacific 49.5% share Chinese EV volume; domestic panel fab expansion
Europe USD 6.16 Billion Premium-segment wide-format adoption; Euro NCAP credits
North America 10.8% CAGR (2026–2035) SDV platform rollouts; NHTSA digital instrument guidance
South America USD 1.34 Billion CONTRAN mandates; commercial fleet digitization
Middle East & Africa 11.2% CAGR (2026–2035) Smart-city transport programs; fleet modernization
Total USD 26.80 Billion

The Automotive Display Market exhibits pronounced regional concentration, with Asia-Pacific and Europe together accounting for more than 72% of global value. Growth differentials across regions reflect varying EV adoption timelines, regulatory frameworks, and local panel-manufacturing ecosystems.


North America

Country Key Metric Key Driver
United States 78% of regional share Detroit Big Three SDV investments
Canada CAGR 10.5% EV incentive programs (iZEV)
Mexico USD 0.42 Billion Automotive export manufacturing hub


North American demand is anchored by General Motors' Ultifi and Ford's next-gen digital platform, both of which specify multi-display cockpits as standard across volume nameplates. NHTSA's 2024 advance notice of proposed rulemaking on digital rear-view mirrors and instrument cluster standards is expected to codify minimum display specifications, broadening the addressable market beyond premium trims [4].

Europe

Country Key Metric Key Driver
Germany 32% of regional share Volkswagen, BMW, Mercedes cockpit programs
United Kingdom CAGR 10.1% Jaguar Land Rover electrification
France USD 0.68 Billion Stellantis STLA platform display integration
Italy CAGR 9.8% Ferrari and Maserati premium digital cockpits
Spain USD 0.35 Billion SEAT/CUPRA EV production scaling
Nordic Countries CAGR 11.3% High EV penetration (Norway >80% BEV share)
Russia USD 0.18 Billion Domestic automaker localization
Rest of Europe CAGR 9.5% EU Green Deal fleet renewal incentives


Germany's premium OEMs are the global benchmark for display content per vehicle. Mercedes-Benz's MBUX Hyperscreen spans 56 inches across the dashboard, and BMW's Neue Klasse platform — launching in 2025 — replaces conventional gauges entirely with a panoramic display surface [2]. Euro NCAP protocols further reinforce this trajectory across the broader European market.

Asia-Pacific

Country Key Metric Key Driver
China 58% of regional share NEV production; BOE, CSOT domestic supply
India CAGR 12.4% Bharat NCAP; Tata, Mahindra EV launches
Japan USD 1.85 Billion Toyota, Honda SDV platform investments
South Korea 14% of regional share Samsung Display, LG Display home-market advantage
ASEAN CAGR 11.8% Thai EV hub; Indonesian nickel-to-EV supply chain
Rest of Asia-Pacific USD 0.54 Billion Australia EV incentives; NZ feebate scheme


China's dominance reflects both demand and supply dynamics. Domestic OEMs BYD, NIO, and Li Auto are specifying AMOLED center-stack screens as standard in models priced as low as RMB 150,000 — a price tier where European competitors still use LCD [8]. Panel suppliers BOE and CSOT commissioned three new automotive-grade lines in 2024 alone, adding over 120,000 substrate-starts per month of combined capacity.

South America

Country Key Metric Key Driver
Brazil 64% of regional share CONTRAN digital tachograph mandate; Stellantis local production
Argentina CAGR 10.9% Commercial-vehicle fleet renewal cycle
Rest of South America USD 0.19 Billion Chile EV bus programs; Colombia fleet digitization


Brazil's regulatory environment is the primary catalyst. CONTRAN Resolution 982 requires digital speed displays in all new commercial vehicles from 2026, creating a mandatory upgrade cycle for instrument clusters across the country's 2.3-million-unit commercial fleet [17].

Middle East & Africa

Country Key Metric Key Driver
Saudi Arabia 28% of regional share Vision 2030 automotive localization
UAE CAGR 11.6% Smart-city autonomous shuttle programs
South Africa USD 0.21 Billion Automotive export hub for right-hand-drive markets
Egypt CAGR 10.4% Domestic assembly expansion under EDA incentives
Rest of MEA USD 0.14 Billion Fleet modernization in East Africa and Morocco


Saudi Arabia's LUCID Motors joint-venture assembly plant in Jeddah and the kingdom's push to localize EV component manufacturing under Vision 2030 are creating demand for cockpit display modules that were previously imported entirely from Asia [18]. The UAE's Roads and Transport Authority continues to pilot autonomous shuttle fleets in Dubai, each equipped with multi-screen passenger information systems.


Automotive Display Market By Region, 2025-2035

Competitive Benchmarking

The Automotive Display Market exhibits medium concentration, with the top five players collectively holding an estimated 38–45% of global revenue. The competitive field spans pure-play panel manufacturers (BOE, LG Display, Samsung Display), diversified automotive tier-1 suppliers (Continental, Bosch, Denso, Visteon), and vertically integrated display-module specialists (Japan Display, Innolux). Innovation intensity is high, as evidenced by over 1,200 automotive-display-related patent filings in 2024 alone.

Company Est. Revenue Share Range Key Offerings for Automotive Display Market Strategic Positioning
Continental AG ~7–10% Instrument clusters, center stacks, AR-HUDs Tier-1 integrator with full cockpit platform
Robert Bosch GmbH ~6–9% Digital clusters, commercial-vehicle displays Scale across ICE and EV platforms
LG Display Co., Ltd. ~6–8% P-OLED automotive panels, flexible modules Leading OLED automotive supplier
Samsung Display Co., Ltd. ~5–8% AMOLED center stacks, tandem-stack technology Premium segment and Chinese OEM partnerships
BOE Technology Group ~5–7% LCD and AMOLED panels, wide-format modules Cost-competitive high-volume Chinese supplier
Denso Corporation ~4–6% Instrument clusters, HUDs, integrated cockpits Toyota-group alignment; hybrid-ICE expertise
Visteon Corporation ~4–6% SmartCore cockpit controllers, digital clusters Pure-play cockpit electronics specialist
Japan Display Inc. ~3–5% LTPS LCD panels, transparent displays Automotive-focused after smartphone exit
Panasonic Holdings Corp. ~3–5% IVI systems, HUDs, rear-seat entertainment Deep integration with Tesla and Toyota
Innolux Corporation ~2–4% Automotive LCD panels, ultra-wide displays Foxconn synergy for cost-efficient supply


Recent News & Developments


  • Samsung Display (June 2024): Showed a 34” rollable OLED automotive panel at SID Display Week, with volume production for premium OEM programs by 2027 [13].


  • HARMAN (June 2025)brings Neo QLED automotive displays to the Tata Harrier.ev, providing consumer-grade brightness and contrast to cars.


Automotive Display Market Report Scope

Parameter Detail
Market Scope Global Automotive Display Market covering display hardware, integration services, and embedded software
Study Period 2021–2035
CAGR (2026–2035) 10.3%
Base-Year Market Size (2025) USD 26.80 Billion
Forecast-End Market Size (2035) USD 71.42 Billion
Fastest Growing Segments OLED (by technology); Commercial Vehicles (by vehicle type); >10-Inch (by size)
Companies Profiled Continental, Bosch, LG Display, Samsung Display, BOE, Denso, Visteon, Japan Display, Panasonic, Innolux
Valuation Currency USD Billion


FAQs

How do automotive display procurement cycles differ from consumer-electronics panel buying?
Automotive panels require AEC-Q qualification and typically involve 18–24 month lead times versus 3–6 months for consumer devices. OEMs lock in multi-year supply agreements, making switching costs substantially higher [13].
What testing standards must automotive displays pass before OEM approval?
Panels must satisfy IEC 62368 safety, ISO 16750 environmental durability, and OEM-specific optical-bonding and sunlight-readability benchmarks. Qualification typically spans 12–18 months per platform [7].
How are OEMs managing glare and sunlight readability in larger displays?
Anti-reflective optical bonding and adaptive brightness algorithms rated above 1,000 nits are now standard in new programs. Some OEMs also specify polarizer-level treatments to minimize washout at extreme sun angles [15].
What role does haptic feedback play in the Automotive Display Market?
Haptic actuators beneath touchscreens simulate button-press confirmation, reducing eyes-off-road time. Continental and Bosch both offer integrated haptic-display modules that comply with Euro NCAP's distraction limits [3].
How do UNECE cybersecurity rules affect display-module suppliers?
Regulation No. 155 requires tier-2 suppliers to implement certified cybersecurity management systems. Compliance adds 8–12% to engineering costs and extends validation timelines by roughly six months [14].
Are transparent displays viable for automotive windshield integration?
Japan Display has demonstrated transparent LCD prototypes exceeding 60% transmittance, but production yields remain below 40%. Volume adoption is unlikely before 2030 at the earliest [22].
How does the Automotive Display Market address aftermarket replacement demand?
Aftermarket currently accounts for less than 5% of total display revenue. Most units are dealer-channel replacements because OEM-specific calibration and CAN-bus integration limit independent aftermarket participation [7].    
Author
Author
Author Profile
Shubham Munde LinkedIn
Team Lead - Research
Shubham brings over 7 years of expertise in Market Intelligence and Strategic Consulting, with a strong focus on the Automotive, Aerospace, and Defense sectors. Backed by a solid foundation in semiconductors, electronics, and software, he has successfully delivered high-impact syndicated and custom research on a global scale. His core strengths include market sizing, forecasting, competitive intelligence, consumer insights, and supply chain mapping. Widely recognized for developing scalable growth strategies, Shubham empowers clients to navigate complex markets and achieve a lasting competitive edge. Trusted by start-ups and Fortune 500 companies alike, he consistently converts challenges into strategic opportunities that drive sustainable growth.
Co-Author
Co-Author Profile
Swapnil Palwe LinkedIn
Team Lead - Research
With a technical background as Bachelor's in Mechanical Engineering, with MBA in Operations Management , Swapnil has 6+ years of experience in market research, consulting and analytics with the tasks of data mining, analysis, and project execution. He is the POC for our clients, for their consulting projects running under the Automotive/A&D domain. Swapnil has worked on major projects in verticals such as Aerospace & Defense, Automotive and many other domain projects. He has worked on projects for fortune 500 companies' syndicate and consulting projects along with several government projects.

Research Approach


Secondary Research

The secondary research process involved comprehensive analysis of regulatory databases, technical standards publications, peer-reviewed engineering journals, industry whitepapers, and authoritative automotive organizations. Key sources included the US Department of Transportation (DOT), National Highway Traffic Safety Administration (NHTSA), European Automobile Manufacturers' Association (ACEA), Society of Automotive Engineers (SAE International), International Organization for Standardization (ISO) automotive technical committees, Japan Automobile Manufacturers Association (JAMA), China Association of Automobile Manufacturers (CAAM), International Energy Agency (IEA) Global EV Outlook, US Bureau of Transportation Statistics, EU Eurostat Transport Database, OECD International Transport Forum, and automotive ministry reports from key manufacturing markets. These sources were used to collect vehicle production statistics, safety compliance data, display technology standards, EV adoption trends, and market landscape analysis for TFT LCD, AMOLED, PMOLED, and emerging micro-LED display technologies across telematics, navigation, and infotainment applications.

Additional specialized sources included International Data Corporation (IDC) Automotive Technology Tracker, IHS Markit / S&P Global Mobility, McKinsey Center for Future Mobility, Boston Consulting Group (BCG) Automotive practice, and display industry associations such as the Society for Information Display (SID) and Organic Electronics Association.


Primary Research

In order to gather both qualitative and quantitative insights, supply-side and demand-side stakeholders were interviewed during the primary research process. CEOs, VPs of Product Development, heads of automotive business units, and directors of display technology from tier-1 automotive display manufacturers, panel makers, and system integrators were examples of supply-side sources. Chief technology officers from OEMs, heads of cockpit electronics, procurement directors from automakers, and user experience leads from premium car brands and EV startups were examples of demand-side sources. Primary research obtained information on display adoption trends, pricing tactics, and supply chain dynamics in addition to validating market segmentation, technology roadmaps, and manufacturing schedules.

Primary Respondent Breakdown:

By Designation: C-level Primaries (28%), Director Level (35%), Others (37%)

By Region: North America (30%), Europe (32%), Asia-Pacific (33%), Rest of World (5%)


Market Size Estimation

Global market valuation was derived through revenue mapping and production volume analysis. The methodology included:

Identification of 40+ key manufacturers across North America, Europe, Asia-Pacific, and Latin America

Product mapping across TFT LCD, AMOLED, PMOLED, and emerging display categories by application (infotainment, instrument cluster, head-up display, rear-seat entertainment)

Analysis of reported and modeled annual revenues specific to automotive display portfolios

Coverage of manufacturers representing 75-80% of global market share in 2024

Extrapolation using bottom-up (vehicle production volume × display penetration × ASP by region) and top-down (manufacturer revenue validation) approaches to derive segment-specific valuations by display type, size category, and vehicle application

Download Free Sample

Kindly complete the form below to receive a free sample of this Report

Download PDF ×

We do not share your information with anyone. However, we may send you emails based on your report interest from time to time. You may contact us at any time to opt-out.
















