Download Free Sample
Kindly complete the form below to receive a free sample of this Report
Automotive Engineering and Design Market Size, Share and Trends Analysis Research Report Information By End Use (Passenger Vehicles, Commercial Vehicles, Electric Vehicles, and Hybrid Vehicles), By Technology (Computer-Aided Design, Simulation Software, Prototyping Tools, and Manufacturing Technologies), By Application (Automotive Design, Vehicle Dynamics, Powertrain Engineering, Safety Engineering, and Thermal Management), By Material Type (Metals, Plastics, Composites, and Elastomers), By Regulatory Compliance (Safety Standards, Environmental Regulations, and Quality Assurance), And By Region – Market Forecast Till 2035.
As per MRFR analysis, the Automotive Engineering and Design Market Size was estimated at 50.0 USD Billion in 2024. The Automotive Engineering and Design industry is projected to grow from 52.74 USD Billion in 2025 to 90.0 USD Billion by 2035, exhibiting a compound annual growth rate (CAGR) of 5.49% during the forecast period 2025 - 2035.
The automotive engineering and design market is increasingly oriented towards sustainability and advanced technologies.
| 2024 Market Size | 50.0 (USD Billion) |
| 2035 Market Size | 90.0 (USD Billion) |
| CAGR (2025 - 2035) | 5.49% |
Toyota Motor Corporation (JP), Volkswagen AG (DE), General Motors Company (US), Ford Motor Company (US), Daimler AG (DE), Honda Motor Co., Ltd. (JP), BMW AG (DE), Nissan Motor Co., Ltd. (JP), Hyundai Motor Company (KR)
Our Impact
Enabled $4.3B Revenue Impact for Fortune 500 and Leading Multinationals
Partnering with 2000+ Global Organizations Each Year
30K+ Citations by Top-Tier Firms in the Industry
The landscape of Automotive Engineering and Design is currently undergoing a transformative phase, characterized by rapid advancements in technology and evolving consumer preferences. The integration of artificial intelligence and machine learning into design processes appears to enhance efficiency and innovation, allowing for more personalized vehicle experiences. Furthermore, the increasing emphasis on sustainability is reshaping engineering practices, as manufacturers strive to reduce environmental impact while meeting regulatory standards. This shift not only influences material selection but also drives the development of electric and hybrid vehicles, which are becoming more prevalent in the market. In addition, the rise of autonomous driving technology is significantly altering the design and engineering paradigms within the automotive sector. Companies are investing heavily in research and development to create vehicles that can operate independently, which necessitates a rethinking of safety protocols and user interfaces. As these trends continue to evolve, the Automotive Engineering and Design field is likely to witness a convergence of traditional engineering principles with cutting-edge technologies, fostering an environment ripe for innovation and growth.
The focus on sustainability is increasingly influencing Automotive Engineering and Design. Manufacturers are exploring eco-friendly materials and processes to minimize environmental impact. This trend reflects a broader societal shift towards greener practices, prompting companies to innovate in ways that align with consumer values.
The incorporation of artificial intelligence and machine learning into design processes is transforming the automotive landscape. These technologies enhance efficiency, enabling more precise and personalized vehicle designs. As a result, companies are likely to improve their competitive edge through innovative solutions.
The development of autonomous driving technology is reshaping the Automotive Engineering and Design sector. As manufacturers invest in creating self-driving vehicles, they must reconsider safety measures and user interactions. This trend suggests a future where vehicles operate independently, altering traditional design paradigms.
Safety remains a paramount concern in the Automotive Engineering and Design., driving the development of advanced safety features. The integration of technologies such as adaptive cruise control, lane-keeping assistance, and automatic emergency braking is becoming standard in new vehicle models. In 2025, it is projected that vehicles equipped with advanced driver-assistance systems (ADAS) will represent over 50% of new car sales. This trend is largely influenced by consumer demand for safer vehicles and regulatory requirements aimed at reducing road fatalities. Automotive engineers are tasked with designing systems that not only meet these safety standards but also enhance the overall driving experience. The focus on safety is prompting innovations in materials and structural design, ensuring that vehicles can withstand impacts while protecting occupants. As a result, the Automotive Engineering and Design. is evolving to prioritize safety without compromising performance or aesthetics.
The shift towards electrification in the Automotive Engineering and Design. is reshaping traditional paradigms. As governments implement stricter emissions regulations, the demand for electric vehicles (EVs) is surging. In 2025, it is estimated that EV sales will account for approximately 30% of total vehicle sales, reflecting a significant increase from previous years. This transition necessitates innovative engineering solutions, including advanced battery technologies and efficient powertrains. Automotive manufacturers are investing heavily in research and development to enhance the performance and range of electric vehicles. Consequently, the Automotive Engineering and Design. is witnessing a transformation in design methodologies, focusing on lightweight materials and aerodynamics to optimize energy efficiency. The electrification trend not only influences vehicle design but also impacts supply chains, necessitating new partnerships and collaborations within the industry.
Regulatory compliance is a critical driver in the Automotive Engineering and Design Industry, shaping design and engineering practices. As governments worldwide implement stricter regulations regarding emissions, safety, and fuel efficiency, automotive manufacturers must adapt their designs to meet these standards. In 2025, it is projected that compliance with new emissions regulations will require significant modifications in engine design and vehicle architecture. This necessitates a proactive approach from engineers, who must integrate compliance considerations into the design process from the outset. Additionally, the evolving regulatory landscape encourages innovation, as manufacturers seek to develop technologies that not only meet but exceed regulatory requirements. The focus on compliance is fostering collaboration between automotive engineers, regulatory bodies, and industry stakeholders, ensuring that the Automotive Engineering and Design Industry remains responsive to changing standards and consumer expectations.
Sustainability is increasingly becoming a focal point in the Automotive Engineering and Design., influencing manufacturing practices and material selection. Companies are adopting eco-friendly materials and processes to minimize their environmental footprint. In 2025, it is anticipated that the use of recycled materials in vehicle production will rise by 20%, reflecting a broader commitment to sustainability. This shift not only addresses consumer preferences for environmentally responsible products but also aligns with regulatory pressures to reduce waste and emissions. Automotive engineers are exploring innovative manufacturing techniques, such as 3D printing and modular design, which can reduce material waste and energy consumption. The emphasis on sustainability is prompting a reevaluation of the entire supply chain, encouraging collaboration among manufacturers, suppliers, and consumers to promote a circular economy within the Automotive Engineering and Design Industry.
The ongoing digital transformation is profoundly impacting the Automotive Engineering and Design Industry, particularly through the integration of connectivity features in vehicles. As consumers increasingly demand seamless connectivity, automotive manufacturers are incorporating advanced infotainment systems and vehicle-to-everything (V2X) communication technologies. By 2025, it is expected that over 70% of new vehicles will be equipped with some form of connectivity, enhancing the driving experience and enabling new services. This trend necessitates a shift in design philosophy, as engineers must consider software and hardware integration from the outset. Furthermore, the rise of connected vehicles presents opportunities for data analytics, allowing manufacturers to gather insights on consumer behavior and vehicle performance. Consequently, the Automotive Engineering and Design Industry is evolving to embrace digital solutions that enhance functionality and user experience.
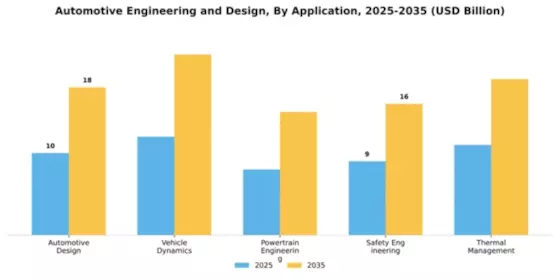
In the Automotive Engineering and Design sector, the Automotive Design segment stands out as the largest component, dominating the market with a significant share due to its essential role in the creation of vehicles from conceptualization to production. This segment encompasses various aspects including aesthetic design, structural integrity, and integration of electronic systems, making it crucial for OEMs to differentiate their products in a competitive landscape. Meanwhile, Vehicle Dynamics is emerging as the fastest-growing segment, driven by advancements in technology and increased consumer demand for superior handling and safety features. This trend reflects a shift towards enhancing the overall driving experience through sophisticated design and engineering solutions.
Automotive Design (Dominant) vs. Vehicle Dynamics (Emerging)
The Automotive Design segment is a cornerstone of the automotive engineering landscape, heavily focused on aesthetics, functionality, and innovation. This segment not only incorporates traditional design practices but also embraces cutting-edge technologies such as CAD and 3D modeling to streamline the design process. Its dominance can be attributed to the continuous push for unique vehicle styling and improved user experience. In contrast, Vehicle Dynamics, while still developing, is gaining rapid momentum as manufacturers prioritize performance aspects like steering, braking, and suspension systems. The integration of smart technologies in vehicle dynamics aims to enhance safety, efficiency, and comfort, appealing to a growing market segment that values performance and innovation in their driving experiences.
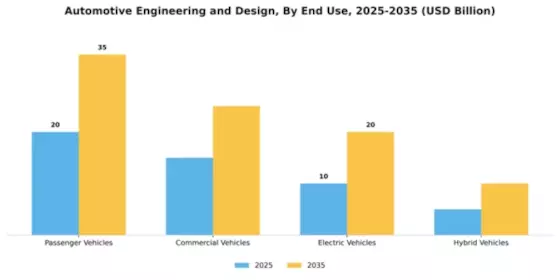
In the automotive engineering and design market, end-use segmentation reveals that passenger vehicles dominate with a significant share, while electric vehicles are rapidly gaining traction as a viable alternative. The growth of passenger vehicles is primarily driven by increasing global consumer demand for personal mobility, especially in emerging markets. Electric vehicles, however, are revolutionizing the industry with their emphasis on sustainability and reduced emissions, making them increasingly popular among environmentally conscious consumers. The shifting consumer preference towards electric vehicles is bolstered by advancements in battery technology, improved charging infrastructure, and government incentives promoting green energy. As a result, electric vehicles are not only expanding their market presence but also contributing to changes in design and engineering approaches within the automotive sector. The commercial vehicles segment, although substantial, is growing at a slower rate as it adapts to the shift toward electrification and technological advancements.
Passenger Vehicles (Dominant) vs. Hybrid Vehicles (Emerging)
Passenger vehicles maintain a dominant position in the automotive engineering and design market, characterized by a wide range of styles, features, and technologies catering to diverse consumer preferences. This segment's strength lies in its ability to adapt to market trends, such as the rise of in-car technology and safety features. On the other hand, hybrid vehicles represent an emerging segment, appealing to consumers looking for a balance between fuel efficiency and the traditional driving experience. Although still in a growth phase compared to passenger vehicles, hybrid vehicles are increasingly seen as a bridge towards fully electric mobility, integrating both gasoline and electric powertrains. The engineering design for hybrids focuses on optimizing energy efficiency and performance, presenting new challenges and opportunities for manufacturers in the evolving automotive landscape.
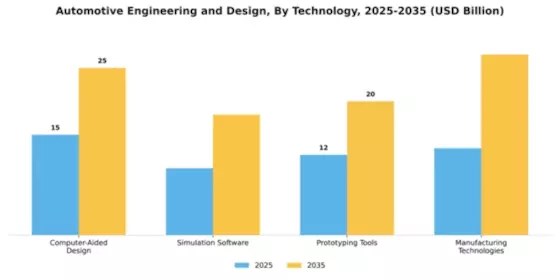
The automotive engineering and design market is currently dominated by simulation software, which holds the largest share due to its essential role in optimizing vehicle performance and safety. This segment is characterized by the incorporation of advanced algorithms and AI, making it indispensable for engineers and designers alike. Following closely, computer-aided design (CAD) tools are vital for conceptualizing and visualizing designs, while prototyping tools are gaining traction for their rapid development capabilities.
Technology: Simulation Software (Dominant) vs. Prototyping Tools (Emerging)
Simulation software leads the automotive engineering sector, providing critical insights into vehicle dynamics and performance, thus significantly enhancing the design process. It allows engineers to make data-driven decisions early, reducing the need for multiple physical prototypes. In contrast, prototyping tools are emerging rapidly as they facilitate faster experimentation and iteration cycles. They enable automotive companies to bring designs to life swiftly, fostering innovation. This segment aligns well with current industry trends emphasizing rapid development and efficiency, positioning prototyping tools as a key driver for future advancements in automotive design.
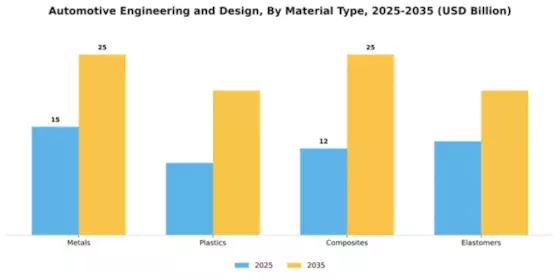
In the automotive engineering and design sector, material type distribution is vital for understanding market dynamics. Metals currently command the largest share due to their unmatched strength, durability, and reliability. They are widely used in structural components, powertrains, and bodywork, bolstering their dominance in this industry. Plastics and elastomers also play significant roles, but metals remain central to vehicle integrity and safety, while composites are rapidly gaining market traction driven by lightweight and performance-oriented design requirements. Growth trends in the material types segment are influenced by technological advancements and changing consumer preferences. Composites are notably emerging as the fastest-growing material due to their lightweight properties, which improve fuel efficiency and reduce emissions. However, the traditional metal components continue to evolve, benefiting from advancements in alloys and manufacturing processes that enhance performance and reduce weight. The balance between strength, manufacturability, and sustainability is driving innovation across all material types in automotive design and engineering.
Metals (Dominant) vs. Composites (Emerging)
Metals have long been the dominant material in automotive engineering and design, praised for their strength, durability, and ability to absorb energy in collisions. They are the backbone of vehicle structures and often serve functional roles in powertrains and chassis designs. Emerging materials like composites play a crucial role in reshaping automotive design by offering weight-saving options without compromising strength. Composites, particularly carbon fiber reinforced plastics, are favored in high-performance and luxury vehicles, promoting efficiency and agility. The combination of metals' reliability and composites' innovative properties heralds a new era of automotive engineering where designers can prioritize safety and performance.
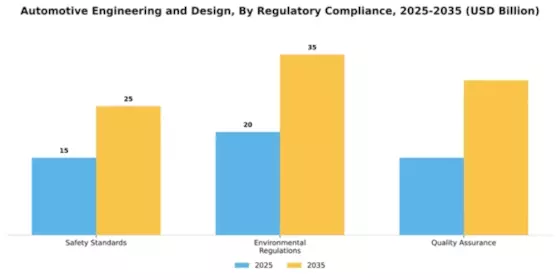
In the automotive engineering and design sector, the regulatory compliance landscape is primarily dominated by safety standards, which hold the largest share in ensuring vehicle reliability and protection for occupants. Safety regulations encompass various criteria such as crashworthiness, restraint systems, and electronic stability control, driving manufacturers to adhere to stringent guidelines to foster consumer trust.
Safety Standards (Dominant) vs. Environmental Regulations (Emerging)
Safety standards in automotive engineering have become a crucial element, profoundly influencing vehicle design and manufacturing processes. These standards guarantee vehicles meet necessary safety performance measures, thus becoming an integral part of automotive engineering. On the other hand, environmental regulations are emerging swiftly, driven by an increasing emphasis on sustainability and emissions reduction. As governments worldwide impose stricter emission standards, automotive design is shifting towards eco-friendly technologies. This creates a balancing act for manufacturers who are pressured to incorporate both safety and environmental compliance into their engineering practices.
Get more detailed insights about Automotive Engineering and Design Market Request Free Sample
North America continues to lead the automotive engineering and design market, holding a significant share of 20.0 in 2024. The region's growth is driven by technological advancements, increasing consumer demand for electric vehicles (EVs), and supportive government regulations promoting sustainability. The push for autonomous driving technologies and enhanced safety features further fuels market expansion, making it a hub for innovation in the automotive sector. The competitive landscape is characterized by major players such as General Motors Company, Ford Motor Company, and Toyota Motor Corporation, all of which are investing heavily in R&D. The U.S. remains a key player, with states like California leading in EV adoption and infrastructure development. The presence of established automotive giants and a robust supply chain solidifies North America's position as a leader in automotive engineering and design.
Europe's automotive engineering and design market, valued at 15.0, is increasingly focused on sustainability and innovation. The region is experiencing a shift towards electric and hybrid vehicles, driven by stringent EU regulations aimed at reducing carbon emissions. This regulatory environment, coupled with consumer demand for greener alternatives, is propelling growth in the automotive sector, making Europe a key player in the global market. Leading countries such as Germany, France, and the UK are at the forefront of this transformation, with companies like Volkswagen AG and Daimler AG leading the charge. The competitive landscape is marked by a strong emphasis on R&D, with significant investments in battery technology and autonomous driving. The European market is poised for growth as it adapts to changing consumer preferences and regulatory requirements, ensuring its relevance in the global automotive arena.
The Asia-Pacific region, with a market size of 12.0, is rapidly emerging as a significant player in automotive engineering and design. The growth is primarily driven by increasing urbanization, rising disposable incomes, and a growing middle class, leading to higher demand for vehicles. Additionally, government initiatives promoting electric vehicles and smart transportation solutions are catalyzing market expansion, making this region a focal point for automotive innovation. Countries like Japan, South Korea, and China are leading the charge, with key players such as Honda Motor Co., Ltd. and Hyundai Motor Company investing heavily in R&D. The competitive landscape is vibrant, with numerous startups and established firms vying for market share. The region's focus on technological advancements, particularly in EVs and autonomous vehicles, positions it as a critical hub for future automotive developments.
The Middle East and Africa, with a market size of 3.0, presents untapped potential in automotive engineering and design. The region is witnessing a gradual increase in vehicle demand, driven by economic diversification efforts and infrastructure development. Government initiatives aimed at enhancing transportation networks and promoting electric vehicles are expected to catalyze growth in the automotive sector, making it an attractive market for investment. Countries like South Africa and the UAE are emerging as key players, with local manufacturers and international companies exploring opportunities in the region. The competitive landscape is evolving, with a mix of established automotive brands and new entrants focusing on innovative solutions. As the region continues to develop its automotive capabilities, it is poised for significant growth in the coming years.
The Automotive Engineering and Design market is characterized by intense competition and rapid technological advancements. Key growth drivers include the increasing demand for electric vehicles (EVs), advancements in autonomous driving technologies, and a heightened focus on sustainability. Major players such as Toyota Motor Corporation (JP), Volkswagen AG (DE), and General Motors Company (US) are strategically positioned to leverage these trends. Toyota (JP) emphasizes innovation in hybrid and hydrogen fuel cell technologies, while Volkswagen (DE) is heavily investing in EV infrastructure and digital transformation. General Motors (US) is focusing on electric and autonomous vehicle development, which collectively shapes a competitive environment that is increasingly defined by technological prowess and sustainability initiatives.Key business tactics in this market include localizing manufacturing to reduce costs and optimize supply chains, which is crucial given the global nature of automotive production. The competitive structure appears moderately fragmented, with several key players exerting significant influence. This fragmentation allows for niche players to emerge, particularly in the EV segment, while larger companies consolidate their market positions through strategic partnerships and acquisitions.In November Volkswagen AG (DE) announced a partnership with a leading battery technology firm to enhance its EV production capabilities. This strategic move is likely to bolster Volkswagen's position in the EV market, enabling it to meet the growing demand for sustainable transportation solutions. The collaboration may also facilitate advancements in battery efficiency, which is critical for the performance and range of electric vehicles.In October General Motors Company (US) unveiled its latest autonomous vehicle prototype, showcasing advanced AI integration for improved safety and navigation. This development underscores GM's commitment to leading the autonomous driving sector, potentially positioning the company as a frontrunner in a market that is rapidly evolving towards self-driving technology. The implications of this innovation could extend beyond consumer vehicles, influencing commercial applications as well.In September Toyota Motor Corporation (JP) launched a new initiative aimed at increasing the production of hydrogen fuel cell vehicles. This initiative reflects Toyota's long-standing commitment to alternative fuel technologies and may serve to differentiate the company in a market increasingly dominated by battery electric vehicles. The strategic focus on hydrogen could provide Toyota with a unique competitive edge, particularly in regions where hydrogen infrastructure is developing.As of December current competitive trends in the Automotive Engineering and Design market are heavily influenced by digitalization, sustainability, and AI integration. Strategic alliances are becoming increasingly vital, as companies seek to pool resources and expertise to navigate the complexities of modern automotive challenges. The competitive landscape is shifting from traditional price-based competition to a focus on innovation, technology, and supply chain reliability. This evolution suggests that companies that prioritize R&D and strategic partnerships will likely emerge as leaders in the future.





The Automotive Engineering and Design market is projected to grow at a 5.49% CAGR from 2025 to 2035, driven by advancements in electric vehicles, automation, and sustainable materials.
New opportunities lie in:
By 2035, the market is expected to be robust, driven by innovation and sustainability.
| MARKET SIZE 2024 | 50.0(USD Billion) |
| MARKET SIZE 2025 | 52.74(USD Billion) |
| MARKET SIZE 2035 | 90.0(USD Billion) |
| COMPOUND ANNUAL GROWTH RATE (CAGR) | 5.49% (2025 - 2035) |
| REPORT COVERAGE | Revenue Forecast, Competitive Landscape, Growth Factors, and Trends |
| BASE YEAR | 2024 |
| Market Forecast Period | 2025 - 2035 |
| Historical Data | 2019 - 2024 |
| Market Forecast Units | USD Billion |
| Key Companies Profiled | Toyota Motor Corporation (JP), Volkswagen AG (DE), General Motors Company (US), Ford Motor Company (US), Daimler AG (DE), Honda Motor Co., Ltd. (JP), BMW AG (DE), Nissan Motor Co., Ltd. (JP), Hyundai Motor Company (KR) |
| Segments Covered | Application, End Use, Technology, Material Type, Regulatory Compliance |
| Key Market Opportunities | Integration of advanced materials for lightweight vehicle design and enhanced fuel efficiency. |
| Key Market Dynamics | Rising emphasis on electric vehicle design drives innovation in automotive engineering and sustainable manufacturing practices. |
| Countries Covered | North America, Europe, APAC, South America, MEA |
The projected market valuation for Automotive Engineering and Design in 2035 is 90.0 USD Billion.
The overall market valuation for Automotive Engineering and Design was 50.0 USD Billion in 2024.
The expected CAGR for the Automotive Engineering and Design market during the forecast period 2025 - 2035 is 5.49%.
Key players in the Automotive Engineering and Design market include Toyota Motor Corporation, Volkswagen AG, General Motors Company, and Ford Motor Company.
The projected value for Automotive Design is expected to reach 18.0 USD Billion by 2035.
The Vehicle Dynamics segment is projected to grow to 22.0 USD Billion by 2035.
The anticipated value of Electric Vehicles in the market is expected to reach 20.0 USD Billion by 2035.
The projected value for Manufacturing Technologies is expected to be 27.0 USD Billion by 2035.
The expected value for Safety Standards is projected to reach 25.0 USD Billion by 2035.
The Composites segment is expected to be valued at 25.0 USD Billion by 2035.


Kindly complete the form below to receive a free sample of this Report

“This is really good guys. Excellent work on a tight deadline. I will continue to use you going forward and recommend you to others. Nice job”


“Thanks. It’s been a pleasure working with you, please use me as reference with any other Intel employees.”


“Thanks for sending the report it gives us a good global view of the Betaïne market.”


“Thank you, this will be very helpful for OQS.”


“We found the report very insightful! we found your research firm very helpful. I'm sending this email to secure our future business.”


“I am very pleased with how market segments have been defined in a relevant way for my purposes (such as "Portable Freezers & refrigerators" and "last-mile"). In general the report is well structured. Thanks very much for your efforts.”


“I have been reading the first document or the study, ,the Global HVAC and FP market report 2021 till 2026. Must say, good info! I have not gone in depth at all parts, but got a good indication of the data inside!”


“We got the report in time, we really thank you for your support in this process. I also thank to all of your team as they did a great job.”


“The Automotive 48V ECU Components Procurement Intelligence Study” was a complex project, but the Market Research Future (MRFR) team handled it with quality, agility, and customer-centricity. They delivered all requested data on time and within the agreed scope. The team, including Shubhendra Anand and Rahul Gotadki, was always readily available to clarify questions and swiftly implement necessary adjustments, driving the project to a successful conclusion within a very demanding timeframe.
I would also like to specifically commend Akshay Agarwal for his responsiveness and support at every stage—from our initial inquiry on May 6th through to final delivery on June 18th. His dedication made the entire process seamless.”



