Download Free Sample
Kindly complete the form below to receive a free sample of this Report
Automotive Insurance Services Market Research Report By Application (Personal Insurance, Commercial Insurance, Fleet Insurance, Specialty Insurance), By Coverage Type (Liability Coverage, Collision Coverage, Comprehensive Coverage, Uninsured Motorist Coverage), By Customer Type (Individual Customers, Small Business Owners, Large Corporations, Government Entities), By Policy Duration (Short-Term Policies, Long-Term Policies, Annual Policies) And By Region (North America, Europe, Asia-Pacific, And Rest Of The World) – Market Forecast Till 2035.
As per MRFR analysis, the Automotive Insurance Services Market was estimated at 325.0 USD Billion in 2024. The automotive insurance industry is projected to grow from 334.75 USD Billion in 2025 to 450.0 USD Billion by 2035, exhibiting a compound annual growth rate (CAGR) of 3.0% during the forecast period 2025 - 2035.
The Automotive Insurance Services Market is experiencing a transformative shift driven by digital advancements and evolving consumer needs.
| 2024 Market Size | 325.0 (USD Billion) |
| 2035 Market Size | 450.0 (USD Billion) |
| CAGR (2025 - 2035) | 3.0% |
State Farm (US), Geico (US), Progressive (US), Allstate (US), Liberty Mutual (US), Farmers Insurance (US), Nationwide (US), American Family Insurance (US), AXA (FR), Zurich Insurance Group (CH)
Our Impact
Enabled $4.3B Revenue Impact for Fortune 500 and Leading Multinationals
Partnering with 2000+ Global Organizations Each Year
30K+ Citations by Top-Tier Firms in the Industry
The Automotive Insurance Services Market is currently experiencing a transformative phase, driven by advancements in technology and evolving consumer expectations. Insurers are increasingly adopting digital platforms to enhance customer engagement and streamline claims processing. This shift towards digitalization not only improves operational efficiency but also caters to a tech-savvy clientele that demands convenience and speed. Moreover, the integration of artificial intelligence and machine learning into underwriting processes is reshaping risk assessment, allowing for more personalized insurance solutions. As a result, companies are likely to gain a competitive edge by leveraging data analytics to better understand customer behavior and preferences. In addition to technological advancements, regulatory changes are influencing the Automotive Insurance Services Market. Governments are implementing stricter guidelines to ensure consumer protection and promote fair practices within the industry. This regulatory landscape compels insurers to adapt their offerings and pricing strategies, potentially leading to increased transparency and trust among consumers. Furthermore, the growing awareness of environmental issues is prompting insurers to consider sustainability in their operations, which may lead to the development of eco-friendly insurance products. Overall, the Automotive Insurance Services Market appears poised for growth as it navigates these multifaceted trends, balancing innovation with regulatory compliance and consumer demands.
The Automotive Insurance Services Market is witnessing a significant shift towards digital platforms. Insurers are increasingly utilizing technology to enhance customer interactions and streamline processes. This trend not only improves efficiency but also meets the expectations of a modern consumer base that values convenience.
Changes in regulations are shaping the Automotive Insurance Services Market. Stricter guidelines are being introduced to protect consumers and ensure fair practices. Insurers must adapt their strategies to comply with these regulations, which may foster greater transparency and trust.
There is a growing emphasis on sustainability within the Automotive Insurance Services Market. Insurers are beginning to consider environmental impacts in their operations. This trend may lead to the introduction of eco-friendly insurance products, appealing to environmentally conscious consumers.
The Automotive Insurance Services Market is significantly influenced by the rising vehicle ownership rates across various regions. As more individuals acquire vehicles, the demand for automotive insurance services is expected to increase correspondingly. Recent statistics indicate that vehicle ownership has surged, with millions of new cars registered annually. This trend is particularly pronounced in emerging markets, where economic growth and urbanization are driving higher vehicle sales. Consequently, insurance providers are likely to see a substantial uptick in policy subscriptions, which could lead to increased revenue streams. Furthermore, the growing diversity of vehicle types, including electric and hybrid models, presents new opportunities for insurers to tailor their offerings. This evolving landscape suggests that the Automotive Insurance Services Market will continue to expand as vehicle ownership becomes more prevalent.
The Automotive Insurance Services Market is experiencing a notable transformation due to rapid technological advancements. Innovations such as telematics, artificial intelligence, and big data analytics are reshaping how insurance providers assess risk and manage claims. For instance, telematics devices allow insurers to monitor driving behavior in real-time, leading to personalized premium pricing. This shift towards data-driven decision-making is expected to enhance customer satisfaction and reduce operational costs. According to recent estimates, the integration of AI in claims processing could potentially reduce processing time by up to 30 percent, thereby streamlining operations within the Automotive Insurance Services Market. As technology continues to evolve, it is likely that insurers will increasingly adopt these tools to remain competitive and meet the changing needs of consumers.
The Automotive Insurance Services Market is subject to evolving regulatory frameworks that can significantly impact operations. Governments are increasingly implementing stricter regulations aimed at enhancing consumer protection and ensuring fair practices within the insurance sector. These regulatory changes often require insurers to adapt their policies and procedures, which can lead to increased operational costs. However, compliance with these regulations can also create opportunities for insurers to differentiate themselves in a competitive market. For instance, companies that proactively embrace regulatory changes may enhance their reputation and build trust with consumers. Furthermore, as regulations evolve, there may be a growing demand for specialized insurance products that cater to new legal requirements. This dynamic environment suggests that the Automotive Insurance Services Market must remain agile and responsive to regulatory shifts to thrive.
The Automotive Insurance Services Market is increasingly influenced by a shift towards sustainable practices and environmental consciousness. As consumers become more aware of the impact of their choices on the environment, there is a growing demand for insurance products that align with sustainability goals. Insurers are responding by developing policies that incentivize eco-friendly driving behaviors, such as discounts for electric vehicle owners or those who participate in car-sharing programs. This trend is not only beneficial for the environment but also presents a unique marketing opportunity for insurers to attract environmentally conscious consumers. Recent data suggests that the market for green insurance products is expanding, indicating a potential growth area within the Automotive Insurance Services Market. As sustainability becomes a priority for both consumers and insurers, this shift could reshape the competitive landscape.
Consumer awareness regarding the importance of automotive insurance is on the rise, which is positively impacting the Automotive Insurance Services Market. Educational initiatives and marketing campaigns by insurers have contributed to a better understanding of policy options and coverage benefits among potential customers. As individuals become more informed about the risks associated with driving without insurance, the likelihood of purchasing coverage increases. Recent surveys indicate that a significant percentage of drivers now recognize the necessity of having comprehensive insurance, which is likely to drive market growth. Additionally, the emergence of online platforms has made it easier for consumers to compare policies and prices, further fueling competition among insurers. This heightened awareness and accessibility suggest that the Automotive Insurance Services Market is poised for continued expansion as more consumers seek adequate coverage.
The Automotive Insurance Services Market showcases a diverse segmentation by application, with Personal Insurance commanding the largest share. This segment caters to individual policyholders, reflecting a stable demand driven by personal vehicle ownership. In contrast, Commercial Insurance, while currently smaller in size, is gaining momentum due to the increasing number of businesses relying on vehicles for operations, along with a growing awareness of comprehensive coverage options. Analyzing growth trends within these segments reveals that Commercial Insurance is rapidly expanding, driven by the rise of e-commerce and delivery services that require fleet operations. Businesses are increasingly opting for tailored insurance products that address unique risks, propelling this segment forward. Additionally, advancements in telematics and digital insurance platforms are making it easier for businesses to obtain customized coverage, further supporting this growth trajectory.
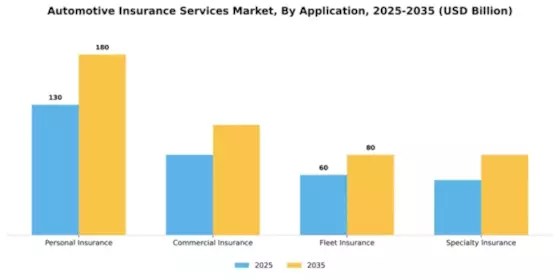
Personal Insurance (Dominant) vs. Fleet Insurance (Emerging)
In the Automotive Insurance Services Market, Personal Insurance stands as the dominant segment, primarily focusing on providing coverage for individual vehicle owners. It is characterized by policies that address various personal risks, ranging from accidents to theft, ensuring comprehensive protection. Meanwhile, Fleet Insurance is considered an emerging segment, catering to businesses with multiple vehicles. As companies seek more efficient ways to manage risk in fleet operations, Fleet Insurance is gaining traction. This segment's growth is propelled by increased vehicle utilization and the necessity for organizations to protect their assets systematically. Both segments reflect different aspects of the automotive landscape, with Personal Insurance retaining strong consumer loyalty while Fleet Insurance capitalizes on evolving business needs.
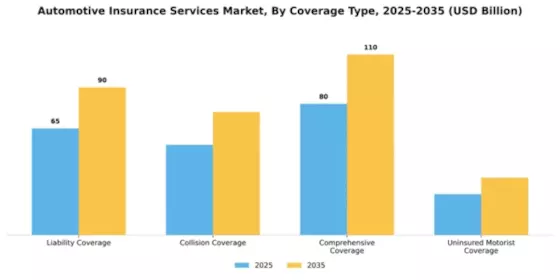
In the Automotive Insurance Services Market, Liability Coverage represents the largest share among the different types of coverage, accounting for a significant portion of the market. It is the foundation of auto insurance policies in most regions, with consumers prioritizing this coverage to meet legal requirements and safeguard against third-party claims. On the other hand, Comprehensive Coverage, although smaller in market share, has been gaining momentum as consumers look for broader protection against various risks, including theft and non-collision incidents. The growth trends for these coverage types are influenced by an increase in consumer awareness regarding the importance of various insurance coverages. The rise in accident rates and the growing number of vehicles on the road are driving demand for Comprehensive Coverage as individuals seek to protect their investments. Additionally, changing regulations and advancements in technology that offer better tracking and risk assessment have bolstered the appeal of Comprehensive policies, making them an attractive option for many new car buyers.
Liability Coverage (Dominant) vs. Uninsured Motorist Coverage (Emerging)
Liability Coverage has long been the dominant force in the Automotive Insurance Services Market, primarily due to its legal necessity in many jurisdictions. This type of coverage protects policyholders against claims from third parties for bodily injury or property damage. It remains the go-to option for consumers as it fulfills mandatory insurance requirements while offering peace of mind. In contrast, Uninsured Motorist Coverage is emerging as a vital segment, responding to the increasing number of drivers on the road without adequate insurance. This coverage steps in to protect individuals from financial loss in situations where uninsured drivers are at fault, thus emphasizing the growing need for comprehensive protection as awareness around insurance gaps heightens among consumers.
In the Automotive Insurance Services Market, Individual Customers form the largest segment, contributing significantly to overall market share due to their diverse insurance needs and a wide range of vehicle ownership. Small Business Owners, as an emerging segment, are experiencing remarkable growth owing to the increasing number of small enterprises and their need for tailored insurance solutions to protect their assets, vehicles, and business operations. Growth trends in this segment are primarily driven by the evolving regulatory landscape, technological advancements, and a rising preference for customized insurance products. Individual Customers prioritize coverage options that suit their lifestyles and preferences, while Small Business Owners seek flexible policies to safeguard their operations against potential risks. These trends indicate a robust and competitive environment, urging insurance providers to innovate and adapt their offerings accordingly.
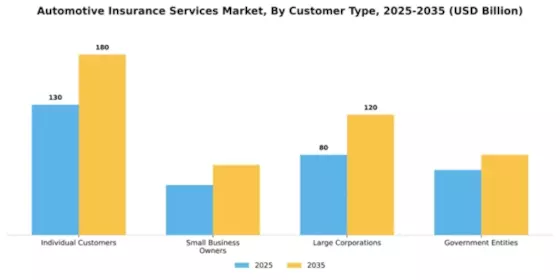
Individual Customers (Dominant) vs. Large Corporations (Emerging)
Individual Customers represent the dominant portion of the Automotive Insurance Services Market, characterized by a vast array of personal insurance preferences and a strong emphasis on customer service. This group typically seeks comprehensive coverage options that accommodate various life stages and vehicle types, including cars and recreational vehicles. Their loyalty is often tied to service quality, pricing, and the speed of claim processing. Conversely, Large Corporations are emerging as increasingly significant players in this market segment. They require specialized insurance products tailored to their fleet operations and risk management needs. This group tends to exhibit a more analytical approach to insurance procurement, often favoring policies that align with their corporate risk strategies and compliance requirements. The engagement from both segments shapes the dynamics within the Automotive Insurance Services Market, compelling service providers to continually refine and optimize their offerings.
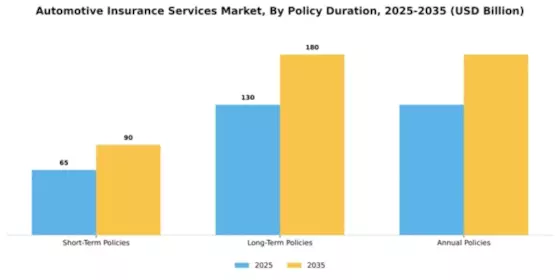
In the Automotive Insurance Services Market, the distribution of market share among policy duration segments reveals that Annual Policies dominate the landscape, accounting for a significant portion of the overall market. These policies appeal to consumers looking for stability and comprehensive coverage, making them the preferred choice for many drivers. On the other hand, Short-Term Policies are becoming increasingly popular, especially among car rentals and temporary drivers, reflecting a shift in consumer preferences towards flexibility and brief commitments.
Annual Policies (Dominant) vs. Short-Term Policies (Emerging)
Annual Policies are characterized by their extensive plan offerings, providing year-long coverage that encapsulates various risks associated with vehicle ownership, making them the dominant choice among drivers seeking consistent protection. These policies tend to include various addons, catering to individual needs such as accident forgiveness and roadside assistance. In contrast, Short-Term Policies are shaping up as an emerging trend, particularly appealing to those who may not need full-year coverage due to infrequent use of vehicles. Such flexibility allows consumers to adapt their insurance needs according to their circumstances, catering specifically to a younger demographic and those experiencing life changes, thus driving the increasing demand.
Get more detailed insights about Automotive Insurance Services Market Request Free Sample
North America continues to lead the automotive insurance services market, holding a significant share of 162.5 million in 2024. Key growth drivers include increasing vehicle ownership, rising awareness of insurance benefits, and regulatory support for consumer protection. The demand for comprehensive coverage options is also on the rise, driven by technological advancements in vehicle safety and telematics. The competitive landscape is characterized by major players such as State Farm, Geico, and Progressive, which dominate the market. These companies leverage innovative technologies and customer-centric services to enhance their offerings. The U.S. remains the largest market, while Canada and Mexico are also witnessing growth, driven by increasing insurance penetration and favorable regulatory frameworks.
Europe's automotive insurance services market is valued at 85.0 million, reflecting a growing demand for tailored insurance solutions. Factors such as stringent regulations on vehicle safety and environmental standards are driving the market. Additionally, the shift towards electric vehicles (EVs) is creating new opportunities for insurers to develop specialized products. Leading countries like Germany, France, and the UK are at the forefront of this growth, with established players such as AXA and Zurich Insurance Group. The competitive landscape is evolving, with new entrants focusing on digital solutions and customer engagement. The European market is expected to continue expanding as insurers adapt to changing consumer preferences and regulatory requirements.
The Asia-Pacific automotive insurance services market, valued at 65.0 million, is experiencing rapid growth due to increasing vehicle ownership and urbanization. Rising disposable incomes and a growing middle class are driving demand for comprehensive insurance products. Additionally, government initiatives promoting road safety and insurance awareness are acting as catalysts for market expansion. Countries like China, India, and Japan are leading the charge, with local and international players competing for market share. Companies are increasingly adopting digital platforms to enhance customer experience and streamline operations. The competitive landscape is dynamic, with a mix of traditional insurers and insurtech startups vying for dominance in this burgeoning market.
The Middle East and Africa automotive insurance services market, valued at 12.5 million, presents significant growth opportunities. Factors such as increasing vehicle registrations and a rising awareness of insurance benefits are driving demand. Additionally, regulatory frameworks are gradually evolving to support consumer protection and enhance market transparency. Countries like South Africa and the UAE are leading the market, with local insurers expanding their offerings to cater to diverse consumer needs. The competitive landscape is characterized by a mix of established players and new entrants focusing on innovative solutions. As the market matures, there is potential for growth in both personal and commercial insurance segments.
The Automotive Insurance Services Market is currently characterized by a dynamic competitive landscape, driven by technological advancements, evolving consumer preferences, and regulatory changes. Major players such as State Farm (US), Geico (US), and Progressive (US) are strategically positioning themselves through digital transformation and customer-centric innovations. These companies are increasingly leveraging data analytics and artificial intelligence to enhance underwriting processes and improve customer engagement, thereby shaping a competitive environment that prioritizes efficiency and responsiveness.The market structure appears moderately fragmented, with a mix of large incumbents and smaller niche players. Key business tactics include localized service offerings and supply chain optimization, which enable companies to tailor their products to specific regional needs. The collective influence of these major players fosters a competitive atmosphere where agility and adaptability are paramount, as they navigate the complexities of consumer demands and regulatory landscapes.In November State Farm (US) announced the launch of a new telematics-based insurance product aimed at young drivers, which utilizes real-time driving data to offer personalized premiums. This strategic move not only enhances customer engagement but also positions State Farm as a leader in the emerging market for usage-based insurance, potentially attracting a demographic that values technology and customization in their insurance products.In October Geico (US) expanded its partnership with a leading telematics provider to enhance its data analytics capabilities. This collaboration is expected to improve risk assessment and pricing accuracy, allowing Geico to offer more competitive rates while maintaining profitability. The integration of advanced analytics into their operational framework signifies a commitment to innovation and responsiveness to market trends, which could strengthen their market share in the long term.In September Progressive (US) unveiled a new AI-driven claims processing system designed to expedite claims resolution and improve customer satisfaction. This initiative reflects a broader trend towards automation in the insurance sector, where efficiency and speed are increasingly critical. By investing in technology that streamlines operations, Progressive is likely to enhance its competitive edge and attract customers seeking hassle-free service.As of December the Automotive Insurance Services Market is witnessing a pronounced shift towards digitalization, sustainability, and AI integration. Strategic alliances among key players are becoming more prevalent, facilitating the sharing of technology and resources to enhance service offerings. Looking ahead, competitive differentiation is expected to evolve from traditional price-based competition to a focus on innovation, technological advancements, and supply chain reliability. This transition underscores the necessity for companies to adapt and innovate continuously in order to maintain relevance in an increasingly competitive landscape.


The Automotive Insurance Services Market is projected to grow at a 3.0% CAGR from 2025 to 2035, driven by technological advancements, regulatory changes, and increasing vehicle ownership.
New opportunities lie in:
By 2035, the market is expected to be robust, reflecting evolving consumer needs and technological innovations.
| MARKET SIZE 2024 | 325.0(USD Billion) |
| MARKET SIZE 2025 | 334.75(USD Billion) |
| MARKET SIZE 2035 | 450.0(USD Billion) |
| COMPOUND ANNUAL GROWTH RATE (CAGR) | 3.0% (2025 - 2035) |
| REPORT COVERAGE | Revenue Forecast, Competitive Landscape, Growth Factors, and Trends |
| BASE YEAR | 2024 |
| Market Forecast Period | 2025 - 2035 |
| Historical Data | 2019 - 2024 |
| Market Forecast Units | USD Billion |
| Key Companies Profiled | State Farm (US), Geico (US), Progressive (US), Allstate (US), Liberty Mutual (US), Farmers Insurance (US), Nationwide (US), American Family Insurance (US), AXA (FR), Zurich Insurance Group (CH) |
| Segments Covered | Application, Coverage Type, Customer Type, Policy Duration |
| Key Market Opportunities | Integration of telematics and artificial intelligence enhances risk assessment in the Automotive Insurance Services Market. |
| Key Market Dynamics | Rising consumer demand for personalized coverage options drives innovation in Automotive Insurance Services. |
| Countries Covered | North America, Europe, APAC, South America, MEA |
The Automotive Insurance Services Market was valued at 325.0 USD Billion in 2024.
The market is projected to reach 450.0 USD Billion by 2035.
The expected CAGR for the market during the forecast period is 3.0%.
The market includes segments such as Personal Insurance, Commercial Insurance, Fleet Insurance, and Specialty Insurance.
Personal Insurance is projected to reach between 130.0 and 180.0 USD Billion by 2035.
Comprehensive Coverage is expected to be valued between 80.0 and 110.0 USD Billion by 2035, indicating strong demand.
Key players include State Farm, Geico, Progressive, Allstate, and Liberty Mutual, among others.
Fleet Insurance is projected to reach between 60.0 and 80.0 USD Billion by 2035.
The market targets Individual Customers, Small Business Owners, Large Corporations, and Government Entities.
Long-Term Policies are expected to be valued between 130.0 and 180.0 USD Billion by 2035.



Kindly complete the form below to receive a free sample of this Report

“This is really good guys. Excellent work on a tight deadline. I will continue to use you going forward and recommend you to others. Nice job”


“Thanks. It’s been a pleasure working with you, please use me as reference with any other Intel employees.”


“Thanks for sending the report it gives us a good global view of the Betaïne market.”


“Thank you, this will be very helpful for OQS.”


“We found the report very insightful! we found your research firm very helpful. I'm sending this email to secure our future business.”


“I am very pleased with how market segments have been defined in a relevant way for my purposes (such as "Portable Freezers & refrigerators" and "last-mile"). In general the report is well structured. Thanks very much for your efforts.”


“I have been reading the first document or the study, ,the Global HVAC and FP market report 2021 till 2026. Must say, good info! I have not gone in depth at all parts, but got a good indication of the data inside!”


“We got the report in time, we really thank you for your support in this process. I also thank to all of your team as they did a great job.”


“The Automotive 48V ECU Components Procurement Intelligence Study” was a complex project, but the Market Research Future (MRFR) team handled it with quality, agility, and customer-centricity. They delivered all requested data on time and within the agreed scope. The team, including Shubhendra Anand and Rahul Gotadki, was always readily available to clarify questions and swiftly implement necessary adjustments, driving the project to a successful conclusion within a very demanding timeframe.
I would also like to specifically commend Akshay Agarwal for his responsiveness and support at every stage—from our initial inquiry on May 6th through to final delivery on June 18th. His dedication made the entire process seamless.”



