Automotive Powertrain Management System Market Share
Automotive Powertrain Management System Market Research Report Information by Component Type (Engine, Transmission, Differentials, Driveshaft), by Vehicle Type (Passenger Cars, Commercial Vehicles), by Drive Type (Front-wheel Drive, Rear-wheel Drive, All-wheel Drive) and By Region (North America, Europe, Asia-Pacific, and Rest of the World) –Market Forecast Till 2035

Market Summary
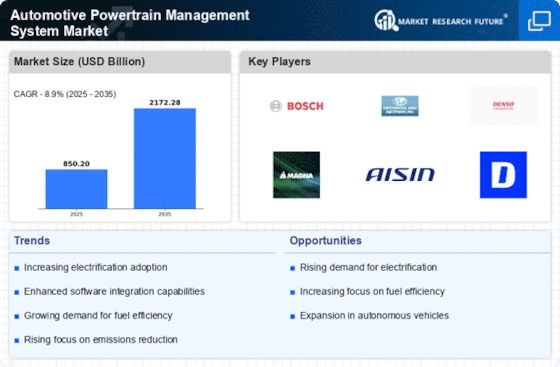
As per Market Research Future Analysis, the Automotive Powertrain Management System Market was valued at 850.20 USD Billion in 2024 and is projected to reach 2172.28 USD Billion by 2035, growing at a CAGR of 8.90% from 2025 to 2035. Key drivers include stringent emission regulations, fuel efficiency demands, electrification trends, and technological advancements. The market is significantly influenced by consumer preferences shifting towards cleaner technologies, particularly electric vehicles (EVs).
Key Market Trends & Highlights
The market is witnessing transformative trends driven by regulatory and consumer demands.
- Market Size in 2024: 850.20 USD Billion Projected Market Size by 2035: 2172.28 USD Billion CAGR from 2025 to 2035: 8.90% North America held 45.80% market share in 2022
Market Size & Forecast
2024 Market Size | USD 850.20 Billion |
2035 Market Size | USD 2172.28 Billion |
CAGR (2025-2035) | 8.90% |
Major Players
<p>Key players include Toyota Motor Corporation, Hyundai Motor Company, JTEKT Corporation, ZF Friedrichshafen AG, Volkswagen AG, Ford Motor Company, General Motors Company, GKN plc, Borgwarner Inc., Aisin Seiki Co. Ltd, Valeo, and Hella KGaA Hueck & Co.</p>
Market Trends
Stringent emission regulations is driving the market growth
The automotive and energy sectors in particular, as well as other businesses, are being changed by strict emission laws. In order to combat climate change and enhance air quality, these rules are primarily focused on lowering greenhouse gas emissions and air pollutants. They have a significant and varied impact on the market, impacting both product development and customer behavior.
Strict emission laws force businesses to make considerable investments in R&D, which is one of the key ways they influence the market. Manufacturers are compelled to innovate and create cleaner technology and more effective products in order to comply with these rules. For example, in the automotive sector, Corporate Average Fuel Economy (CAFE) standards in the United States and the Euro 6 in Europe have compelled automakers to invest in hybrid and electric vehicle technologies as well as more fuel-efficient internal combustion engines.
Governments all over the world are spending more in sustainable energy infrastructure, opening doors for businesses to enter this growing sector. In turn, this makes renewable energy less dependent on government funding and more commercially viable, enhancing its position in the world energy market.
Emission standards have an impact on customer behavior and preferences in addition to product development. More environmentally conscious consumers are looking for goods and services that reflect their ideals. In addition to increasing consumer knowledge of environmental issues, strict emission regulations have also influenced them to choose cleaner and more effective products. As people seek more environmentally friendly substitutes for conventional gasoline-powered cars, the demand for electric vehicles (EVs) has increased, for instance, in the automotive industry.
Automakers have accelerated their EV production efforts to satisfy the increased demand as a result of this shift in consumer preferences, fueling the expansion of the electric vehicle market. Furthermore, strict emission rules have given businesses that can meet or beyond these criteria a competitive edge. Businesses that make proactive investments in environmentally friendly technologies and procedures frequently find themselves in the lead. They can promote themselves as being environmentally sensitive, which not only draws in customers who care about the environment but also helps them gain favor with policymakers and regulatory organizations.
In some circumstances, adherence to strict emission limits might even provide new market opportunities for businesses by allowing them to export their eco-friendly goods to areas with comparable regulatory norms.
It's crucial to recognize, though, that strict emission laws often present difficulties for companies, notably in terms of compliance expenses. In many cases, meeting these standards necessitates large investments in R&D and infrastructural improvements. Smaller businesses may find it difficult to meet these demands, which could result in market consolidation as bigger, more inventive businesses take over.
Additionally, the switch to cleaner technologies can be disruptive, particularly in sectors that heavily rely on fossil fuels. This could result in job losses and regional economic changes. Thus, driving the automotive powertrain management system market revenue.
<p>The ongoing transition towards electrification and stringent emissions regulations are reshaping the automotive powertrain management landscape, driving innovation and efficiency in vehicle performance.</p>
U.S. Department of Energy
Automotive Powertrain Management System Market Market Drivers
Market Growth Projections
The Global Automotive Powertrain Management System Market Industry is projected to experience robust growth over the coming years. With a market value of 850.2 USD Billion in 2024, it is anticipated to reach 2172.2 USD Billion by 2035. This growth trajectory suggests a compound annual growth rate of 8.9% from 2025 to 2035. Factors contributing to this expansion include technological advancements, rising fuel efficiency demands, and increasing adoption of electric and hybrid vehicles. The market dynamics indicate a shift towards more sophisticated powertrain management solutions, reflecting the evolving needs of consumers and regulatory frameworks.
Rising Demand for Fuel Efficiency
The Global Automotive Powertrain Management System Market Industry is significantly influenced by the rising demand for fuel efficiency among consumers and manufacturers alike. As fuel prices fluctuate, consumers are increasingly seeking vehicles that offer better mileage and lower operational costs. This trend is prompting manufacturers to invest in advanced powertrain technologies that enhance fuel efficiency. The market is expected to expand, with projections indicating a growth to 2172.2 USD Billion by 2035. This shift towards fuel-efficient vehicles is further supported by government incentives and regulations aimed at reducing carbon footprints, thereby driving innovation in powertrain management systems.
Growth of Electric and Hybrid Vehicles
The Global Automotive Powertrain Management System Market Industry is witnessing substantial growth due to the increasing adoption of electric and hybrid vehicles. As consumers become more environmentally conscious, the demand for vehicles that utilize alternative powertrains is on the rise. This trend is supported by advancements in battery technology and charging infrastructure, which enhance the viability of electric vehicles. The market is poised for significant expansion, with projections indicating a value of 850.2 USD Billion in 2024. The shift towards electric and hybrid vehicles is likely to drive innovation in powertrain management systems, as manufacturers seek to optimize performance and efficiency.
Technological Advancements in Powertrain Systems
The Global Automotive Powertrain Management System Market Industry is experiencing rapid technological advancements, particularly in electric and hybrid powertrains. Innovations such as advanced battery management systems and regenerative braking technologies are enhancing vehicle efficiency and performance. For instance, the integration of artificial intelligence in powertrain management allows for real-time data analysis, optimizing fuel consumption and emissions. As a result, the market is projected to grow significantly, with estimates suggesting a value of 850.2 USD Billion in 2024. This growth is likely driven by the increasing demand for eco-friendly vehicles and stringent emission regulations worldwide.
Government Regulations and Environmental Standards
The Global Automotive Powertrain Management System Market Industry is heavily shaped by government regulations and environmental standards aimed at reducing greenhouse gas emissions. Many countries are implementing stringent emission norms, compelling manufacturers to adopt advanced powertrain technologies that comply with these regulations. For example, the European Union's stringent CO2 emission targets are pushing automakers to innovate in powertrain management systems. This regulatory landscape is expected to foster market growth, with a projected compound annual growth rate of 8.9% from 2025 to 2035. As manufacturers adapt to these regulations, the demand for sophisticated powertrain management solutions is likely to increase.
Integration of Advanced Driver Assistance Systems (ADAS)
The Global Automotive Powertrain Management System Market Industry is increasingly influenced by the integration of Advanced Driver Assistance Systems (ADAS). These systems enhance vehicle safety and performance, necessitating sophisticated powertrain management solutions that can seamlessly interact with ADAS technologies. For instance, adaptive cruise control and lane-keeping assist require precise powertrain adjustments to optimize vehicle dynamics. As the automotive industry moves towards greater automation and connectivity, the demand for integrated powertrain management systems is expected to rise. This trend is likely to contribute to the overall market growth, aligning with the projected CAGR of 8.9% from 2025 to 2035.
Market Segment Insights
Automotive Powertrain Management System Component Type Insights
<p>The Automotive Powertrain Management System Market segmentation, based on component type includes engine, transmission, differentials, and driveshaft. The transmission segment dominated the market, whether it is faster acceleration, smoother gear changes, or better handling, consumers want more performance from their cars. By ensuring precise gear selection and faster response times, advanced transmission control systems can aid in these performance gains.</p>
Automotive Powertrain Management System Vehicle Type Insights
<p>The Automotive Powertrain Management System Market segmentation, based on vehicle type, includes passenger cars, commercial vehicles. The passenger cars segment dominated the market, Passenger cars represent a substantial portion of the global automotive market due to high consumer demand. People purchase passenger cars for personal use, daily commuting, and family transportation, making this segment a major driver for powertrain management systems.</p>
<p>Figure 1: Automotive Powertrain Management System Market by Vehicle Type, 2022 & 2032 (USD Billion)</p>
<p>Source: Secondary Research, Primary Research, MRFR Database and Analyst Review</p>
Automotive Powertrain Management System Drive Type Insights
<p>The Automotive Powertrain Management System Market segmentation, based on Drive Type, includes Front-wheel Drive, Rear-wheel Drive, All-wheel Drive. The Front-wheel Drive category generated the most income. Compared to RWD or AWD systems, FWD systems are frequently less expensive to construct and maintain. As a result, FWD vehicles are more widely available to consumers, especially in emerging economies where price is a key factor in purchasing decisions.</p>
Get more detailed insights about Automotive Powertrain Management System Market Research Report – Forecast till 2034
Regional Insights
By region, the study provides the market insights into North America, Europe, Asia-Pacific and Rest of the World. The North America Automotive Powertrain Management System Market dominated this market in 2022 (45.80%). a highly developed automobile industry with a priority on sustainability and innovation. It is dominated by the United States and has a broad selection of automobiles and laws, as well as a rising trend toward electric and driverless vehicles. Further, the U.S. Automotive powertrain management system market held the largest market share, and the Canada Armor Materials market was the fastest growing market in the North America region.
Further, the major countries studied in the market report are The U.S., Canada, German, France, the UK, Italy, Spain, China, Japan, India, Australia, South Korea, and Brazil.
Figure 2: Automotive Powertrain Management System Market Share By Region 2022 (USD Billion)
Source: Secondary Research, Primary Research, MRFR Database and Analyst Review
Europe automotive powertrain management system market accounts for the second-largest market share. Renowned for its strict emission restrictions and dedication to lowering carbon emissions. Europe, a centre for the manufacture and adoption of electric vehicles with a focus on urban mobility solutions and green transportation initiatives, is home to major automakers. Further, the German automotive powertrain management system market held the largest market share, and the UK automotive powertrain management system market was the fastest growing market in the European region
The Asia-Pacific Automotive Powertrain Management System Market is expected to grow at the fastest CAGR from 2023 to 2032. The largest automobile market in the world, which has experienced fast growth, particularly in nations like China and India. Asia-Pacific is the world leader in the production of electric vehicles and a significant region in the development of connected and autonomous vehicles. Moreover, China’s automotive powertrain management system market held the largest market share, and the Indian automotive powertrain management system market was the fastest growing market in the Asia-Pacific region.
Key Players and Competitive Insights
Leading market players are investing heavily in research and development in order to expand their product lines, which will help the automotive powertrain management system market, grow even more. Market participants are also undertaking a variety of strategic activities to expand their global footprint, with important market developments including new product launches, contractual agreements, mergers and acquisitions, higher investments, and collaboration with other organizations. To expand and survive in a more competitive and rising market climate, automotive powertrain management system industry must offer cost-effective items.
Manufacturing locally to minimize operational costs is one of the key business tactics used by manufacturers in the global automotive powertrain management system industry to benefit clients and increase the market sector. In recent years, the automotive powertrain management system industry has offered some of the most significant advantages to medicine. Major players in the automotive powertrain management system market, including Toyota Motor Corporation, Hyundai Motor Company, JTEKT Corporation,ZF Friedrichshafen AG, Volkswagen AG, Ford Motor Company, General Motors Company, GKN plc, Borgwarner Inc., Aisin Seiki Co.
Ltd, Valeo,Hella KGaA Hueck & Co.,and other are attempting to increase market demand by investing in research and development operations.
Toyota Industries Corp. primarily manufactures and sells autos, commercial vehicles, and textile machinery in addition to running a logistics company. The business produces and markets autos, engines, foundry products, and electronic devices. Additionally, it offers vehicles for working in high places, automatic warehouses, and forklifts. Additionally, it provided collection and delivery services as well as land transportation services. The group's business is principally carried out through Japan and its worldwide amplification. Toyota makes the majority of its money from the sale of goods and recycled garbage.
Volkswagen is one of the biggest automakers in the world. Automobile brands include Audi, Bentley, Lamborghini, Porsche, SEAT, and Skoda in addition to Volkswagen passenger automobiles. Volkswagen, MAN, Navistar, and Scania are manufacturers of commercial vehicles. The company's financial services division offers consumer financing for car purchases, vehicle leasing, banking, and other financial services in addition to dealer financing to support floor plans. Europe accounted for 41% of Volkswagen's total light vehicle sales in 2022, followed by China (37%), and the rest of the world (22%).
Key Companies in the Automotive Powertrain Management System Market market include


Industry Developments
July 2021: In accordance with a Memorandum of Understanding (MoU), Valeo and Omega Seiki Mobility (OSM) have agreed that OSM's 3-wheeler commercial vehicle lineup in India will receive electric powertrains from Valeo.
July 2021:: "Aurobay," a joint venture between Volvo Cars and Geely Automotive, was established to develop and provide powertrains.
Future Outlook
Automotive Powertrain Management System Market Future Outlook
<p>The Automotive Powertrain Management System Market is projected to grow at an 8.90% CAGR from 2025 to 2035, driven by advancements in electric vehicles, regulatory pressures, and demand for fuel efficiency.</p>
New opportunities lie in:
- <p>Develop AI-driven predictive maintenance solutions to enhance system reliability. Invest in hybrid powertrain technologies to cater to diverse consumer preferences. Expand partnerships with software firms for integrated powertrain management solutions.</p>
<p>By 2035, the market is expected to achieve substantial growth, positioning itself as a cornerstone of automotive innovation.</p>
Market Segmentation
Automotive Powertrain Management System Regional Outlook (USD Billion, 2018-2032)
- {""=>["U.S."
- "Canada"]}
- {""=>["Germany"
- "France"
- "UK"
- "Italy"
- "Spain"
- "Rest of Europe"]}
- {""=>["China"
- "Japan"
- "India"
- "Australia"
- "South Korea"
- "Rest of Asia-Pacific"]}
- {""=>["Middle East"
- "Africa"
- "Latin America"]}
Automotive Powertrain Management System Drive Type Outlook (USD Billion, 2018-2032)
- Front-wheel Drive
- Rear-wheel Drive
- All-wheel Drive
Automotive Powertrain Management System Vehicle Type Outlook (USD Billion, 2018-2032)
- Passenger Cars
- Commercial Vehicles
Automotive Powertrain Management System Component Type Outlook (USD Billion, 2018-2032)
- Engine
- Transmission
- Differentials
- Driveshaft
Report Scope
Report Attribute/Metric | Details |
Market Size 2024 | 850.20 (USD Billion) |
Market Size 2025 | 925.88 (USD Billion) |
Market Size 2035 | 2172.28 (USD Billion) |
Compound Annual Growth Rate (CAGR) | 8.90% (2025 - 2035) |
Report Coverage | Revenue Forecast, Competitive Landscape, Growth Factors, and Trends |
Base Year | 2024 |
Market Forecast Period | 2025 - 2035 |
Historical Data | 2019 - 2023 |
Report Coverage | Revenue Forecast, Market Competitive Landscape, Growth Factors, and Trends |
Segments Covered | Component Type, Vehicle Type, Drive Type, and Region |
Geographies Covered | North America, Europe, Asia Pacific, and the Rest of the World |
Countries Covered | The U.S., Canada, German, France, UK, Italy, Spain, China, Japan, India, Australia, South Korea, and Brazil |
Key Companies Profiled | Toyota Motor Corporation,Hyundai Motor Company,JTEKT Corporation,ZF Friedrichshafen AG,Volkswagen AG,Ford Motor Company,General Motors Company,GKN plc,Borgwarner Inc.,Aisin Seiki Co. Ltd,Valeo,Hella KGaA Hueck & Co. |
Key Market Opportunities | Electric and Hybrid Vehicles |
Key Market Dynamics | Fuel Efficiency |
Market Highlights
Author
Latest Comments
This is a great article! Really helped me understand the topic better.
Thanks for sharing this. I’ve bookmarked it for later reference.
FAQs
1. How much is the automotive powertrain management system market?
The Automotive Powertrain Management System Market size was valued at USD 850.20 Billion in 2024.
2. What is the growth rate of the automotive powertrain management system market?
The global market is projected to grow at a CAGR of 8.90% during the forecast period, 2025-2034.
3. Which region held the largest market share in the automotive powertrain management system market?
North America had the largest share in the global market
4. Who are the key players in the automotive powertrain management system market?
The key players in the market are Toyota Motor Corporation,Hyundai Motor Company,JTEKT Corporation,ZF Friedrichshafen AG,Volkswagen AG,Ford Motor Company,General Motors Company,GKN plc,Borgwarner Inc.,Aisin Seiki Co. Ltd,Valeo,Hella KGaA Hueck & Co.
5. Which Component Type led the automotive powertrain management system market?
The Transmission category dominated the market in 2022.
6. Which Vehicle Type had the largest market share in the automotive powertrain management system market?
The Passenger Cars had the largest share in the global market.
-
Table of Contents
-
Executive Summary
-
Market Introduction
- Definition
-
Scope of the Study
- Research Objective
- Assumptions
- Limitations
-
Research Methodology
- Overview
- Data Mining
- Secondary Research
-
Primary Research
- Primary Interviews and Information Gathering Process
- Breakdown of Primary Respondents
- Forecasting Modality
-
Market Size Estimation
- Bottom-up Approach
- Top-Down Approach
- Data Triangulation
- Validation
-
MARKET DYNAMICS
- Overview
- Drivers
- Restraints
- Opportunities
-
MARKET FACTOR ANALYSIS
- Value Chain Analysis
-
Porter’s Five Forces Analysis
- Bargaining Power of Suppliers
- Bargaining Power of Buyers
- Threat of New Entrants
- Threat of Substitutes
- Intensity of Rivalry
-
COVID-19 Impact Analysis
- Market Impact Analysis
- Regional Impact
- Opportunity and Threat Analysis
-
GLOBAL AUTOMOTIVE POWERTRAIN MANAGEMENT SYSTEM, BY COMPONENT TYPE
- Overview
- Engine
- Transmission
- Differentials
- Driveshaft
-
GLOBAL AUTOMOTIVE POWERTRAIN MANAGEMENT SYSTEM, BY VEHICLE TYPE
- Overview
- Passenger Cars
- Commercial Vehicles
-
GLOBAL AUTOMOTIVE POWERTRAIN MANAGEMENT SYSTEM, BY DRIVE TYPE
- Overview
- Front-wheel Drive
- Rear-wheel Drive
- All-wheel Drive
-
GLOBAL AUTOMOTIVE POWERTRAIN MANAGEMENT SYSTEM, BY REGION
- Overview
-
North America
- U.S.
- Canada
-
Europe
- Germany
- France
- U.K
- Italy
- Spain
- Rest of Europe
-
Asia-Pacific
- China
- India
- Japan
- South Korea
- Australia
- Rest of Asia-Pacific
-
Rest of the World
- Middle East
- Africa
- Latin America
-
Competitive Landscape
- Overview
- Competitive Analysis
- Market Share Analysis
- Major Growth Strategy in the Global Automotive powertrain management system,
- Competitive Benchmarking
- Leading Players in Terms of Number of Developments in the Global Automotive powertrain management system,
-
Key developments and Growth Strategies
- New Component Type Launch/Vehicle Type Deployment
- Merger & Acquisitions
- Joint Ventures
-
Major Players Financial Matrix
- Sales & Operating Income, 2022
- Major Players R&D Expenditure. 2022
-
COMPANY PROFILES
-
Aisin Seiki Co. Ltd
- Company Overview
- Financial Overview
- Products Offered
- Key Developments
- SWOT Analysis
- Key Strategies
-
Borgwarner Inc.
- Company Overview
- Financial Overview
- Products Offered
- Key Developments
- SWOT Analysis
- Key Strategies
-
Ford Motor Company
- Company Overview
- Financial Overview
- Products Offered
- Key Developments
- SWOT Analysis
- Key Strategies
-
General Motors Company
- Company Overview
- Financial Overview
- Products Offered
- Key Developments
- SWOT Analysis
- Key Strategies
-
GKN plc
- Company Overview
- Financial Overview
- Products Offered
- Key Developments
- SWOT Analysis
- Key Strategies
-
Hyundai Motor Company
- Company Overview
- Financial Overview
- Products Offered
- Key Developments
- SWOT Analysis
- Key Strategies
-
JTEKT Corporation
- Company Overview
- Financial Overview
- Products Offered
- Key Developments
- SWOT Analysis
- Key Strategies
-
Toyota Motor Corporation
- Company Overview
- Financial Overview
- Products Offered
- Key Developments
- SWOT Analysis
- Key Strategies
-
Volkswagen AG
- Company Overview
- Financial Overview
- Products Offered
- Key Developments
- SWOT Analysis
- Key Strategies
-
ZF Friedrichshafen AG
- Company Overview
- Financial Overview
- Products Offered
- Key Developments
- SWOT Analysis
- Key Strategies
-
Aisin Seiki Co. Ltd
-
APPENDIX
- References
- Related Reports
-
-
List of Tables and Figures
- LIST OF TABLES
- TABLE 1 GLOBAL AUTOMOTIVE POWERTRAIN MANAGEMENT SYSTEM, SYNOPSIS, 2018-2032
- TABLE 2 GLOBAL AUTOMOTIVE POWERTRAIN MANAGEMENT SYSTEM, ESTIMATES & FORECAST, 2018-2032 (USD BILLION)
- TABLE 3 GLOBAL AUTOMOTIVE POWERTRAIN MANAGEMENT SYSTEM, BY COMPONENT TYPE, 2018-2032 (USD BILLION)
- TABLE 4 GLOBAL AUTOMOTIVE POWERTRAIN MANAGEMENT SYSTEM, BY VEHICLE TYPE, 2018-2032 (USD BILLION)
- TABLE 5 GLOBAL AUTOMOTIVE POWERTRAIN MANAGEMENT SYSTEM, BY DRIVE TYPE, 2018-2032 (USD BILLION)
- TABLE 6 NORTH AMERICA AUTOMOTIVE POWERTRAIN MANAGEMENT SYSTEM, BY COMPONENT TYPE, 2018-2032 (USD BILLION)
- TABLE 7 NORTH AMERICA AUTOMOTIVE POWERTRAIN MANAGEMENT SYSTEM, BY VEHICLE TYPE, 2018-2032 (USD BILLION)
- TABLE 8 NORTH AMERICA AUTOMOTIVE POWERTRAIN MANAGEMENT SYSTEM, BY DRIVE TYPE, 2018-2032 (USD BILLION)
- TABLE 9 NORTH AMERICA AUTOMOTIVE POWERTRAIN MANAGEMENT SYSTEM, BY COUNTRY, 2018-2032 (USD BILLION)
- TABLE 10 U.S. AUTOMOTIVE POWERTRAIN MANAGEMENT SYSTEM, BY COMPONENT TYPE, 2018-2032 (USD BILLION)
- TABLE 11 U.S. AUTOMOTIVE POWERTRAIN MANAGEMENT SYSTEM, BY VEHICLE TYPE, 2018-2032 (USD BILLION)
- TABLE 12 U.S. AUTOMOTIVE POWERTRAIN MANAGEMENT SYSTEM, BY DRIVE TYPE, 2018-2032 (USD BILLION)
- TABLE 13 CANADA AUTOMOTIVE POWERTRAIN MANAGEMENT SYSTEM, BY COMPONENT TYPE, 2018-2032 (USD BILLION)
- TABLE 14 CANADA AUTOMOTIVE POWERTRAIN MANAGEMENT SYSTEM, BY VEHICLE TYPE, 2018-2032 (USD BILLION)
- TABLE 15 CANADA AUTOMOTIVE POWERTRAIN MANAGEMENT SYSTEM, BY DRIVE TYPE, 2018-2032 (USD BILLION)
- TABLE 16 EUROPE AUTOMOTIVE POWERTRAIN MANAGEMENT SYSTEM, BY COMPONENT TYPE, 2018-2032 (USD BILLION)
- TABLE 17 EUROPE AUTOMOTIVE POWERTRAIN MANAGEMENT SYSTEM, BY VEHICLE TYPE, 2018-2032 (USD BILLION)
- TABLE 18 EUROPE AUTOMOTIVE POWERTRAIN MANAGEMENT SYSTEM, BY DRIVE TYPE, 2018-2032 (USD BILLION)
- TABLE 19 EUROPE AUTOMOTIVE POWERTRAIN MANAGEMENT SYSTEM, BY COUNTRY, 2018-2032 (USD BILLION)
- TABLE 20 GERMANY AUTOMOTIVE POWERTRAIN MANAGEMENT SYSTEM, BY COMPONENT TYPE, 2018-2032 (USD BILLION)
- TABLE 21 GERMANY AUTOMOTIVE POWERTRAIN MANAGEMENT SYSTEM, BY VEHICLE TYPE, 2018-2032 (USD BILLION)
- TABLE 22 GERMANY AUTOMOTIVE POWERTRAIN MANAGEMENT SYSTEM, BY DRIVE TYPE, 2018-2032 (USD BILLION)
- TABLE 23 FRANCE AUTOMOTIVE POWERTRAIN MANAGEMENT SYSTEM, BY COMPONENT TYPE, 2018-2032 (USD BILLION)
- TABLE 24 FRANCE AUTOMOTIVE POWERTRAIN MANAGEMENT SYSTEM, BY VEHICLE TYPE, 2018-2032 (USD BILLION)
- TABLE 25 FRANCE AUTOMOTIVE POWERTRAIN MANAGEMENT SYSTEM, BY DRIVE TYPE, 2018-2032 (USD BILLION)
- TABLE 26 ITALY AUTOMOTIVE POWERTRAIN MANAGEMENT SYSTEM, BY COMPONENT TYPE, 2018-2032 (USD BILLION)
- TABLE 27 ITALY AUTOMOTIVE POWERTRAIN MANAGEMENT SYSTEM, BY VEHICLE TYPE, 2018-2032 (USD BILLION)
- TABLE 28 ITALY AUTOMOTIVE POWERTRAIN MANAGEMENT SYSTEM, BY DRIVE TYPE, 2018-2032 (USD BILLION)
- TABLE 29 SPAIN AUTOMOTIVE POWERTRAIN MANAGEMENT SYSTEM, BY COMPONENT TYPE, 2018-2032 (USD BILLION)
- TABLE 30 SPAIN AUTOMOTIVE POWERTRAIN MANAGEMENT SYSTEM, BY VEHICLE TYPE, 2018-2032 (USD BILLION)
- TABLE 31 SPAIN AUTOMOTIVE POWERTRAIN MANAGEMENT SYSTEM, BY DRIVE TYPE, 2018-2032 (USD BILLION)
- TABLE 32 U.K AUTOMOTIVE POWERTRAIN MANAGEMENT SYSTEM, BY COMPONENT TYPE, 2018-2032 (USD BILLION)
- TABLE 33 U.K AUTOMOTIVE POWERTRAIN MANAGEMENT SYSTEM, BY VEHICLE TYPE, 2018-2032 (USD BILLION)
- TABLE 34 U.K AUTOMOTIVE POWERTRAIN MANAGEMENT SYSTEM, BY DRIVE TYPE, 2018-2032 (USD BILLION)
- TABLE 35 REST OF EUROPE AUTOMOTIVE POWERTRAIN MANAGEMENT SYSTEM, BY COMPONENT TYPE, 2018-2032 (USD BILLION)
- TABLE 36 REST OF EUROPE AUTOMOTIVE POWERTRAIN MANAGEMENT SYSTEM, BY VEHICLE TYPE, 2018-2032 (USD BILLION)
- TABLE 37 REST OF EUROPE AUTOMOTIVE POWERTRAIN MANAGEMENT SYSTEM, BY DRIVE TYPE, 2018-2032 (USD BILLION)
- TABLE 38 ASIA PACIFIC AUTOMOTIVE POWERTRAIN MANAGEMENT SYSTEM, BY COMPONENT TYPE, 2018-2032 (USD BILLION)
- TABLE 39 ASIA PACIFIC AUTOMOTIVE POWERTRAIN MANAGEMENT SYSTEM, BY VEHICLE TYPE, 2018-2032 (USD BILLION)
- TABLE 40 ASIA PACIFIC AUTOMOTIVE POWERTRAIN MANAGEMENT SYSTEM, BY DRIVE TYPE, 2018-2032 (USD BILLION)
- TABLE 41 ASIA PACIFIC AUTOMOTIVE POWERTRAIN MANAGEMENT SYSTEM, BY COUNTRY, 2018-2032 (USD BILLION)
- TABLE 42 JAPAN AUTOMOTIVE POWERTRAIN MANAGEMENT SYSTEM, BY COMPONENT TYPE, 2018-2032 (USD BILLION)
- TABLE 43 JAPAN AUTOMOTIVE POWERTRAIN MANAGEMENT SYSTEM, BY VEHICLE TYPE, 2018-2032 (USD BILLION)
- TABLE 44 JAPAN AUTOMOTIVE POWERTRAIN MANAGEMENT SYSTEM, BY DRIVE TYPE, 2018-2032 (USD BILLION)
- TABLE 45 CHINA AUTOMOTIVE POWERTRAIN MANAGEMENT SYSTEM, BY COMPONENT TYPE, 2018-2032 (USD BILLION)
- TABLE 46 CHINA AUTOMOTIVE POWERTRAIN MANAGEMENT SYSTEM, BY VEHICLE TYPE, 2018-2032 (USD BILLION)
- TABLE 47 CHINA AUTOMOTIVE POWERTRAIN MANAGEMENT SYSTEM, BY DRIVE TYPE, 2018-2032 (USD BILLION)
- TABLE 48 INDIA AUTOMOTIVE POWERTRAIN MANAGEMENT SYSTEM, BY COMPONENT TYPE, 2018-2032 (USD BILLION)
- TABLE 49 INDIA AUTOMOTIVE POWERTRAIN MANAGEMENT SYSTEM, BY VEHICLE TYPE, 2018-2032 (USD BILLION)
- TABLE 50 INDIA AUTOMOTIVE POWERTRAIN MANAGEMENT SYSTEM, BY DRIVE TYPE, 2018-2032 (USD BILLION)
- TABLE 51 AUSTRALIA AUTOMOTIVE POWERTRAIN MANAGEMENT SYSTEM, BY COMPONENT TYPE, 2018-2032 (USD BILLION)
- TABLE 52 AUSTRALIA AUTOMOTIVE POWERTRAIN MANAGEMENT SYSTEM, BY VEHICLE TYPE, 2018-2032 (USD BILLION)
- TABLE 53 AUSTRALIA AUTOMOTIVE POWERTRAIN MANAGEMENT SYSTEM, BY DRIVE TYPE, 2018-2032 (USD BILLION)
- TABLE 54 SOUTH KOREA AUTOMOTIVE POWERTRAIN MANAGEMENT SYSTEM, BY COMPONENT TYPE, 2018-2032 (USD BILLION)
- TABLE 55 SOUTH KOREA AUTOMOTIVE POWERTRAIN MANAGEMENT SYSTEM, BY VEHICLE TYPE, 2018-2032 (USD BILLION)
- TABLE 56 SOUTH KOREA AUTOMOTIVE POWERTRAIN MANAGEMENT SYSTEM, BY DRIVE TYPE, 2018-2032 (USD BILLION)
- TABLE 57 REST OF ASIA-PACIFIC AUTOMOTIVE POWERTRAIN MANAGEMENT SYSTEM, BY COMPONENT TYPE, 2018-2032 (USD BILLION)
- TABLE 58 REST OF ASIA-PACIFIC AUTOMOTIVE POWERTRAIN MANAGEMENT SYSTEM, BY VEHICLE TYPE, 2018-2032 (USD BILLION)
- TABLE 59 REST OF ASIA-PACIFIC AUTOMOTIVE POWERTRAIN MANAGEMENT SYSTEM, BY DRIVE TYPE, 2018-2032 (USD BILLION)
- TABLE 60 REST OF WORLD AUTOMOTIVE POWERTRAIN MANAGEMENT SYSTEM, BY COMPONENT TYPE, 2018-2032 (USD BILLION)
- TABLE 61 REST OF WORLD AUTOMOTIVE POWERTRAIN MANAGEMENT SYSTEM, BY VEHICLE TYPE, 2018-2032 (USD BILLION)
- TABLE 62 REST OF WORLD AUTOMOTIVE POWERTRAIN MANAGEMENT SYSTEM, BY DRIVE TYPE, 2018-2032 (USD BILLION)
- TABLE 63 REST OF WORLD AUTOMOTIVE POWERTRAIN MANAGEMENT SYSTEM, BY COUNTRY, 2018-2032 (USD BILLION)
- TABLE 64 MIDDLE EAST AUTOMOTIVE POWERTRAIN MANAGEMENT SYSTEM, BY COMPONENT TYPE, 2018-2032 (USD BILLION)
- TABLE 65 MIDDLE EAST AUTOMOTIVE POWERTRAIN MANAGEMENT SYSTEM, BY VEHICLE TYPE, 2018-2032 (USD BILLION)
- TABLE 66 MIDDLE EAST AUTOMOTIVE POWERTRAIN MANAGEMENT SYSTEM, BY DRIVE TYPE, 2018-2032 (USD BILLION)
- TABLE 67 AFRICA AUTOMOTIVE POWERTRAIN MANAGEMENT SYSTEM, BY COMPONENT TYPE, 2018-2032 (USD BILLION)
- TABLE 68 AFRICA AUTOMOTIVE POWERTRAIN MANAGEMENT SYSTEM, BY VEHICLE TYPE, 2018-2032 (USD BILLION)
- TABLE 69 AFRICA AUTOMOTIVE POWERTRAIN MANAGEMENT SYSTEM, BY DRIVE TYPE, 2018-2032 (USD BILLION)
- TABLE 70 LATIN AMERICA AUTOMOTIVE POWERTRAIN MANAGEMENT SYSTEM, BY COMPONENT TYPE, 2018-2032 (USD BILLION)
- TABLE 71 LATIN AMERICA AUTOMOTIVE POWERTRAIN MANAGEMENT SYSTEM, BY VEHICLE TYPE, 2018-2032 (USD BILLION)
- TABLE 72 LATIN AMERICA AUTOMOTIVE POWERTRAIN MANAGEMENT SYSTEM, BY DRIVE TYPE, 2018-2032 (USD BILLION) LIST OF FIGURES
- FIGURE 1 RESEARCH PROCESS
- FIGURE 2 MARKET STRUCTURE FOR THE GLOBAL AUTOMOTIVE POWERTRAIN MANAGEMENT SYSTEM
- FIGURE 3 MARKET DYNAMICS FOR THE GLOBAL AUTOMOTIVE POWERTRAIN MANAGEMENT SYSTEM
- FIGURE 4 GLOBAL AUTOMOTIVE POWERTRAIN MANAGEMENT SYSTEM, SHARE (%), BY COMPONENT TYPE, 2022
- FIGURE 5 GLOBAL AUTOMOTIVE POWERTRAIN MANAGEMENT SYSTEM, SHARE (%), BY VEHICLE TYPE, 2022
- FIGURE 6 GLOBAL AUTOMOTIVE POWERTRAIN MANAGEMENT SYSTEM, SHARE (%), BY DRIVE TYPE, 2022
- FIGURE 7 GLOBAL AUTOMOTIVE POWERTRAIN MANAGEMENT SYSTEM, SHARE (%), BY REGION, 2022
- FIGURE 8 NORTH AMERICA: AUTOMOTIVE POWERTRAIN MANAGEMENT SYSTEM, SHARE (%), BY REGION, 2022
- FIGURE 9 EUROPE: AUTOMOTIVE POWERTRAIN MANAGEMENT SYSTEM, SHARE (%), BY REGION, 2022
- FIGURE 10 ASIA-PACIFIC: AUTOMOTIVE POWERTRAIN MANAGEMENT SYSTEM, SHARE (%), BY REGION, 2022
- FIGURE 11 REST OF THE WORLD: AUTOMOTIVE POWERTRAIN MANAGEMENT SYSTEM, SHARE (%), BY REGION, 2022
- FIGURE 12 GLOBAL AUTOMOTIVE POWERTRAIN MANAGEMENT SYSTEM: COMPANY SHARE ANALYSIS, 2022 (%)
- FIGURE 13 AISIN SEIKI CO. LTD : FINANCIAL OVERVIEW SNAPSHOT
- FIGURE 14 AISIN SEIKI CO. LTD : SWOT ANALYSIS
- FIGURE 15 BORGWARNER INC. : FINANCIAL OVERVIEW SNAPSHOT
- FIGURE 16 BORGWARNER INC. : SWOT ANALYSIS
- FIGURE 17 FORD MOTOR COMPANY : FINANCIAL OVERVIEW SNAPSHOT
- FIGURE 18 FORD MOTOR COMPANY : SWOT ANALYSIS
- FIGURE 19 GENERAL MOTORS COMPANY : FINANCIAL OVERVIEW SNAPSHOT
- FIGURE 20 GENERAL MOTORS COMPANY : SWOT ANALYSIS
- FIGURE 21 GKN PLC : FINANCIAL OVERVIEW SNAPSHOT
- FIGURE 22 GKN PLC : SWOT ANALYSIS
- FIGURE 23 HYUNDAI MOTOR COMPANY : FINANCIAL OVERVIEW SNAPSHOT
- FIGURE 24 HYUNDAI MOTOR COMPANY : SWOT ANALYSIS
- FIGURE 25 JTEKT CORPORATION : FINANCIAL OVERVIEW SNAPSHOT
- FIGURE 26 JTEKT CORPORATION : SWOT ANALYSIS
- FIGURE 27 TOYOTA MOTOR CORPORATION : FINANCIAL OVERVIEW SNAPSHOT
- FIGURE 28 TOYOTA MOTOR CORPORATION : SWOT ANALYSIS
- FIGURE 29 VOLKSWAGEN AG : FINANCIAL OVERVIEW SNAPSHOT
- FIGURE 30 VOLKSWAGEN AG : SWOT ANALYSIS
- FIGURE 31 ZF FRIEDRICHSHAFEN AG : FINANCIAL OVERVIEW SNAPSHOT
- FIGURE 32 ZF FRIEDRICHSHAFEN AG : SWOT ANALYSIS
Automotive Powertrain Management System Market Segmentation
Automotive Powertrain Management System Component Type Outlook (USD Billion, 2018-2032)
Engine
Transmission
Differentials
Driveshaft
Automotive Powertrain Management System Vehicle Type Outlook (USD Billion, 2018-2032)
Passenger Cars
Commercial Vehicles
Automotive Powertrain Management System Drive Type Outlook (USD Billion, 2018-2032)
Front-wheel Drive
Rear-wheel Drive
All-wheel Drive
Automotive Powertrain Management System Regional Outlook (USD Billion, 2018-2032)
North America Outlook (USD Billion, 2018-2032)
Engine
Transmission
Differentials
Driveshaft
Automotive Powertrain Management System by Vehicle TypePassenger Cars
Commercial Vehicles
Automotive Powertrain Management System by Drive TypeFront-wheel Drive
Rear-wheel Drive
All-wheel Drive
US Outlook (USD Billion, 2018-2032)
Engine
Transmission
Differentials
Driveshaft
Automotive Powertrain Management System by Vehicle TypePassenger Cars
Commercial Vehicles
Automotive Powertrain Management System by Drive TypeFront-wheel Drive
Rear-wheel Drive
All-wheel Drive
Canada Outlook (USD Billion, 2018-2032)
Engine
Transmission
Differentials
Driveshaft
Automotive Powertrain Management System by Vehicle TypePassenger Cars
Commercial Vehicles
Automotive Powertrain Management System by Drive TypeFront-wheel Drive
Rear-wheel Drive
All-wheel Drive
Europe Outlook (USD Billion, 2018-2032)
Engine
Transmission
Differentials
Driveshaft
Automotive Powertrain Management System by Vehicle TypePassenger Cars
Commercial Vehicles
Automotive Powertrain Management System by Drive TypeFront-wheel Drive
Rear-wheel Drive
All-wheel Drive
Germany Outlook (USD Billion, 2018-2032)
Automotive Powertrain Management System by Component TypeEngine
Transmission
Differentials
Driveshaft
Automotive Powertrain Management System by Vehicle TypePassenger Cars
Commercial Vehicles
Automotive Powertrain Management System by Drive TypeFront-wheel Drive
Rear-wheel Drive
All-wheel Drive
France Outlook (USD Billion, 2018-2032)
Engine
Transmission
Differentials
Driveshaft
Automotive Powertrain Management System by Vehicle TypePassenger Cars
Commercial Vehicles
Automotive Powertrain Management System by Drive TypeFront-wheel Drive
Rear-wheel Drive
All-wheel Drive
UK Outlook (USD Billion, 2018-2032)
Engine
Transmission
Differentials
Driveshaft
Automotive Powertrain Management System by Vehicle TypePassenger Cars
Commercial Vehicles
Automotive Powertrain Management System by Drive TypeFront-wheel Drive
Rear-wheel Drive
All-wheel Drive
Italy Outlook (USD Billion, 2018-2032)
Engine
Transmission
Differentials
Driveshaft
Automotive Powertrain Management System by Vehicle TypePassenger Cars
Commercial Vehicles
Automotive Powertrain Management System by Drive TypeFront-wheel Drive
Rear-wheel Drive
All-wheel Drive
Spain Outlook (USD Billion, 2018-2032)
Engine
Transmission
Differentials
Driveshaft
Automotive Powertrain Management System by Vehicle TypePassenger Cars
Commercial Vehicles
Automotive Powertrain Management System by Drive TypeFront-wheel Drive
Rear-wheel Drive
All-wheel Drive
Rest Of Europe Outlook (USD Billion, 2018-2032)
Engine
Transmission
Differentials
Driveshaft
Automotive Powertrain Management System by Vehicle TypePassenger Cars
Commercial Vehicles
Automotive Powertrain Management System by Drive TypeFront-wheel Drive
Rear-wheel Drive
All-wheel Drive
Asia-Pacific Outlook (USD Billion, 2018-2032)
Engine
Transmission
Differentials
Driveshaft
Automotive Powertrain Management System by Vehicle TypePassenger Cars
Commercial Vehicles
Automotive Powertrain Management System by Drive TypeFront-wheel Drive
Rear-wheel Drive
All-wheel Drive
China Outlook (USD Billion, 2018-2032)
Engine
Transmission
Differentials
Driveshaft
Automotive Powertrain Management System by Vehicle TypePassenger Cars
Commercial Vehicles
Automotive Powertrain Management System by Drive TypeFront-wheel Drive
Rear-wheel Drive
All-wheel Drive
Japan Outlook (USD Billion, 2018-2032)
Engine
Transmission
Differentials
Driveshaft
Automotive Powertrain Management System by Vehicle TypePassenger Cars
Commercial Vehicles
Automotive Powertrain Management System by Drive TypeFront-wheel Drive
Rear-wheel Drive
All-wheel Drive
India Outlook (USD Billion, 2018-2032)
Engine
Transmission
Differentials
Driveshaft
Automotive Powertrain Management System by Vehicle TypePassenger Cars
Commercial Vehicles
Automotive Powertrain Management System by Drive TypeFront-wheel Drive
Rear-wheel Drive
All-wheel Drive
Australia Outlook (USD Billion, 2018-2032)
Engine
Transmission
Differentials
Driveshaft
Automotive Powertrain Management System by Vehicle TypePassenger Cars
Commercial Vehicles
Automotive Powertrain Management System by Drive TypeFront-wheel Drive
Rear-wheel Drive
All-wheel Drive
Rest of Asia-Pacific Outlook (USD Billion, 2018-2032)
Engine
Transmission
Differentials
Driveshaft
Automotive Powertrain Management System by Vehicle TypePassenger Cars
Commercial Vehicles
Automotive Powertrain Management System by Drive TypeFront-wheel Drive
Rear-wheel Drive
All-wheel Drive
Rest of the World Outlook (USD Billion, 2018-2032)
Engine
Transmission
Differentials
Driveshaft
Automotive Powertrain Management System by Vehicle TypePassenger Cars
Commercial Vehicles
Automotive Powertrain Management System by Drive TypeFront-wheel Drive
Rear-wheel Drive
All-wheel Drive
Middle East Outlook (USD Billion, 2018-2032)
Engine
Transmission
Differentials
Driveshaft
Automotive Powertrain Management System by Vehicle TypePassenger Cars
Commercial Vehicles
Automotive Powertrain Management System by Drive TypeFront-wheel Drive
Rear-wheel Drive
All-wheel Drive
Africa Outlook (USD Billion, 2018-2032)
Engine
Transmission
Differentials
Driveshaft
Automotive Powertrain Management System by Vehicle TypePassenger Cars
Commercial Vehicles
Automotive Powertrain Management System by Drive TypeFront-wheel Drive
Rear-wheel Drive
All-wheel Drive
Latin America Outlook (USD Billion, 2018-2032)
Engine
Transmission
Differentials
Driveshaft
Automotive Powertrain Management System by Vehicle TypePassenger Cars
Commercial Vehicles
Automotive Powertrain Management System by Drive TypeFront-wheel Drive
Rear-wheel Drive
All-wheel Drive

Free Sample Request
Kindly complete the form below to receive a free sample of this Report
Customer Strories
“I am very pleased with how market segments have been defined in a relevant way for my purposes (such as "Portable Freezers & refrigerators" and "last-mile"). In general the report is well structured. Thanks very much for your efforts.”
Leave a Comment