Automotive Transmission Market (2025 - 2035)

Automotive Transmission Market Research Report By Transmission Type (Automatic, Manual, CVT (Continuously Variable Transmission), DCT (Dual Clutch Transmission), AMT (Automated Manual Transmission), IMT (Intelligent Manual Transmission)), By Vehicle Type (Passenger Cars, Light Commercial Vehicles (LCVs), Heavy Commercial Vehicles (HCVs)), By Propulsion Technology (Internal Combustion Engine (ICE), Hybrid (HEV/PHEV), Battery Electric Vehicle (BEV)), By Sales Channel (OEM, Aftermarket) and By Regional (North America, Europe, South America, Asia Pacific, Middle East and Africa) - Forecast to 2035
ID: MRFR/AT/1794-HCR
100 Pages
Shubham Munde, Sejal Akre
Last Updated: August 24, 2026
Automotive Transmission Market
Market Size
Forecast Period2025-2035
CAGR (2025-2035)4.72%
2025 Market SizeUSD 167.1 Billion
2035 Market SizeUSD 265.0 Billion
Key Players
ZF Friedrichshafen AG
Aisin Corporation
JATCO Ltd.
Allison Transmission
BorgWarner Inc.
Schaeffler AG
Opportunities
  • Multi-Speed Transmissions for Electric and Hybrid Vehicles
  • Aftermarket Transmission Services in Aging Vehicle Fleets
  • Emerging-Market Motorization

Automotive Transmission Market Summary

The Automotive Transmission Market stood at an estimated USD 167.1 Billion in 2025 and is projected to reach USD 175.0 Billion in 2026 before climbing to USD 265.0 Billion by 2035, expanding at a compound annual growth rate of 4.72% during 2026–2035. Two catalysts anchor this trajectory: tightening global emissions regulations — including the European Union's Euro 7 standard and China's Stage 6b mandates — and a wave of OEM investment exceeding USD 45 Billion annually in powertrain electrification and hybridization [1][2].

Transmission architectures are in the middle of a generational pivot. Legacy 4- and 5-speed torque-converter units are giving way to higher-ratio gearboxes, while planetary gear-based automatics and stepped-ratio systems face growing competition from belt-and-pulley and twin-clutch platforms. Multiple automakers announced combined R&D commitments above USD 12 Billion between 2023 and 2025 specifically aimed at next-generation transmission platforms designed to improve fuel economy by 8–15% over predecessor units [3][4].

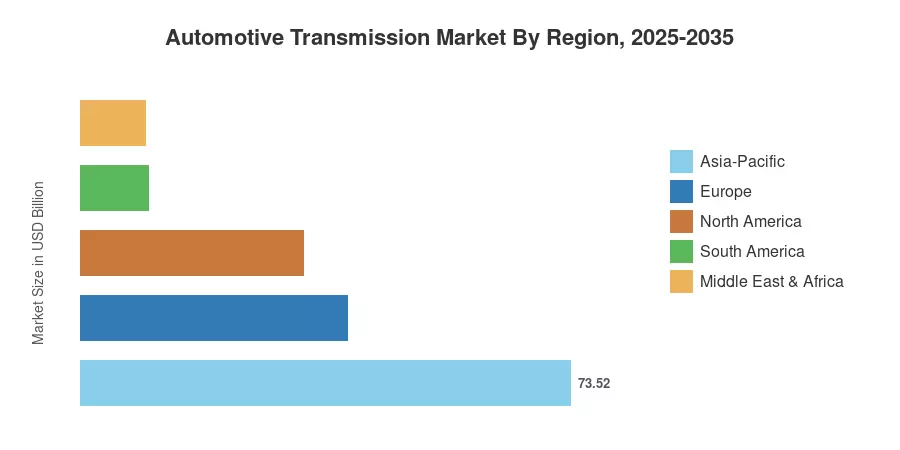
Asia-Pacific commands roughly 44% of the Automotive Transmission Market, underpinned by production volumes in China, Japan, and India. South America is the fastest-growing region with a CAGR above 6.1%, driven by rising vehicle penetration in Brazil and Argentina. Europe holds the second-largest share at approximately 24%, propelled by strict CO₂ fleet targets and the rapid proliferation of mild-hybrid drivetrains [5]. The decade ahead will hinge on how quickly electric-drive architectures reshape transmission demand across propulsion types.


Key Report Takeaways

• By Transmission Type

  • Automatic transmissions account for an estimated 38% share of the Automotive Transmission Market in 2025, supported by consumer preference for shift-free driving in passenger vehicles.
  • Manual transmissions retain a meaningful presence in price-sensitive markets, contributing roughly USD 41.8 Billion in 2025 revenue.
  • The continuously variable transmission segment is expanding at the fastest pace within this dimension, posting a CAGR of 5.9% through 2035.

• By Vehicle Type

  • Passenger cars generate the largest share of the Automotive Transmission Market, representing approximately 62% of total value.
  • Light commercial vehicles are growing at a CAGR of 5.3%, reflecting last-mile delivery fleet expansion globally.

• By Region

  • Asia-Pacific remains the dominant region, contributing roughly USD 73.5 Billion in 2025.
  • South America records the highest regional CAGR in the Automotive Transmission Market at 6.1% through 2035.
  • North America holds a 20% share, anchored by pickup-truck and SUV demand in the United States.


Market Size and Forecast (2021–2035)

Market Research Future's proprietary sizing model triangulates production volume data from OICA, OEM annual reports, Tier-1 supplier disclosures, and national trade databases. Historical figures (2021–2024) reflect actual shipments; 2025 is the calibrated base year; 2026–2035 values are forecast using a bottom-up assembly of segment-level growth assumptions validated against macroeconomic and regulatory scenarios [6].
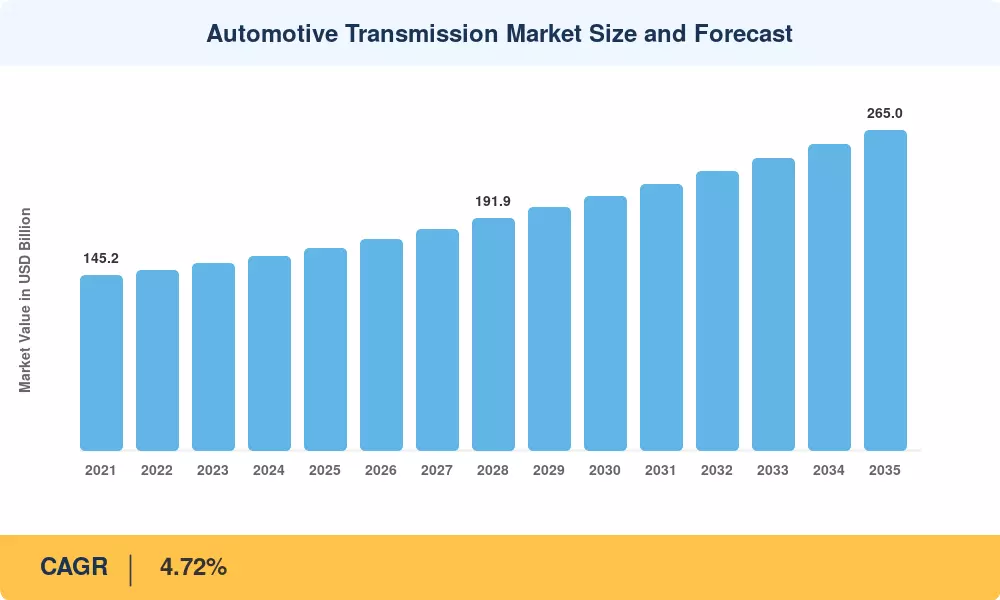
Automotive Transmission Market Size and Forecast
Our Impact
Enabled $4.3B Revenue Impact for Fortune 500 and Leading Multinationals
Partnering with 2000+ Global Organizations Each Year
30K+ Citations by Top-Tier Firms in the Industry

Driver Impact Analysis

Driver ~% Impact on CAGR Geographic Relevance Impact Timeline
Tightening global emissions standards +1.1% Global Short-term (≤2 yr)
Rising consumer preference for automatic driving comfort +0.9% North America, Asia-Pacific Medium-term (2–4 yr)
Growth of hybrid and mild-hybrid powertrains +0.8% Europe, Asia-Pacific Medium-term (2–4 yr)
Expanding LCV and SUV production volumes +0.6% North America, South America Short-term (≤2 yr)
OEM investment in multi-speed EV transmissions +0.5% Europe, North America Long-term (≥4 yr)
Vehicle electrification in emerging economies +0.4% South America, MEA Long-term (≥4 yr)
Aftermarket replacement cycle acceleration +0.3% Global Medium-term (2–4 yr)


Tightening Global Emissions Standards

The most potent driver of the automotive transmission market is still stricter tailpipe standards. Real-driving-emission restrictions imposed by the EU's Euro 7 framework, which goes into effect for new type approvals in the middle of 2025, force manufacturers to use higher-ratio gearboxes that can maintain engines in their most efficient operating ranges. In a similar vein, China's National 6b standard rewards transmissions with larger gear-span ratios but penalizes high-rpm operation. Industry analysts predict that between 2025 and 2028, OEMs will need to spend an additional USD 6.2 billion on transmission modifications due to compliance pressure [1][2].


Rising Consumer Preference for Automatic Comfort

Previously limited to developed countries like North America and Western Europe, sales data from India, Brazil, and Southeast Asia shows that automatic-equipped passenger cars are gaining 3–5 percentage points of mix share annually [12]. Data shows that automatic take-rates in India alone increased from 22% in 2021 to an expected 35% in 2025. In cities where stop-and-go traffic prioritizes pedal-free driving, this behavioral shift is particularly pronounced [12].


Growth of Hybrid and Mild-Hybrid Powertrains

Hybrid architectures require dedicated transmission calibrations — often pairing an electric motor with a multi-speed gearbox rather than a single-speed reducer — which adds per-vehicle transmission content value. According to the estimate, hybrid vehicle sales will exceed 18 million units globally in 2026, each requiring a transmission module valued 15–25% higher than a conventional ICE equivalent [2][13].

Expanding LCV and SUV Production

Global light-commercial-vehicle registrations surpassed 22 million units in 2024, with pickup trucks and delivery vans accounting for a growing share of transmission demand. These vehicles typically use heavy-duty 6- or 8-speed units with higher ASPs compared to compact-car transmissions, amplifying their dollar-weighted contribution to the Automotive Transmission Market [9].


Restraints Impact Analysis

The restraint impacts below are directional estimates reflecting headwinds that partially offset growth drivers. They are not directly subtracted from the headline CAGR [11].

Restraint ~% Impact on CAGR Geographic Relevance Impact Timeline
Battery-electric vehicle adoption displacing geared transmissions –0.7% Europe, China Long-term (≥4 yr)
Raw material cost inflation (rare-earth magnets, specialty steels) –0.4% Global Short-term (≤2 yr)
OEM vertical integration reducing Tier-1 demand –0.3% Asia-Pacific Medium-term (2–4 yr)
Tariff and trade-policy uncertainty –0.2% North America, Europe Short-term (≤2 yr)
Longer vehicle replacement cycles –0.2% Mature markets Medium-term (2–4 yr)


Battery-Electric Vehicle Adoption

Every sale of a BEV that replaces an ICE or hybrid eliminates one multi-speed unit from the addressable market since pure battery-electric vehicles often use single-speed reduction gears rather than conventional multi-speed gearboxes. According to IEA data, BEV adoption is expected to reach 35% of new car sales worldwide by 2030, which might reduce the traditional geared-transmission market base by an estimated USD 18 billion over that time [16].


Raw Material Cost Inflation

Specialty alloy steels and, increasingly, rare-earth permanent magnets are used in gear sets, synchronizers, and transmission housings of hybrid transmission motors. Between 2022 and 2024, neodymium and silicon steel prices increased by 20–30%, which reduced Tier-1 supplier margins and, in certain situations, forced OEMs to postpone model-year upgrades. Geopolitical supply concentration in China maintains high cost volatility even when prices have stabilized [17].


OEM Vertical Integration

Several high-volume manufacturers — including select Chinese and South Korean OEMs — have begun designing and producing transmission units in-house, bypassing traditional Tier-1 suppliers. This trend reduces the externally purchased transmission market and pressures independent suppliers to compete on technology differentiation rather than volume [18].


Automotive Transmission Market Opportunities

Multi-Speed Transmissions for Electric and Hybrid Vehicles

As BEVs push toward higher-performance segments, the limitation of single-speed reducers in balancing top speed and acceleration becomes evident. Companies developing 2-speed and 3-speed units for 800V electric architectures can tap a nascent segment projected to grow at double-digit rates through 2035. Several European Tier-1 suppliers have already demonstrated prototype multi-speed e-drive units with efficiency gains of 5–8% over single-speed counterparts [13].

Aftermarket Transmission Services in Aging Vehicle Fleets

The average age of vehicles on the road in the United States reached 12.6 years in 2024, according to Mobility, and the EU fleet is similarly aging. Older vehicles disproportionately need transmission rebuilds, fluid changes, and component replacements — creating a recurring revenue stream that is largely insulated from the BEV transition for at least another decade[15].

Emerging-Market Motorization

Vehicle ownership in Sub-Saharan Africa remains below 50 per 1,000 people, and South America sits near 200. As per-capita income rises in these regions, first-time car buyers overwhelmingly enter the market through affordable ICE vehicles that require conventional transmissions. Brazil's Rota 2030 automotive policy offers tax incentives for locally produced powertrain components, directly benefiting transmission manufacturers with regional capacity[14].

Software-Defined Transmission Calibration

OEMs are increasingly treating the transmission control unit as a software platform capable of over-the-air updates that refine shift maps, torque management, and predictive gear selection using real-time navigation data. Monetizing these calibration updates through subscription models represents a new revenue layer for both OEMs and Tier-1 suppliers [21].

Lightweight Transmission Architectures

Regulatory pressure to reduce vehicle curb weight is opening an opportunity for aluminum- and magnesium-intensive transmission housings. Weight savings of 15–20% per unit translate directly into improved fuel economy credits under both EU and US CAFE frameworks, making lightweight designs a competitive differentiator[22].


Automotive Transmission Market Future Outlook

Transmission Intelligence and Software-Defined Shift Logic

Artificial intelligence is reshaping how transmission control units operate. Predictive shift algorithms that incorporate real-time traffic, topography, and driver-behavior data are moving from premium-only features to mass-market applications. By 2030, an estimated 40% of new transmissions will ship with AI-assisted calibration capabilities, according to its automotive-software forecast [21].

The Hybrid Transmission Supercycle

While pure BEV narratives dominate headlines, hybrids will likely outsell BEVs globally through at least 2032, sustaining demand for complex multi-speed transmissions that pair electric motors with combustion engines. IEA's Global EV Outlook projects that plug-in hybrids and full hybrids combined will represent 22–28% of global new-car sales in 2030, each requiring dedicated gearbox architectures [2][16].

Platform Consolidation and Modular Architectures

OEMs are converging on modular vehicle platforms that standardize transmission mounting points, cooling interfaces, and electronic connections. This consolidation is reducing transmission variant counts per platform from 6–8 to 2–3, which compresses unit pricing but expands volume per variant. Tier-1 suppliers who can deliver high-volume, modular-compatible units stand to capture a disproportionate share of the Automotive Transmission Market through 2035 [18].

ESG and Circular-Economy Mandates

The EU's proposed End-of-Life Vehicles Regulation revision will require that 25% of materials in new vehicles come from recycled content by 2030, directly affecting transmission-housing metallurgy. Remanufactured transmissions — already a USD 8 Billion global segment — are expected to gain further traction as OEMs integrate take-back programs into their sustainability reporting frameworks [22][24].


Automotive Transmission Market Segmentation

By Transmission Type

Segment Key Metric Primary Demand Driver
Automatic ~38% share (2025) Consumer comfort preference
Manual USD 41.8 Billion (2025) Price-sensitive markets
CVT CAGR 5.9% Fuel-economy optimization
DCT ~12% share (2025) Performance vehicles; European OEMs
AMT CAGR 5.4% Cost-effective automation
IMT USD 5.2 Billion (2025) Entry-level Indian and Asian segments


Automatic transmissions continue to lead the Automotive Transmission Market by value, driven by near-universal adoption in North America and growing penetration in Asia-Pacific. The segment's dominance reflects consumer willingness to pay a premium for shift-free convenience, particularly in urban driving environments. Torque-converter 6- and 8-speed units remain the workhorse architecture, although planetary-gear designs face incremental pressure from twin-clutch alternatives in sportier applications [12].

CVT systems represent the fastest-growing transmission type, propelled by Japanese OEMs who have refined belt-and-chain designs to deliver seamless acceleration with measurably lower fuel consumption. Honda, Toyota, and Nissan (via JATCO) collectively account for the bulk of CVT production, and expansion into Southeast Asian and Indian compact-car segments is widening the addressable market [3].

By Vehicle Type

Segment Key Metric Primary Demand Driver
Passenger Cars ~62% share (2025) Largest production volume globally
Light Commercial Vehicles CAGR 5.3% Last-mile delivery expansion
Heavy Commercial Vehicles USD 18.4 Billion (2025) Freight and infrastructure investment


Passenger cars anchor the Automotive Transmission Market, with global production consistently exceeding 60 million units annually. Transmission content per passenger car ranges from USD 800 for basic manual units to USD 2,500 for advanced multi-speed automatics, creating a wide value spectrum within this segment [9].

By Propulsion Technology

Segment Key Metric Primary Demand Driver
Internal Combustion Engine (ICE) ~68% share (2025) Legacy fleet dominance
Hybrid (HEV/PHEV) CAGR 7.2% Emissions regulation compliance
Battery Electric Vehicle (BEV) USD 8.9 Billion (2025) Single-speed and emerging multi-speed units


ICE vehicles still generate the majority of transmission revenue, though their share is declining at roughly 1.5 percentage points per year. The hybrid segment is the Automotive Transmission Market's fastest-growing propulsion category, as automakers pair dedicated hybrid transmissions with 48V mild-hybrid and full-hybrid systems to meet regulatory targets without fully abandoning combustion architectures [2][16].

By Sales Channel

Segment Key Metric Primary Demand Driver
OEM ~82% share (2025) New-vehicle production
Aftermarket CAGR 5.1% Aging fleet maintenance demand


OEM sales dominate the Automotive Transmission Market, reflecting the fact that transmissions are integral components specified during vehicle design. The aftermarket channel is growing steadily as fleet ages increase globally, with rebuilt and remanufactured transmissions gaining share within this channel due to cost advantages of 40–60% over new units [15].


Regional Market Share Analysis

Region Key Metric Primary Investment Themes
Asia-Pacific ~44% share (2025) High-volume production; hybrid powertrain ramp
Europe ~24% share (2025) Euro 7 compliance; mild-hybrid integration
North America ~20% share (2025) SUV/pickup mix; CAFE standards
South America 6.1% CAGR (2026–2035) Vehicle penetration growth; Rota 2030
Middle East & Africa USD 9.8 Billion (2025) Fleet motorization; import-dependent
Total USD 167.1 Billion (2025)

The Automotive Transmission Market exhibits clear regional stratification driven by production concentration, regulatory rigor, and consumer purchasing power.


North America

Country Key Metric Key Driver
United States ~72% of regional share Pickup/SUV transmission demand
Canada CAGR 4.3% Cross-border OEM supply integration
Mexico USD 4.9 Billion (2025) Export-oriented assembly plants


The United States accounts for the vast majority of North American transmission demand, with full-size pickup trucks and SUVs consuming 6-, 8-, and 10-speed units at substantially higher ASPs than compact-car equivalents. Mexico's transmission output is closely linked to US-destined assembly lines; more than 60% of Mexican-produced gearboxes cross the border under USMCA preferential tariffs [19].

Europe

Country Key Metric Key Driver
Germany ~28% of regional share Premium OEM headquarters; R&D hub
United Kingdom CAGR 4.1% Electrified powertrain investment
France USD 4.2 Billion (2025) PSA/Renault production volumes
Italy ~9% of regional share Sports-car and LCV mix
Spain CAGR 4.5% Growing EV assembly capacity
Nordic Countries USD 2.1 Billion (2025) Rapid BEV adoption
Russia ~5% of regional share Import substitution policies
Rest of Europe CAGR 3.8% Mixed maturity levels


Germany's role as the continent's transmission engineering center is reinforced by ZF, Schaeffler, and Continental all having advanced R&D operations headquartered there. The EU's 2030 CO₂ reduction target of 55% below 2021 levels is compelling every major European automaker to electrify significant portions of their line-ups, driving hybrid-specific transmission demand upward [2].

Asia-Pacific

Country Key Metric Key Driver
China ~46% of regional share World's largest vehicle market
India CAGR 6.4% Rising automatic take-rates
Japan USD 12.8 Billion (2025) Transmission technology origination
South Korea ~8% of regional share Hyundai-Kia vertical integration
ASEAN CAGR 5.5% Emerging middle-class vehicle demand
Rest of Asia-Pacific USD 3.2 Billion (2025) Mixed growth trajectories


China's dominance in the Automotive Transmission Market rests on annual passenger-vehicle production exceeding 25 million units, with rapid adoption of hybrid powertrains adding per-unit transmission content. India's growth story is propelled by the shift from manual to automatic across the mass-market segment, particularly in vehicles priced under USD 15,000 [12].

South America

Country Key Metric Key Driver
Brazil ~58% of regional share Rota 2030 tax incentives
Argentina CAGR 6.8% Vehicle export recovery
Rest of South America USD 1.6 Billion (2025) Early-stage motorization


Brazil's Rota 2030 program provides fiscal incentives tied to energy-efficiency improvements, encouraging automakers to adopt advanced transmission architectures in locally produced vehicles. The Automotive Transmission Market in South America benefits from a young and expanding vehicle parc where replacement demand is still secondary to new-vehicle growth [14].

Middle East & Africa

Country Key Metric Key Driver
Saudi Arabia ~24% of regional share Vision 2030 industrial localization
UAE CAGR 4.8% Premium vehicle imports
South Africa USD 2.1 Billion (2025) Regional assembly hub
Egypt CAGR 5.2% Population-driven demand
Rest of MEA ~28% of regional share Fragmented import markets


Saudi Arabia's Vision 2030 program includes automotive localization targets that could eventually support domestic transmission assembly. Across the broader MEA region, the Automotive Transmission Market remains import-dependent, with most gearbox supply sourced from Asia-Pacific and European production bases [23].


Automotive Transmission Market By Region, 2025-2035

Competitive Benchmarking

The Automotive Transmission Market exhibits medium concentration, with the top five suppliers holding an estimated 48–55% combined revenue share. The Herfindahl-Hirschman Index sits in the moderately concentrated range (approximately 1,100–1,400), reflecting a mix of global Tier-1 incumbents and regionally strong players. Competition centers on technology breadth, OEM platform wins, and manufacturing scale [25].

Company Est. Revenue Share Range Key Offerings Strategic Positioning
ZF Friedrichshafen AG ~12–15% 8-speed automatic, hybrid transmissions, e-drive units Full-spectrum powertrain integrator
Aisin Corporation ~10–13% Automatic, CVT, hybrid transaxles Toyota-group anchor; Asia-Pacific scale
JATCO Ltd. ~7–10% CVT, step-AT for compact vehicles CVT technology leader; Nissan-Renault partnership
Allison Transmission ~4–6% Fully automatic for commercial vehicles Commercial-vehicle niche dominance
BorgWarner Inc. ~4–6% DCT modules, e-drive systems Electrification-forward portfolio pivot
Schaeffler AG ~3–5% DCT clutch systems, hybrid modules Component-level specialist
Magna International ~3–5% AWD/4WD transfer cases, DCT Diversified automotive supplier
Continental AG ~2–4% Transmission control electronics, hybrid modules Software and electronics focus
Eaton Corporation ~2–4% Manual and automated transmissions for trucks Heavy-duty commercial specialist
Hyundai Transys ~3–5% Automatic, DCT, e-drive units Captive Hyundai-Kia supply; expanding external sales


Recent News & Developments


  • Aisin Corporation (June 2024): Unveiled a next-generation hybrid transaxle at the Automotive Engineering Exposition in Yokohama, claiming a 12% efficiency improvement over the outgoing eAxle design. Production is slated for Q2 2026 [3].


  • Allison Transmission (November 2023): Secured a multi-year contract with a major North American commercial-fleet operator to supply its eGen Flex hybrid propulsion system for 5,000 medium-duty delivery trucks [9].


  • JATCO (August 2023): Began mass production of its JF024E next-generation CVT at the Fuji plant, designed for sub-1.5L engines in emerging-market compact cars. The unit reduces friction losses by 18% compared to the predecessor [3].


Automotive Transmission Market Report Scope

Parameter Detail
Market Scope Global Automotive Transmission Market — hardware, software, and services across all propulsion types
Study Period 2021–2035
Historical Period 2021–2024
Base Year 2025
Forecast Period 2026–2035
CAGR (2026–2035) 4.72%
Market Size (2025) USD 167.1 Billion
Market Size (2035) USD 265.0 Billion
Fastest Growing Segment CVT (by type); Hybrid (by propulsion)
Companies Profiled 10 major players including ZF, Aisin, JATCO, Allison, BorgWarner, Schaeffler, Magna, Continental, Eaton, Hyundai Transys
Valuation Currency USD Billion

FAQs

How do 8-speed and 10-speed automatics compare on total cost of ownership for fleet buyers?
Ten-speed units deliver 2–4% better highway fuel economy but carry 10–15% higher upfront procurement costs. For fleets exceeding 25,000 annual miles per vehicle, the fuel savings typically offset the premium within 3 years [11].
Which transmission architecture best suits mild-hybrid 48V integration?
Dedicated hybrid transmissions with integrated P2 motor placement offer the strongest efficiency gains. Standard torque-converter automatics can be retrofitted, but purpose-built units achieve 8–12% greater regenerative-braking energy capture [2].
What warranty risks should procurement teams evaluate when sourcing remanufactured transmissions?
Remanufactured units from certified suppliers typically carry 12–24 month warranties comparable to OEM parts. Buyers should verify that the remanufacturer holds IATF 16949 certification and uses OEM-spec torque converters and valve bodies [15].
How are tariff changes under USMCA affecting cross-border transmission sourcing in North America?
USMCA's 75% regional value content rule has pushed OEMs to localize more transmission componentry within North America. Suppliers with plants in Mexico benefit most from duty-free access to US assembly lines [19].
What role does transmission fluid technology play in extending gearbox service life?
Modern low-viscosity synthetic fluids reduce internal friction by up to 20%, extending drain intervals to 100,000+ miles. Specifying the correct fluid grade is critical — mismatched fluids are a leading cause of premature valve-body wear [15].
How will single-speed EV reducers affect the competitive positioning of traditional Tier-1 transmission suppliers?
Single-speed units carry 60–70% less content value than multi-speed gearboxes, compressing per-vehicle revenue for Tier-1 suppliers. Companies investing in multi-speed EV transmissions and integrated e-drive modules are better positioned to offset this decline [13].
What testing standards should OEMs require when qualifying a new transmission supplier?
OEMs typically mandate IATF 16949 quality certification, SAE J2360 fluid compatibility testing, and minimum 150,000-cycle durability validation. Emerging standards for NVH benchmarking under electric-motor torque profiles are also gaining adoption [11].    
Author
Author
Author Profile
Shubham Munde LinkedIn
Team Lead - Research
Shubham brings over 7 years of expertise in Market Intelligence and Strategic Consulting, with a strong focus on the Automotive, Aerospace, and Defense sectors. Backed by a solid foundation in semiconductors, electronics, and software, he has successfully delivered high-impact syndicated and custom research on a global scale. His core strengths include market sizing, forecasting, competitive intelligence, consumer insights, and supply chain mapping. Widely recognized for developing scalable growth strategies, Shubham empowers clients to navigate complex markets and achieve a lasting competitive edge. Trusted by start-ups and Fortune 500 companies alike, he consistently converts challenges into strategic opportunities that drive sustainable growth.
Co-Author
Co-Author Profile
Sejal Akre LinkedIn
Senior Research Analyst
She has over 5 years of rich experience, in market research and consulting providing valuable market insights to client. Hands on expertise in management consulting, and extensive knowledge in domain including ICT, Automotive & Transportation and Aerospace & Defense. She is skilled in Go-to market strategy, industry analysis, market sizing, in depth company profiling, competitive intelligence & benchmarking and value chain amongst others.

Research Approach


Secondary Research

The secondary research process involved comprehensive analysis of regulatory databases, industry association publications, technical standards documentation, and authoritative transportation authorities. Key sources included the US Environmental Protection Agency (EPA), National Highway Traffic Safety Administration (NHTSA), European Automobile Manufacturers' Association (ACEA), Japan Automobile Manufacturers Association (JAMA), China Association of Automobile Manufacturers (CAAM), International Energy Agency (IEA) Global EV Outlook, US Department of Energy (DOE) Vehicle Technologies Office, International Council on Clean Transportation (ICCT), Society of Automotive Engineers (SAE) International, International Organization of Motor Vehicle Manufacturers (OICA), EU European Environment Agency (EEA) Transport Database, California Air Resources Board (CARB), and national automotive ministry reports from key markets. These sources were employed to gather data on vehicle production statistics, emission regulation compliance, fuel economy standards, transmission technology adoption trends, and powertrain landscape analysis for automatic transmissions, dual-clutch systems, continuously variable transmissions, manual gearboxes, and electrified driveline technologies.


Primary Research

Qualitative and quantitative insights were obtained by interviewing supply-side and demand-side stakeholders during the primary research process. The supply-side sources comprised CEOs, CTOs, VPs of Powertrain Engineering, transmission R&D leaders, and plant directors from tier-1 transmission manufacturers, automotive OEMs, and drivetrain component suppliers. Category managers from automotive dealerships and aftermarket distributors, fleet managers from commercial vehicle operators, chief engineers from EV firms, and procurement directors from passenger car manufacturers comprised demand-side sources. Transmission type segmentation was validated, electrification roadmap timelines were affirmed, and insights were gathered on the adoption of lightweight materials, shifting preferences between automatic and manual systems, and EV transmission simplification strategies through primary research.

Primary Respondent Breakdown:

By Designation: C-level Primaries (30%), Director Level (35%), Others (35%)

By Region: North America (32%), Europe (33%), Asia-Pacific (28%), Rest of World (7%)


Market Size Estimation

Production volume mapping and aftermarket analysis were employed to determine global market valuation. The methodology comprised the following:

Identification of over 45 key transmission manufacturers and Tier-1 suppliers in North America, Europe, Asia-Pacific, and Latin America

Product mapping for automatic transmissions (AT), dual-clutch transmissions (DCT), continuously variable transmissions (CVT), automated manual transmissions (AMT), and conventional manual transmissions (MT) Segment-specific analysis of petroleum, diesel, and electric powertrains in passenger vehicles, light commercial vehicles, and heavy commercial vehicles

Examination of annual revenues that are specific to transmission system portfolios and electrification components, as reported and modeled

Manufacturers that account for 75-80% of the global market share in 2024 are included in the coverage.

Derive powertrain-specific valuations, such as dedicated EV reduction gear units and hybrid multi-speed systems, through extrapolation using bottom-up (vehicle production volume × transmission ASP by country/segment) and top-down (manufacturer revenue validation) approaches.

Download Free Sample

Kindly complete the form below to receive a free sample of this Report

* Please use a valid business email

Download PDF ×

We do not share your information with anyone. However, we may send you emails based on your report interest from time to time. You may contact us at any time to opt-out.
















