Autonomous Navigation Market (2026 - 2035)

Autonomous Navigation Market Size, Share, Industry Trend & Analysis Research Report Information By Platform (Automotive, Aerial Drones, Marine and Offshore, Defence and Space, Industrial and Logistics Robots), By Component (Hardware, Software), By Sensor Type (LiDAR, Radar, Camera, GNSS + INS, Other Sensors), By Geography (North America, Europe, Asia-Pacific, South America, Middle East & Africa) - Forecast till 2035
ID: MRFR/AD/6181-HCR
133 Pages
Abbas Raut, Swapnil Palwe
Last Updated: July 02, 2026
Autonomous Navigation Market
Market Size
Forecast Period2026-2035
CAGR (2026-2035)13.8%
2025 Market SizeUSD 14.38 Billion
2035 Market SizeUSD 52.44 Billion
Key Players
Waymo
Mobileye
NVIDIA
Hexagon AB
Trimble
Honeywell
Opportunities
  • Autonomous Maritime and Inland Waterway Navigation
  • Drone Delivery and Urban Air Mobility
  • Emerging-Market Leapfrogging in Autonomous Transit

Autonomous Navigation Market Summary

The Autonomous Navigation Market reached USD 14.38 billion in 2025 and is projected to grow from USD 16.37 billion in 2026 to USD 52.44 billion by 2035, registering a CAGR of 13.8% during the forecast period. Two catalysts anchor this trajectory: regulatory clearances for Level-3 conditional autonomy across the EU and select U.S. states, and a USD 4.2 billion wave of venture and defense capital channeled into navigation stack companies during 2024 alone [1]. These policy-and-capital tailwinds have pulled forward commercial timelines that once stretched into the next decade.

Legacy GPS-only positioning is giving way to multi-sensor fusion architectures that blend solid-state LiDAR, imaging radar, and inertial measurement units into unified stacks. Solid-state LiDAR unit costs dropped below USD 500 in 2024, a threshold that triggered OEM commitments for series production across passenger cars, commercial trucks, and warehouse robots [2]. That hardware deflation, paired with edge-AI inference chips capable of real-time simultaneous localization and mapping, has compressed the total cost of ownership for autonomous navigation platforms by roughly 30% compared with 2021 designs [3].

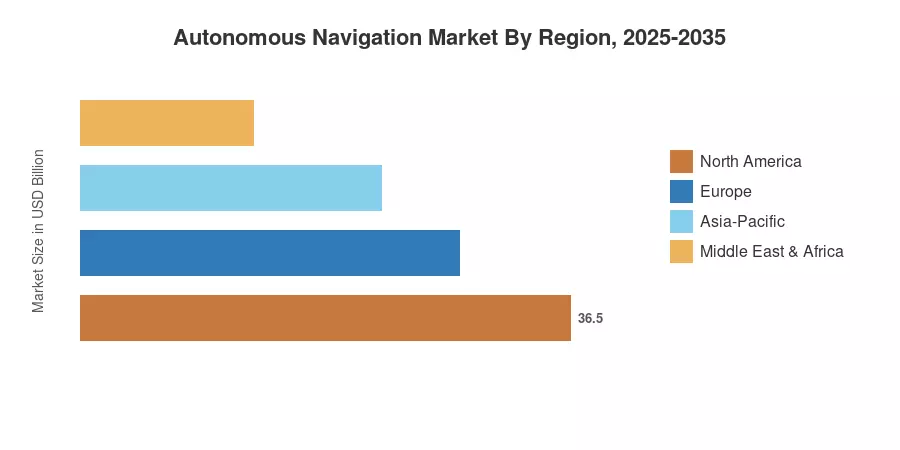
North America commands the largest share of the Autonomous Navigation Market at approximately 41.5%, driven by federal highway automation pilots and defense procurement cycles. The Middle East & Africa region is advancing at the fastest clip, with a projected 16.1% CAGR through 2035, fueled by smart-city mega-projects in Saudi Arabia and the UAE. Europe holds the second-largest position, supported by harmonized UNECE regulations that standardize autonomous driving approvals across member states. As sensor economics continue to improve and regulatory frameworks mature, the Autonomous Navigation Market is positioned for sustained double-digit expansion through the next decade.


Key Report Takeaways

• By Platform

  • Automotive accounted for 49.4% of the Autonomous Navigation Market in 2024, underpinned by OEM investments in highway-pilot and valet-parking features.
  • Industrial and logistics robots are expanding at the fastest platform CAGR of 16.3%, driven by warehouse automation demand across e-commerce fulfillment centers.

• By Component

  • Hardware held a dominant 58.1% share of the Autonomous Navigation Market in 2024, reflecting the capital intensity of sensor suites and compute modules.
  • Software is growing at a 15.5% CAGR as OEMs shift toward subscription-based feature activation and over-the-air update models.

• By Region

  • North America led the Autonomous Navigation Market with a 41.5% revenue share in 2024, anchored by U.S. defense and commercial programs.
  • The Middle East & Africa is the fastest-growing region at 16.1% CAGR, propelled by NEOM and Abu Dhabi autonomous transit initiatives.


Autonomous Navigation Market Size and Forecast (2021–2035)

Market Research Future employs a bottom-up revenue aggregation methodology, cross-referencing OEM shipment data, government procurement filings, and supply-chain invoicing with top-down macro indicators including GDP growth, R&D intensity ratios, and defense budget allocations. Historical figures (2021–2024) are validated against audited annual reports; forecast figures (2026–2035) incorporate scenario-weighted probability distributions.
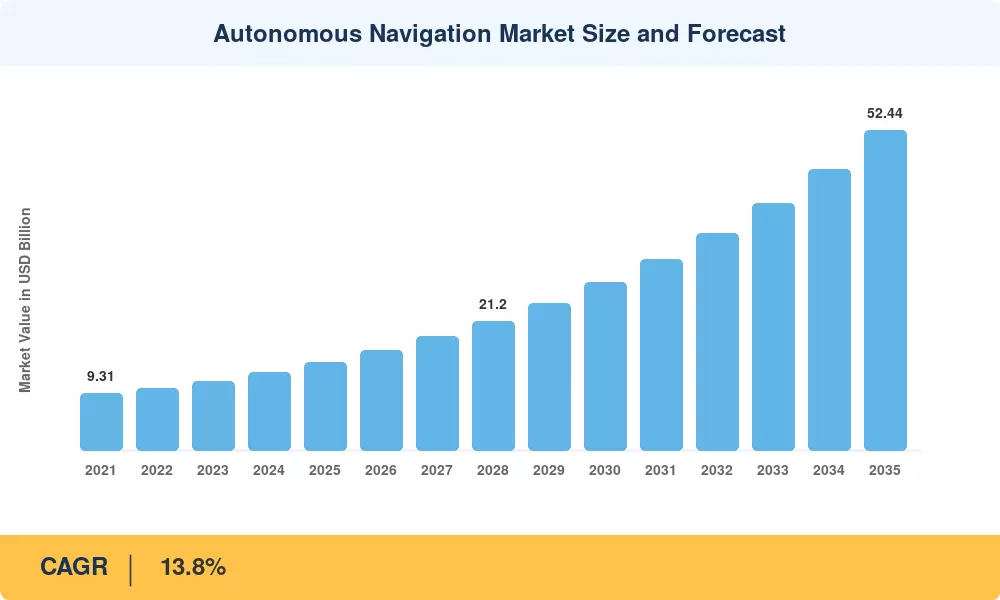
Autonomous Navigation Market Size and Forecast
Our Impact
Enabled $4.3B Revenue Impact for Fortune 500 and Leading Multinationals
Partnering with 2000+ Global Organizations Each Year
30K+ Citations by Top-Tier Firms in the Industry

Driver Impact Analysis

Driver ~% Impact on CAGR Geographic Relevance Impact Timeline
Level-3/4 regulatory clearances ~22% North America, Europe Short-term (≤2 yr)
Solid-state LiDAR cost compression ~18% Global Short-term (≤2 yr)
Defense & sovereign navigation programs ~16% North America, Middle East Medium-term (2–4 yr)
Edge-AI inference chip advancements ~14% Asia-Pacific, North America Medium-term (2–4 yr)
Warehouse & logistics automation ~12% Global Short-term (≤2 yr)
Maritime autonomous vessel mandates ~10% Europe, Asia-Pacific Long-term (≥4 yr)
Smart-city infrastructure investments ~8% Middle East, Asia-Pacific Long-term (≥4 yr)


Regulatory Clearances for Conditional and High Automation

The EU's General Safety Regulation (GSR) update, effective July 2024, mandated advanced driver-assistance system baselines for all new type-approved vehicles, effectively requiring navigation-grade sensor arrays across the European fleet [5]. In the United States, NHTSA's 2024 framework for Automated Driving System evaluation created a standardized pathway for Level-3 highway-pilot approvals, unlocking an estimated USD 1.8 billion in OEM development commitments through 2027 [6]. These regulations create a compliance-driven floor for the Autonomous Navigation Market that persists regardless of consumer adoption pace.

Solid-State LiDAR Cost Deflation

Solid-state LiDAR modules crossed below the USD 500 per-unit threshold in late 2024, a decline of roughly 62% from 2021 pricing [2]. This cost trajectory mirrors the learning-curve dynamics seen in CMOS image sensors a decade earlier. At current volumes, tier-one suppliers project sub-USD 300 pricing by 2028, a level that makes multi-LiDAR architectures economically viable for mid-market passenger vehicles and not just premium segments [3].

Defense and Sovereign Navigation Programs

The U.S. Department of Defense allocated approximately USD 2.1 billion toward assured position, navigation, and timing (PNT) programs in its FY2025 budget, targeting resilience against GPS-denied operational environments [1]. NATO allies collectively earmarked an additional EUR 1.4 billion for autonomous ground and aerial systems through 2028 [15]. These defense expenditures provide a stable demand baseline for the Autonomous Navigation Market while accelerating technology transfer to commercial applications.

Edge-AI and Compute Acceleration

NVIDIA's Orin and successor Thor platforms have compressed autonomous navigation inference latency to below 10 milliseconds for full-stack perception-to-planning pipelines [3]. Qualcomm's Snapdragon Ride Flex entered volume production in 2024, offering a single SoC for both ADAS and infotainment workloads. The combined effect raises real-time processing capacity while reducing power draw per TOPS by approximately 40%, making high-compute navigation viable for thermally constrained platforms such as drones and marine vessels [16].


Restraints Impact Analysis

Restraint ~% Impact on CAGR Geographic Relevance Impact Timeline
Fragmented international regulatory standards ~–25% Global Long-term (≥4 yr)
Cybersecurity and spoofing vulnerability ~–22% North America, Europe Medium-term (2–4 yr)
High sensor-suite integration costs for SMEs ~–20% South America, Africa Short-term (≤2 yr)
Liability and insurance framework gaps ~–18% Global Long-term (≥4 yr)
Skilled workforce shortages in autonomy engineering ~–15% Asia-Pacific, Middle East Medium-term (2–4 yr)


Fragmented Regulatory Landscape

Despite progress in the EU and the United States, autonomous navigation approvals remain jurisdiction-specific across most of Asia, South America, and Africa. China's Ministry of Industry and Information Technology has issued provisional guidelines for limited urban zones, but nationwide homologation standards remain absent [5]. This patchwork slows OEM scale-up because each regulatory jurisdiction demands separate validation campaigns costing USD 15–30 million per market entry [18].

Cybersecurity and Signal-Spoofing Risks

A 2024 study by the European Union Agency for Cybersecurity (ENISA) identified 47 distinct attack vectors targeting navigation stacks, ranging from GNSS spoofing to adversarial inputs against camera-based perception layers [17]. Remediation adds an estimated 8–12% to per-vehicle software development costs and extends certification timelines by three to six months. Until the Autonomous Navigation Market converges on a common cybersecurity assurance framework, these costs will dampen adoption, particularly in price-sensitive segments.

Liability and Insurance Gaps

The absence of harmonized liability rules for autonomous systems means that OEMs, fleet operators, and insurers continue to negotiate risk allocation on a case-by-case basis. The Geneva Convention on Road Traffic has yet to be amended for driverless operations, and self-insured retention thresholds for autonomous fleets remain two to three times higher than conventional vehicle equivalents [18].


Autonomous Navigation Market Opportunities

Autonomous Maritime and Inland Waterway Navigation

The International Maritime Organization’s 2025 interim rules for Maritime Autonomous Surface Ships (MASS) set out regulatory on-ramps for autonomous ferries, cargo vessels and port-support craft. The economic viability of Norway’s Yara Birkeland autonomous container vessel has been proved, and the European inland waterway network (over 37,000 km) is a greenfield deployment corridor for the Autonomous Navigation Market [8].


Drone Delivery and Urban Air Mobility

Commercial drone delivery services are being launched in test phases in the United States, Australia and portions of Southeast Asia. The FAA’s Part 108 rulemaking, anticipated by 2027, will establish a national framework for beyond-visual-line-of-sight operations, possibly unlocking a USD 6.3 billion addressable segment in the Autonomous Navigation Market by 2032 [12].


Emerging-Market Leapfrogging in Autonomous Transit

Saudi Arabia’s NEOM initiative has committed over USD 500 billion in infrastructure development, which includes completely autonomous public transit lines [9]. Autonomous mobility is one of the top GDP multipliers in India’s National Strategy for Artificial Intelligence, with trial routes in Bengaluru and Pune in the pipeline. These emerging-market programs are not hindered by legacy infrastructure and provide fast-track adoption paths for the Autonomous Navigation Market.


Navigation-as-a-Service and Data Monetization

OEMs and technology vendors are increasingly offering navigation capabilities as recurring-revenue services rather than one-time hardware sales. Fleet management platforms collecting anonymized navigation data can sell insights on route-optimization, predictive maintenance signals and high-definition map updates, producing ancillary revenue streams estimated at 15–20% of the primary platform value by 2030 [10].


Mining and Agricultural Autonomy

Autonomous haulage systems in open-pit mining operations have delivered 15–20% productivity gains and reduced safety incidents by up to 40% at sites operated by Rio Tinto and Caterpillar [7]. Precision agriculture platforms are adopting centimeter-level RTK-GNSS guidance for planting and harvesting, a trend that will broaden the addressable base of the Autonomous Navigation Market beyond traditional automotive and defense verticals.


Autonomous Navigation Market Future Outlook

AI-Native Navigation Stacks

Foundation models trained on petabyte-scale driving and navigation datasets are beginning to replace hand-coded perception pipelines. By 2030, transformer-based architectures are expected to handle end-to-end perception, prediction, and planning in a single inference pass, reducing software development cycles by an estimated 40% [3]. This shift will reshape competitive dynamics in the Autonomous Navigation Market, favoring companies with proprietary training-data assets.

Platform Convergence Across Domains

Automotive, aerial, maritime, and industrial navigation stacks are converging on shared middleware layers — particularly ROS 2 and AUTOSAR Adaptive — that enable cross-domain code reuse. By the early 2030s, a single navigation software platform may serve passenger cars, delivery drones, and port cranes with domain-specific parameter tuning rather than ground-up development [10]. This convergence will compress R&D costs and accelerate time-to-market for new entrants.

Electrification and Autonomous Mobility Synergies

The global electric vehicle fleet is projected to exceed 230 million units by 2030, according to the International Energy Agency [20]. Autonomous navigation and electrification share overlapping compute, sensor, and connectivity architectures, making joint deployment more capital-efficient than standalone rollouts. Autonomous electric shuttle fleets in European cities have demonstrated 25–30% lower per-passenger-km costs compared with diesel bus equivalents [11].

ESG Reporting and Safety-Driven Procurement

Institutional investors increasingly evaluate autonomous system providers on ESG criteria, including safety-incident rates, cybersecurity posture, and supply-chain traceability. The EU's Corporate Sustainability Reporting Directive (CSRD), effective 2025, requires large companies to disclose technology-related safety metrics — a requirement that will channel procurement toward Autonomous Navigation Market vendors with robust validation records and transparent testing data [14].


Autonomous Navigation Market Segmentation

By Platform

Segment Key Metric Primary Demand Driver
Automotive 49.4% share (2024) Level-2+ ADAS mandates and highway-pilot programs
Aerial Drones 15.3% CAGR Beyond-visual-line-of-sight delivery and inspection
Marine and Offshore USD 1.58 Billion (2025) IMO MASS guidelines and port automation
Defence and Space 14.7% CAGR Assured PNT and satellite-denied operations
Industrial and Logistics Robots 16.3% CAGR E-commerce fulfillment and AMR fleet scaling


Automotive remains the anchor platform within the Autonomous Navigation Market, driven by regulatory mandates that require advanced driver-assistance features as standard equipment in new vehicles. OEMs are moving beyond single-camera ADAS toward multi-sensor fusion stacks that integrate radar, cameras, and increasingly LiDAR for highway-pilot and automated-parking applications. Industrial and logistics robots represent the fastest-growing platform segment as autonomous mobile robots (AMRs) displace fixed conveyor infrastructure in warehouses and distribution centers. Amazon alone deployed over 750,000 mobile robots across its fulfillment network by 2024, a figure expected to double by 2028 [7].

By Component

Segment Key Metric Primary Demand Driver
Hardware 58.1% share (2024) Sensor arrays, compute modules, and antenna systems
Software 15.5% CAGR Perception algorithms, HD mapping, and OTA updates


Hardware dominance in the Autonomous Navigation Market reflects the capital intensity of LiDAR units, radar modules, inertial measurement units, and dedicated compute platforms. Software's faster growth rate signals a secular shift toward subscription-based revenue models, where OEMs charge consumers for feature activation — such as highway autopilot or automated parking — through over-the-air updates rather than upfront hardware margins.

By Sensor Type

Segment Key Metric Primary Demand Driver
LiDAR 34.9% share (2024) 3D point-cloud mapping for obstacle detection
Radar USD 2.31 Billion (2025) All-weather perception and long-range tracking
Camera 14.1% CAGR Vision-based lane-keeping and object classification
GNSS + INS 12.8% CAGR Positioning, timing, and dead-reckoning backup
Other Sensors 5.7% share (2024) Ultrasonic, thermal, and event cameras


LiDAR holds the largest sensor-type share in the Autonomous Navigation Market, a position reinforced by solid-state architectures that have eliminated the mechanical spinning components responsible for early-generation reliability concerns. Radar's resilience to rain, fog, and dust makes it an indispensable complement in safety-critical stacks, particularly for commercial trucking and maritime applications where weather variability is constant [2].


Regional Market Share Analysis

Region Key Metric Primary Investment Themes
North America 41.5% share (2024) Defense PNT, highway automation, commercial drone delivery
Europe USD 3.45 Billion (2025) UNECE regulations, maritime autonomy, industrial robotics
Asia-Pacific 22.5% share (2024) Manufacturing automation, smart-city pilots, semiconductor supply
South America 5.5% share (2024) Mining autonomy, agricultural guidance, infrastructure modernization
Middle East & Africa 16.1% CAGR (2026–2035) NEOM, Abu Dhabi transit, defense modernization

The Autonomous Navigation Market exhibits a distinct regional hierarchy shaped by regulatory maturity, defense spending patterns, and technology-cluster density. North America anchors global demand, while the Middle East & Africa accelerates fastest on the strength of sovereign infrastructure programs.


North America

Country Key Metric Key Driver
United States 78.2% of regional share Federal defense PNT budgets and AV corridor programs
Canada 13.4% of regional share Mining autonomy and cold-weather testing infrastructure
Mexico 8.4% of regional share Automotive manufacturing integration and nearshoring


The United States dominates the North American Autonomous Navigation Market through a combination of DoD procurement — including the Assured PNT Cross-Functional Team's multi-billion-dollar modernization agenda — and a permissive commercial testing environment across states such as California, Arizona, and Texas [1]. Canada's mining sector has adopted autonomous haulage at a significant scale, while Mexico's role as a nearshoring hub for automotive tier-one suppliers positions it as a growing integration center for navigation hardware.

Europe

Country Key Metric Key Driver
Germany 14.2% CAGR Automotive OEM R&D and Autobahn pilot programs
United Kingdom USD 0.58 Billion (2025) Connected and Automated Mobility Testbed funding
France 11.8% of regional share Naval defense and autonomous shuttle deployments
Italy 9.2% of regional share Precision agriculture and port automation
Spain USD 0.21 Billion (2025) Logistics corridor automation
Nordic Countries 13.6% CAGR Maritime autonomy and Arctic navigation testing
Russia 5.1% of regional share Defense-driven GLONASS integration
Rest of Europe 14.3% of regional share EU Horizon funding and cross-border pilots


Europe's regulatory coherence under UNECE WP.29 provides a unified certification pathway that reduces market-entry costs for the Autonomous Navigation Market. Germany's automotive OEMs — including Mercedes-Benz, BMW, and Volkswagen — have committed over EUR 8 billion collectively to autonomous driving R&D through 2028 [6]. The Nordic region stands out for maritime autonomy, with Finland's One Sea ecosystem operating the world's first autonomous shipping testbed in the Baltic Sea.

Asia-Pacific

Country Key Metric Key Driver
China 42.3% of regional share Government AV pilots and domestic sensor manufacturing
India 15.7% CAGR Smart-city corridors and agricultural autonomy
Japan USD 0.49 Billion (2025) Robotics leadership and aging-society mobility solutions
South Korea 14.8% CAGR Semiconductor ecosystem and K-City test infrastructure
ASEAN 8.9% of regional share Logistics automation and ride-hailing autonomy pilots
Rest of Asia-Pacific 6.4% of regional share Mining and defense programs


China leads the Asia-Pacific Autonomous Navigation Market through aggressive municipal permitting — Beijing, Shanghai, and Shenzhen have collectively licensed over 1,200 autonomous test vehicles — and a vertically integrated domestic sensor supply chain anchored by Hesai Technology and RoboSense [3]. Japan's Society 5.0 initiative prioritizes autonomous last-mile delivery and elderly mobility, while South Korea's K-City test facility supports full-stack validation under controlled urban, highway, and suburban conditions.

South America

Country Key Metric Key Driver
Brazil 54.8% of regional share Agricultural GPS-guidance adoption and mining haul autonomy
Argentina USD 0.14 Billion (2025) Precision agriculture expansion
Rest of South America 12.6% CAGR Mining and resource extraction pilots


Brazil anchors the South American Autonomous Navigation Market through its large-scale agricultural sector, where RTK-GNSS-guided planters and harvesters have achieved over 35% adoption among commercial farms exceeding 1,000 hectares [7]. Mining operations in Chile and Peru are deploying autonomous haulage trucks at copper and lithium extraction sites, creating secondary demand for ruggedized navigation systems.

Middle East & Africa

Country Key Metric Key Driver
Saudi Arabia 38.7% of regional share NEOM autonomous transit and Vision 2030
UAE USD 0.22 Billion (2025) Dubai autonomous transport strategy
South Africa 11.3% of regional share Mining automation and defense procurement
Egypt 10.6% CAGR Suez Canal vessel-tracking modernization
Rest of MEA 16.4% of regional share Infrastructure and security programs


The Middle East & Africa region is the fastest-growing corridor for the Autonomous Navigation Market, propelled by Saudi Arabia's Vision 2030 and the UAE's Dubai Autonomous Transportation Strategy targeting 25% autonomous trips by 2030 [9]. South Africa's mining sector, responsible for approximately 7% of global platinum output, is accelerating autonomous haulage adoption to address deep-level safety challenges.


Autonomous Navigation Market By Region, 2025-2035

Competitive Benchmarking

The Autonomous Navigation Market exhibits low concentration, with the top five companies collectively holding an estimated 28–33% revenue share. The Herfindahl-Hirschman Index (HHI) sits below 600, indicating a highly fragmented competitive field where no single vendor controls pricing or standard-setting. Competition spans sensor OEMs, compute-platform providers, full-stack software developers, and vertically integrated autonomy companies.

Company Est. Revenue Share Range Key Offerings Strategic Positioning
Waymo (Alphabet) ~5–8% Full-stack autonomous driving platform, robotaxi fleet Vertically integrated; largest real-world autonomous miles driven
Mobileye (Intel) ~4–7% EyeQ compute chips, SuperVision ADAS, REM mapping Chip-to-system provider; strong OEM partnership network
NVIDIA ~4–6% DRIVE Orin/Thor compute platforms, simulation tools Compute-infrastructure leader; domain-agnostic platform
Hexagon AB ~3–5% Positioning, sensor fusion, industrial autonomy Enterprise-grade precision across surveying, mining, agriculture
Trimble ~3–5% GNSS receivers, guidance systems, geospatial analytics Agriculture and construction navigation specialist
Honeywell ~2–4% Inertial navigation systems, avionics, defense PNT Aerospace and defense legacy; trusted government supplier
Northrop Grumman ~2–4% Embedded GPS/INS, autonomous undersea vehicles Defense-prime positioning; classified program access
Continental AG ~2–4% Radar, cameras, ADAS software, tire-pressure monitoring Tier-one automotive supplier; full-sensor portfolio
Ouster (formerly Velodyne) ~1–3% Digital LiDAR sensors, perception software Pure-play LiDAR; industrial and automotive focus
Robert Bosch GmbH ~2–4% Radar, cameras, ultrasonic sensors, ADAS ECUs Scale manufacturing; broadest automotive sensor portfolio


Recent News & Developments


  • Mobileye (2022 ): Unveiled the EyeQ Ultra chip at CES 2025, delivering 176 TOPS of compute for Level-4 autonomous driving at a power envelope below 100 watts, with production commitments from two global OEMs [3].
  • NVIDIA (November 2024): Announced the DRIVE Thor platform achieving 2,000 TOPS in a single automotive-grade SoC, securing design wins with BYD, Mercedes-Benz, and JLR for 2026 model-year vehicles [16].


  • U.S. Department of Defense (April 2024): Released the Replicator Initiative's second tranche, allocating USD 1.2 billion for autonomous drone swarms and uncrewed ground vehicles with embedded navigation resilience [1].


  • Ouster (February 2023 ): Completed its merger integration with Velodyne Lidar and launched the REV7 digital LiDAR sensor, achieving a 40% range improvement at identical price points [2].


Autonomous Navigation Market Report Scope

Parameter Detail
Market Scope Global Autonomous Navigation Market across automotive, aerial, marine, defense, and industrial platforms
Study Period 2021–2035
CAGR (2026–2035) 13.8% (2026–2035)
Base Year (2025)  USD 14.38 Billion
Forecast Endpoint (2035)  USD 52.44 Billion
Fastest Growing Segment Industrial and Logistics Robots (by platform); Middle East & Africa (by region)
Companies Profiled 10 (Waymo, Mobileye, NVIDIA, Hexagon, Trimble, Honeywell, Northrop Grumman, Continental, Ouster, Bosch)
Valuation Currency USD Billion


FAQs

How do autonomous navigation systems maintain positioning accuracy indoors or underground where satellite signals are unavailable?
Systems rely on inertial measurement units, ultra-wideband beacons, and visual odometry to maintain centimeter-level accuracy without satellite input. Mining and warehouse deployments routinely achieve sub-10 cm precision using these sensor-fusion approaches [23].
What certification standards should fleet buyers prioritize when evaluating autonomous navigation vendors?
ISO 22737 for low-speed automated driving and ISO 21448 (SOTIF) for safety of intended functionality are the two most procurement-relevant standards. Vendors certified under both demonstrate validated safety-case methodologies [5].
How does the total cost of ownership for an autonomous navigation stack compare with a human-operated equivalent over a five-year horizon?
Autonomous stacks typically break even within 2.5–3 years for commercial trucking and mining applications, delivering 20–30% lower cumulative costs by year five through reduced labor and fuel-efficiency gains [23].
What role do high-definition maps play versus real-time perception in current autonomous navigation architectures?
HD maps provide a static prior that accelerates real-time perception by pre-loading lane geometry and traffic-sign positions. Most production systems use both, though map-free approaches are gaining traction for scalability [10].
How are insurance carriers adapting underwriting models to accommodate autonomous navigation risk profiles?
Insurers are shifting from driver-behavior to system-performance metrics, using OEM telemetry data and simulation-validated safety cases to price policies. Premiums for autonomous fleets remain 15–25% higher than conventional equivalents [18].
What are the primary differences between automotive-grade and defense-grade navigation system requirements?
Defense systems demand operation under electronic warfare conditions, including jamming and spoofing, with MIL-STD-810 environmental hardening. Automotive systems prioritize cost optimization and consumer-safety certification over contested-environment resilience [1].
How will 5G and low-Earth-orbit satellite constellations influence autonomous navigation performance by 2030?
5G vehicle-to-everything communication reduces latency for cooperative perception, while LEO constellations improve GNSS accuracy and availability in polar and urban-canyon environments. Combined, they reduce positioning error margins by an estimated 35–50% [13].    
Author
Author
Author Profile
Abbas Raut LinkedIn
Research Analyst
Abbas Raut is a Senior Research Analyst with 5+ years of experience delivering data-driven insights and strategic recommendations across the Automotive and Aerospace & Defense sectors. He specializes in emerging technologies, industry value chains, and global market dynamics shaping the future of mobility and defense. In automotive, Abbas has led studies on EVs, charging stations, BMS, superchargers, and more, guiding stakeholders through electrification and regulatory shifts. In Aerospace & Defense, he has analyzed markets for military electronics, drones, radars, and electronic warfare solutions, supporting procurement and investment strategies. With expertise in market sizing, forecasting, benchmarking, and technology adoption, Abbas is known for transforming complex datasets into actionable insights that drive strategy, innovation, and growth.
Co-Author
Co-Author Profile
Swapnil Palwe LinkedIn
Team Lead - Research
With a technical background as Bachelor's in Mechanical Engineering, with MBA in Operations Management , Swapnil has 6+ years of experience in market research, consulting and analytics with the tasks of data mining, analysis, and project execution. He is the POC for our clients, for their consulting projects running under the Automotive/A&D domain. Swapnil has worked on major projects in verticals such as Aerospace & Defense, Automotive and many other domain projects. He has worked on projects for fortune 500 companies' syndicate and consulting projects along with several government projects.

Research Approach


Secondary Research

The secondary research process involved comprehensive analysis of regulatory databases, technical standards repositories, peer-reviewed engineering journals, defense publications, and authoritative transportation authorities. Key sources included the US Federal Aviation Administration (FAA), European Union Aviation Safety Agency (EASA), National Highway Traffic Safety Administration (NHTSA), US Department of Transportation (USDOT), United Nations Economic Commission for Europe (UNECE) WP.29 Regulations, International Maritime Organization (IMO), US Coast Guard Navigation Safety Standards, NASA Technical Reports Server (NTRS), European Space Agency (ESA) Navigation Programs, SAE International Standards (J3016 Automated Driving), IEEE Standards Association (P7000 Series), RTCA DO-344 Guidelines for UAS, DARPA Research Publications, MITRE Corporation Technical Papers, National Transportation Safety Board (NTSB) Accident Reports, European GNSS Agency (GSA), International Association of Marine Insurers (IUMI), International Federation of Robotics (IFR) World Robotics Report, and national transport ministry reports from key markets. These sources were used to collect certification standards data, safety incident statistics, technology readiness levels, regulatory compliance frameworks, and patent landscape analysis for LiDAR systems, computer vision algorithms, autonomous processing units, and sensor fusion technologies across airborne, land, marine, and space platforms.


Primary Research

In order to gather both qualitative and quantitative insights, supply-side and demand-side stakeholders were interviewed during the primary research process. CEOs, VPs of Engineering, Chief Technology Officers, heads of Autonomous Systems Development, heads of regulatory compliance, and product directors from autonomous navigation software providers, autonomous vehicle OEMs, sensor manufacturers (LiDAR/RADAR/camera systems), unmanned aerial system (UAS) developers, maritime autonomy companies, and defense contractors were examples of supply-side sources. Demand-side sources comprised fleet operations directors, chief pilots of autonomous aviation programs, maritime operations managers, defense procurement officers, logistics automation leaders from commercial shipping companies, autonomous truck fleet managers, and smart infrastructure planners from municipal transportation authorities. In addition to confirming autonomous software roadmap timelines and gathering information on sensor integration challenges, navigation safety protocols, regulatory approval pathways, and end-user adoption barriers in defense versus commercial applications, primary research validated market segmentation across airborne (UAVs, urban air mobility), land (autonomous trucks, robotaxis), marine (autonomous ships, underwater vehicles), and space platforms.

Primary Respondent Breakdown:

• By Designation: C-level Primaries (30%), Director Level (32%), Others (38%)

• By Region: North America (38%), Europe (30%), Asia-Pacific (25%), Rest of World (7%)


Market Size Estimation

Global market valuation was derived through revenue mapping and deployment volume analysis across autonomous navigation systems. The methodology included:

• Identification of 50+ key autonomous navigation developers across North America, Europe, Asia-Pacific, and Middle East & Africa

• Solution mapping across processing units (GPUs/FPGAs), sensing systems (LiDAR, RADAR, ultrasonic, vision systems), and navigation software (AI/ML algorithms, SLAM technologies)

• Platform segmentation analysis covering airborne drones/UTM systems, land-based autonomous vehicles/AGVs, marine autonomous surface ships, and space navigation satellites

• Analysis of reported and modeled annual revenues specific to autonomous navigation solution portfolios and hardware component sales

• Coverage of manufacturers and software providers representing 72-78% of global market share in 2024

• Extrapolation using bottom-up (deployment unit volume × ASP by platform and region) and top-down (vendor revenue validation cross-referenced with defense procurement data and commercial fleet deployment schedules) approaches to derive segment-specific valuations for military & government versus commercial applications

Download Free Sample

Kindly complete the form below to receive a free sample of this Report

Download PDF ×

We do not share your information with anyone. However, we may send you emails based on your report interest from time to time. You may contact us at any time to opt-out.
















