×
Hero Background
English
Chinese
French
Japanese
Korean
German
Spanish

Avascular Necrosis Market Trends

ID: MRFR/MED/4673-CR
539 Pages
Kinjoll Dey
June 2018

Avascular Necrosis Market Research Report Information By Type (Trauma Related Avascular Necrosis (AVN) and Non-Trauma Related Avascular Necrosis (AVN)0, By Treatment (Nonsteroidal Anti-Inflammatory Drugs (NSAIDS), Cholesterol Lowing Drugs, Osteoporosis Drugs, Blood Thinners, and Others), By Diagnosis (Imaging, Biopsy, CT Scan, PET and X- Ray), By End User (Hospital Pharmacies, Retail Pharmacies, and Online Pharmacies) And By Region (North America, Europe, Asia-Pacific, And Rest Of The World) –Market Forecast Till 2035

Share:
Download PDF ×

We do not share your information with anyone. However, we may send you emails based on your report interest from time to time. You may contact us at any time to opt-out.

Avascular Necrosis Market Infographic
Purchase Options

Market Trends

Key Emerging Trends in the Avascular Necrosis Market

People are preferring synthetic bone-grafts over natural ones like allografts and bovine-derived grafts. The issue with natural materials is their varied particle size. Now, the trend is leaning toward synthetic grafts made of ceramics and polymers because they can be precisely manufactured. This shift to synthetic grafts is likely to impact the market's growth positively.

Nanomedicine is all about using tiny technology in medicine. Nanotechnology is about controlling really small particles, smaller than 100 nanometers. These particles are stronger and more durable than regular ones and can be made really small. This smaller size means less harm and quicker healing. Using nanotechnology can also help save costs by reducing material volume. However, nanotechnology is new and needs more testing to make sure it's safe and useful. So, researchers are working on making lightweight and compact implants using nanotechnology, which is helping the market grow.

There's a growing need to improve synthetic bone grafts. Some synthetic materials don’t have the organic stuff that helps bone grow. To fix this, scientists are using recombinant DNA technology to mix these materials with growth factors. This helps enhance the grafts and stem cell-based autografts. The use of biotechnology is expected to improve synthetic bone grafts’ characteristics like bone growth, and this is expected to boost the market.

Titanium-foam implants are being developed for bone grafting. These implants are like natural bone in structure and fit better into the body. They have properties similar to bones and are stronger and more flexible than other synthetic materials. This research on stronger synthetic grafts is expected to have a faster growth rate.

3D bioprinting is a groundbreaking technology allowing custom-made bone graft products. This involves creating these products by layering materials based on a digital 3D model. This technology has been used for creating prosthetics, dental implants, human organs, and tissue. It can also make degradable bone grafts, controlling their strength and materials. This could reduce the need for organ donation and lower the risk of rejection. The development of these 3D printed implants is expected to boost the market by offering personalized bone grafts and minimizing organ donations.

Author
Kinjoll Dey
Research Analyst Level I

He is an extremely curious individual currently working in Healthcare and Medical Devices Domain. Kinjoll is comfortably versed in data centric research backed by healthcare educational background. He leverages extensive data mining and analytics tools such as Primary and Secondary Research, Statistical Analysis, Machine Learning, Data Modelling. His key role also involves Technical Sales Support, Client Interaction and Project management within the Healthcare team. Lastly, he showcases extensive affinity towards learning new skills and remain fascinated in implementing them.

Leave a Comment

FAQs

What is the current valuation of the Avascular Necrosis Market as of 2024?

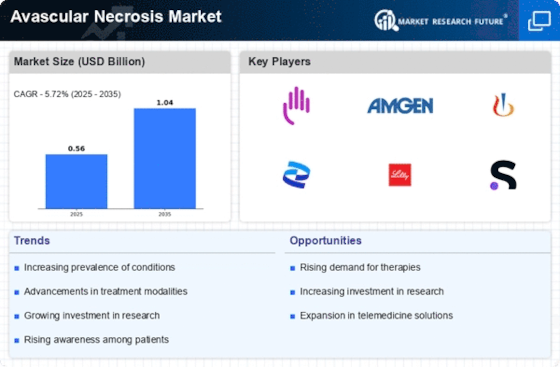
The Avascular Necrosis Market was valued at 0.564 USD Billion in 2024.

What is the projected market size for Avascular Necrosis by 2035?

The market is projected to reach 1.04 USD Billion by 2035.

What is the expected CAGR for the Avascular Necrosis Market during the forecast period 2025 - 2035?

The expected CAGR for the Avascular Necrosis Market during 2025 - 2035 is 5.72%.

Which segment of Avascular Necrosis shows the highest valuation in 2024?

In 2024, the Trauma Related Avascular Necrosis segment had a valuation of 0.3392 USD Billion.

What are the key treatment options available for Avascular Necrosis?

Key treatment options include Nonsteroidal Anti-Inflammatory Drugs, Cholesterol Lowering Drugs, and Osteoporosis Drugs.

How does the market for Non-Trauma Related Avascular Necrosis compare to Trauma Related Avascular Necrosis?

The Non-Trauma Related Avascular Necrosis segment was valued at 0.2248 USD Billion in 2024, indicating a lower valuation than its trauma counterpart.

Market Summary

As per MRFR analysis, the Avascular Necrosis Market Size was estimated at 0.564 USD Billion in 2024. The Avascular Necrosis industry is projected to grow from 0.5963 in 2025 to 1.04 by 2035, exhibiting a compound annual growth rate (CAGR) of 5.72 during the forecast period 2025 - 2035.

Key Market Trends & Highlights

The Avascular Necrosis Market is poised for growth driven by technological advancements and increasing awareness.

  • Technological advancements in treatment are reshaping the Avascular Necrosis Market landscape, particularly in North America. Rising awareness and education about Avascular Necrosis Market are contributing to improved patient outcomes in the Asia-Pacific region. Collaborative research efforts are fostering innovation, especially in the trauma-related AVN segment, which remains the largest. The increasing incidence of Avascular Necrosis Market and advancements in diagnostic techniques are key drivers propelling market growth.

Market Size & Forecast

2024 Market Size 0.564 (USD Billion)
2035 Market Size 1.04 (USD Billion)
CAGR (2025 - 2035) 5.72%
Largest Regional Market Share in 2024 North America

Major Players

<p>Bristol-Myers Squibb (US), Amgen (US), <a href="https://www.novartis.com/ca-en/sites/novartis_ca/files/aclasta_patient_e_1.pdf">Novartis </a>(CH), Pfizer (US), Eli Lilly and Company (US), Sanofi (FR), AstraZeneca (GB), Merck &amp; Co. (US), Johnson &amp; Johnson (US)</p>

Market Trends

The Avascular Necrosis Market is currently experiencing notable developments driven by a combination of factors including advancements in treatment options and increasing awareness of the condition. Avascular necrosis, characterized by the death of bone tissue due to a lack of blood supply, has garnered attention as healthcare providers and researchers explore innovative therapies. The market appears to be influenced by a growing emphasis on early diagnosis and intervention, which may lead to improved patient outcomes. Furthermore, the integration of technology in treatment modalities, such as regenerative medicine and minimally invasive surgical techniques, seems to enhance the overall management of this condition. In addition, the Avascular Necrosis Market is likely to benefit from collaborative efforts among stakeholders, including pharmaceutical companies, healthcare professionals, and patient advocacy groups. These collaborations may facilitate the development of new drugs and therapies, potentially expanding the treatment landscape. Moreover, the increasing prevalence of risk factors associated with avascular necrosis, such as corticosteroid use and alcohol consumption, suggests a rising demand for effective management strategies. As awareness continues to grow, the market may evolve to address the needs of a diverse patient population, ultimately leading to enhanced therapeutic options and improved quality of life for those affected.

Technological Advancements in Treatment

The Avascular Necrosis Market is witnessing a surge in technological innovations that enhance treatment efficacy. Techniques such as stem cell therapy and advanced imaging modalities are being explored to improve diagnosis and management. These advancements may lead to more personalized treatment approaches, potentially increasing patient satisfaction and outcomes.

Rising Awareness and Education

There is a growing emphasis on raising awareness about avascular necrosis among healthcare providers and the general public. Educational initiatives aim to inform individuals about risk factors and early symptoms, which could facilitate timely diagnosis and intervention. This trend may contribute to a more proactive approach in managing the condition.

Collaborative Research Efforts

The Avascular Necrosis Market is likely to benefit from increased collaboration among various stakeholders, including researchers, pharmaceutical companies, and healthcare institutions. Such partnerships may accelerate the development of novel therapies and clinical trials, ultimately enhancing the treatment landscape for patients suffering from this condition.

Avascular Necrosis Market Market Drivers

Increasing Geriatric Population

The increasing geriatric population is a crucial driver for the Avascular Necrosis Market. As individuals age, the risk of developing AVN escalates due to factors such as decreased bone density and the prevalence of comorbidities. The World Health Organization projects that the number of people aged 60 years and older will double by 2050, which may lead to a corresponding rise in AVN cases. This demographic shift necessitates the development of age-appropriate treatment strategies and rehabilitation programs. Healthcare providers are likely to focus on managing AVN in older adults, thereby driving demand for specialized therapies. Consequently, the Avascular Necrosis Market is expected to expand as it adapts to the needs of an aging population.

Advancements in Diagnostic Techniques

Advancements in diagnostic techniques are significantly influencing the Avascular Necrosis Market. Enhanced imaging modalities, such as MRI and CT scans, allow for earlier and more accurate detection of AVN, which is crucial for effective treatment. The ability to identify AVN in its initial stages can lead to better patient outcomes and reduced healthcare costs. As diagnostic technologies continue to evolve, they are expected to facilitate timely interventions, thereby increasing the demand for therapeutic options. The integration of artificial intelligence in imaging analysis further augments diagnostic accuracy, potentially expanding the patient base seeking treatment. Consequently, the Avascular Necrosis Market is poised for growth as healthcare providers increasingly adopt these advanced diagnostic tools.

Enhanced Patient Education and Awareness

Enhanced patient education and awareness are vital drivers for the Avascular Necrosis Market. Increased awareness about AVN among patients and healthcare professionals leads to earlier diagnosis and treatment, which can significantly improve outcomes. Educational initiatives, including workshops and informational campaigns, are being implemented to inform the public about the risk factors and symptoms of AVN. As patients become more informed, they are more likely to seek medical advice and treatment, thereby increasing the demand for therapeutic options. Furthermore, healthcare providers are recognizing the importance of patient education in managing AVN, which may lead to improved adherence to treatment protocols. This growing emphasis on education is likely to foster a more proactive approach to AVN management, positively impacting the Avascular Necrosis Market.

Increasing Incidence of Avascular Necrosis

The rising incidence of avascular necrosis (AVN) is a pivotal driver for the Avascular Necrosis Market. Factors such as lifestyle changes, increased alcohol consumption, and the prevalence of conditions like obesity and corticosteroid use contribute to the growing number of AVN cases. Recent estimates suggest that approximately 10,000 to 20,000 new cases of AVN are diagnosed annually, indicating a substantial patient population requiring treatment. This increasing incidence necessitates the development of innovative therapies and interventions, thereby propelling market growth. As healthcare systems adapt to manage this rising burden, the Avascular Necrosis Market is likely to witness enhanced investment in research and development, leading to the introduction of novel treatment modalities.

Growing Investment in Research and Development

Growing investment in research and development (R&D) is a significant driver for the Avascular Necrosis Market. Pharmaceutical companies and research institutions are increasingly focusing on developing novel therapies and treatment protocols for AVN. This trend is underscored by the rising number of clinical trials aimed at evaluating new drugs and surgical techniques. In recent years, the number of clinical trials related to AVN has surged, reflecting a commitment to addressing this challenging condition. Furthermore, government and private funding for AVN research is on the rise, which may lead to breakthroughs in treatment options. As R&D efforts intensify, the Avascular Necrosis Market is likely to benefit from the introduction of innovative therapies that can improve patient outcomes.

Market Segment Insights

By Type: Trauma Related AVN (Largest) vs. Non-Trauma Related AVN (Fastest-Growing)

<p>In the Avascular Necrosis Market (AVN) Market, the distribution of market share between trauma-related and non-trauma-related segments reveals significant insights. Trauma-related AVN remains the largest segment, attributed to the consistent incidence of traumatic injuries leading to bone damage. This segment accounts for a considerable portion of the overall AVN cases, thus marking its dominance within the market. Conversely, the non-trauma-related segment, while smaller, is gaining traction due to increased awareness and diagnosis of AVN resulting from non-traumatic causes, such as steroid use and alcohol consumption, which are becoming more prevalent in the population.</p>

<p>Avascular Necrosis Market: Trauma Related (Dominant) vs. Non-Trauma Related (Emerging)</p>

<p>The trauma-related Avascular Necrosis Market (AVN) segment is characterized by its strong association with various traumatic injuries that can lead to compromised blood supply to bones. It encompasses conditions linked to fractures, dislocations, and other physical injuries, leading to a relatively stable demand for treatment options. In contrast, the non-trauma-related AVN segment is emerging as a significant player due to rising cases driven by lifestyle factors and medical interventions. Increased consumption of corticosteroids and complications from diseases like sickle cell disease are contributing to its growth. This segment underscores a shift in patient demographics and medical attention, reflecting broader health trends and the evolving understanding of AVN.</p>

By Treatment: Nonsteroidal Anti-Inflammatory Drugs (NSAIDS) (Largest) vs. Osteoporosis Drugs (Fastest-Growing)

<p>In the Avascular Necrosis Market, Nonsteroidal Anti-Inflammatory Drugs (NSAIDS) have established themselves as the largest segment, capturing a significant share of the overall treatment landscape. These drugs are widely prescribed due to their effectiveness in reducing pain and inflammation associated with the condition, making them the go-to choice for many physicians and patients alike. Following NSAIDS, the other segments, including Cholesterol Lowering Drugs and Blood Thinners, contribute to the market but find themselves with a comparatively smaller share as they serve specific aspects of the disease treatment.</p>

<p>NSAIDS (Dominant) vs. Osteoporosis Drugs (Emerging)</p>

<p>Nonsteroidal Anti-Inflammatory Drugs (NSAIDS) dominate the Avascular Necrosis Market treatment segment, known for their robust anti-inflammatory properties and ability to manage pain effectively. Their well-established use in clinical practice positions them as a preferred option for management of avascular necrosis symptoms, consequently enhancing patient quality of life. In contrast, Osteoporosis Drugs represent an emerging segment, as they are increasingly recognized for their potential role in treating avascular necrosis. As more research uncovers their benefits in enhancing bone density and preventing further joint deterioration, the demand for osteoporosis medications is set to rise, elevating their role in treatment strategies.</p>

By Diagnosis: X-Ray (Largest) vs. MRI (Fastest-Growing)

<p>In the Avascular Necrosis Market, the Diagnosis segment shows a robust distribution among various imaging modalities. X-Ray remains the dominant diagnostic tool due to its wide availability and cost-effectiveness, capturing a significant portion of the market. Meanwhile, MRI is emerging as a key player, increasingly adopted for its superior accuracy in detecting early signs of avascular necrosis, suggesting a shift towards more advanced imaging <a href="https://www.marketresearchfuture.com/reports/medical-device-technology-market-43308">technologies </a>among healthcare providers. Growth trends within the Diagnosis segment are driven by advancements in imaging technology and an increasing emphasis on early diagnosis. As awareness of avascular necrosis grows, alongside a rise in risk factors such as corticosteroid use and trauma, demand for accurate diagnostic methods continues to expand. MRI, in particular, is witnessing a rapid adoption rate, positioning it as the fastest-growing modality in this segment, highlighting a transition toward more sophisticated healthcare solutions.</p>

<p>Imaging: X-Ray (Dominant) vs. MRI (Emerging)</p>

<p>In the context of the Avascular Necrosis Market, X-Ray is recognized as the dominant imaging modality due to its affordability, ease of use, and speed of operation. It is often the first step in the diagnostic process, allowing healthcare professionals to quickly assess bone structure. Conversely, MRI is gaining traction as an emerging technique, celebrated for its ability to provide detailed images of soft tissue and bone marrow. Its sensitivity to early pathological changes makes it indispensable in diagnosing avascular necrosis at earlier stages, thereby enabling timely intervention. The increasing prevalence of chronic conditions and advancements in MRI technology underscore its growing relevance in clinical settings.</p>

By End User: Hospital Pharmacies (Largest) vs. Retail Pharmacies (Fastest-Growing)

<p>In the Avascular Necrosis Market, hospital pharmacies constitute the largest segment, primarily due to their critical role in managing acute cases and facilitating specialized treatment protocols. These pharmacies typically provide access to a wider range of focused therapies and medications, contributing significantly to their market share. Retail pharmacies, while smaller in comparison, are experiencing notable growth as they expand their offerings to include more specialized medication for chronic conditions like avascular necrosis, thus capturing a portion of patients currently seeking alternative options. The growth trends indicate a shift towards retail pharmacies that focus on patient-centered care, reflecting a rising patient preference for convenience and accessibility in obtaining medications. Online pharmacies are also emerging as a viable option, driven by the increasing digitization of healthcare and consumer demand for easy access to medications. Their growth is propelled by the pandemic's impact on shopping behaviors, paving the way for a more engaged and connected patient experience in obtaining treatment for avascular necrosis.</p>

<p>Hospital Pharmacies (Dominant) vs. Retail Pharmacies (Emerging)</p>

<p>Hospital pharmacies play a dominant role in the Avascular Necrosis Market by providing specialized care and direct access to therapies essential for managing the disease effectively. They are integral in facilitating patient treatment plans that require careful monitoring and frequent adjustments based on patient responses. On the other hand, retail pharmacies are becoming an emerging force as they adapt to consumer needs by offering more personalized services and specialized medications. These pharmacies leverage their local presence and customer relationships to foster loyalty and provide rapid access to treatment. Their growth is also supported by marketing strategies that emphasize convenience, such as customizable prescriptions and easy refill options, further enhancing their competitive positioning against traditional hospital pharmacies.</p>

Get more detailed insights about Avascular Necrosis Market Research Report – Forecast to 2035

Regional Insights

North America : Leading Market for Innovation

North America is the largest market for Avascular Necrosis Market, holding approximately 45% of the global market share. The region benefits from advanced healthcare infrastructure, high prevalence of risk factors such as corticosteroid use, and increasing awareness of the condition. Regulatory support from agencies like the FDA further drives market growth, facilitating the approval of innovative therapies and treatments. The United States is the primary contributor, with significant investments from key players like Bristol-Myers Squibb, Pfizer, and Amgen. The competitive landscape is characterized by a focus on research and development, with companies striving to introduce novel therapies. Canada also plays a vital role, contributing to the market with its healthcare policies that support patient access to treatments. Overall, the region's robust pharmaceutical sector positions it as a leader in Avascular Necrosis Market management.

Europe : Emerging Market with Growth Potential

Europe is an emerging powerhouse in the Avascular Necrosis Market, accounting for approximately 30% of the global share. The region is witnessing a rise in demand for effective treatments, driven by an aging population and increasing incidence of conditions leading to AVN. Regulatory frameworks, such as the European Medicines Agency's guidelines, are fostering innovation and expediting the approval process for new therapies. Leading countries include Germany, France, and the UK, where healthcare systems are increasingly prioritizing the management of Avascular Necrosis Market. Key players like Novartis and Sanofi are actively involved in research and development, enhancing their product portfolios. The competitive landscape is marked by collaborations and partnerships aimed at improving treatment outcomes. The region's commitment to healthcare innovation positions it favorably for future growth in the Avascular Necrosis Market.

Asia-Pacific : Rapidly Growing Market Segment

Asia-Pacific is rapidly emerging as a significant market for Avascular Necrosis Market, holding around 20% of the global market share. The region's growth is fueled by increasing healthcare expenditure, rising awareness of the disease, and a growing population at risk. Countries like China and India are witnessing a surge in demand for effective treatments, supported by government initiatives aimed at improving healthcare access. China is the largest market in the region, with a focus on expanding healthcare infrastructure and increasing investment in pharmaceutical research. India follows closely, with a growing number of local and international players entering the market. The competitive landscape is characterized by a mix of established companies and startups, all striving to innovate and provide effective solutions for Avascular Necrosis Market management. This dynamic environment is expected to drive further growth in the coming years.

Middle East and Africa : Emerging Market with Challenges

The Middle East and Africa region represents a smaller segment of the Avascular Necrosis Market, accounting for approximately 5% of the global share. The market is challenged by limited healthcare infrastructure and varying levels of access to treatment. However, increasing awareness and government initiatives aimed at improving healthcare services are driving gradual growth in the region. Countries like South Africa and the UAE are leading the way, with efforts to enhance healthcare systems and access to innovative treatments. The presence of key players is growing, although the market remains competitive with local firms also entering the space. The region's unique challenges present opportunities for growth, particularly as healthcare policies evolve to better address the needs of patients suffering from Avascular Necrosis Market.

Key Players and Competitive Insights

The Avascular Necrosis Market is characterized by a complex interplay of competitive dynamics, driven by a growing demand for innovative treatment options and a heightened focus on patient-centric care. Key players such as Bristol-Myers Squibb (US), Amgen (US), and Novartis (CH) are strategically positioning themselves through a combination of research and development, partnerships, and regional expansions. Bristol-Myers Squibb (US) has been particularly focused on enhancing its portfolio through collaborations aimed at advancing therapies for bone health, while Amgen (US) emphasizes its commitment to innovation in biologics, which could potentially address the underlying causes of avascular necrosis. Novartis (CH), on the other hand, appears to be leveraging its extensive research capabilities to explore novel treatment pathways, thereby shaping a competitive environment that is increasingly centered on advanced therapeutic solutions.

In terms of business tactics, companies are increasingly localizing manufacturing and optimizing supply chains to enhance efficiency and responsiveness to market demands. The Avascular Necrosis Market is moderately fragmented, with a mix of established pharmaceutical giants and emerging biotech firms. This fragmentation allows for diverse approaches to treatment, yet the collective influence of key players like Pfizer (US) and Eli Lilly and Company (US) is significant, as they drive innovation and set industry standards through their extensive research initiatives and market presence.

In August 2025, Pfizer (US) announced a strategic partnership with a leading biotech firm to co-develop a novel gene therapy aimed at treating avascular necrosis. This collaboration is expected to leverage cutting-edge technology to address the disease's root causes, potentially revolutionizing treatment options. The strategic importance of this partnership lies in Pfizer's ability to combine its vast resources with innovative approaches, thereby enhancing its competitive edge in the market.

In September 2025, Eli Lilly and Company (US) launched a new clinical trial for a promising drug candidate targeting avascular necrosis, which has shown encouraging results in early-stage studies. This move underscores Eli Lilly's commitment to advancing its pipeline and addressing unmet medical needs. The trial's outcomes could significantly influence the company's market positioning, particularly if the drug demonstrates efficacy in larger populations.

In October 2025, Novartis (CH) unveiled a new initiative focused on digital health solutions aimed at improving patient outcomes in avascular necrosis. By integrating digital tools into treatment protocols, Novartis seeks to enhance patient engagement and adherence, which may lead to better health outcomes. This initiative reflects a broader trend towards digitalization in healthcare, indicating that Novartis is keen on staying ahead in a rapidly evolving landscape.

As of October 2025, current competitive trends in the Avascular Necrosis Market are increasingly defined by digitalization, sustainability, and the integration of artificial intelligence in treatment development. Strategic alliances are becoming pivotal, as companies recognize the value of collaboration in driving innovation and improving patient care. Looking ahead, competitive differentiation is likely to evolve from traditional price-based competition towards a focus on technological advancements, innovative therapies, and reliable supply chains, suggesting a transformative shift in how companies approach market challenges.

Key Companies in the Avascular Necrosis Market market include

Industry Developments

Future Outlook

Avascular Necrosis Market Future Outlook

<p>The Avascular Necrosis Market is projected to grow at a 5.72% CAGR from 2024 to 2035, driven by advancements in treatment options and increasing awareness.</p>

New opportunities lie in:

  • <p>Development of targeted drug delivery systems for localized treatment.</p><p>Expansion of telehealth services for remote patient monitoring.</p><p>Investment in regenerative medicine technologies to enhance recovery outcomes.</p>

<p>By 2035, the Avascular Necrosis Market is expected to achieve substantial growth, reflecting evolving treatment paradigms.</p>

Market Segmentation

Avascular Necrosis Market Type Outlook

  • Trauma Related Avascular Necrosis (AVN)
  • Non-Trauma Related Avascular Necrosis (AVN)

Avascular Necrosis Market End User Outlook

  • Hospital Pharmacies
  • Retail Pharmacies
  • Online Pharmacies

Avascular Necrosis Market Diagnosis Outlook

  • Imaging
  • Biopsy
  • CT Scan
  • PET
  • X-Ray

Avascular Necrosis Market Treatment Outlook

  • Nonsteroidal Anti-Inflammatory Drugs (NSAIDS)
  • Cholesterol Lowing Drugs
  • Osteoporosis Drugs
  • Blood Thinners
  • Others

Report Scope

MARKET SIZE 20240.564(USD Billion)
MARKET SIZE 20250.5963(USD Billion)
MARKET SIZE 20351.04(USD Billion)
COMPOUND ANNUAL GROWTH RATE (CAGR)5.72% (2024 - 2035)
REPORT COVERAGERevenue Forecast, Competitive Landscape, Growth Factors, and Trends
BASE YEAR2024
Market Forecast Period2025 - 2035
Historical Data2019 - 2024
Market Forecast UnitsUSD Billion
Key Companies ProfiledMarket analysis in progress
Segments CoveredMarket segmentation analysis in progress
Key Market OpportunitiesAdvancements in regenerative medicine offer promising treatments for the Avascular Necrosis Market.
Key Market DynamicsRising demand for innovative therapies drives competition and investment in Avascular Necrosis treatment solutions.
Countries CoveredNorth America, Europe, APAC, South America, MEA

FAQs

What is the current valuation of the Avascular Necrosis Market as of 2024?

The Avascular Necrosis Market was valued at 0.564 USD Billion in 2024.

What is the projected market size for Avascular Necrosis by 2035?

The market is projected to reach 1.04 USD Billion by 2035.

What is the expected CAGR for the Avascular Necrosis Market during the forecast period 2025 - 2035?

The expected CAGR for the Avascular Necrosis Market during 2025 - 2035 is 5.72%.

Which segment of Avascular Necrosis shows the highest valuation in 2024?

In 2024, the Trauma Related Avascular Necrosis segment had a valuation of 0.3392 USD Billion.

What are the key treatment options available for Avascular Necrosis?

Key treatment options include Nonsteroidal Anti-Inflammatory Drugs, Cholesterol Lowering Drugs, and Osteoporosis Drugs.

How does the market for Non-Trauma Related Avascular Necrosis compare to Trauma Related Avascular Necrosis?

The Non-Trauma Related Avascular Necrosis segment was valued at 0.2248 USD Billion in 2024, indicating a lower valuation than its trauma counterpart.

  1. SECTION I: EXECUTIVE SUMMARY AND KEY HIGHLIGHTS
    1. EXECUTIVE SUMMARY
      1. Market Overview
      2. Key Findings
      3. Market Segmentation
      4. Competitive Landscape
      5. Challenges and Opportunities
      6. Future Outlook 2 SECTION II: SCOPING, METHODOLOGY AND MARKET STRUCTURE
    2. MARKET INTRODUCTION
      1. Definition
      2. Scope of the study
    3. RESEARCH METHODOLOGY
      1. Overview
      2. Data Mining
      3. Secondary Research
      4. Primary Research
      5. Forecasting Model
      6. Market Size Estimation
      7. Data Triangulation
      8. Validation 3 SECTION III: QUALITATIVE ANALYSIS
    4. MARKET DYNAMICS
      1. Overview
      2. Drivers
      3. Restraints
      4. Opportunities
    5. MARKET FACTOR ANALYSIS
      1. Value chain Analysis
      2. Porter's Five Forces Analysis
      3. COVID-19 Impact Analysis
    6. Healthcare, BY Type (USD Billion)
      1. Trauma Related Avascular Necrosis (AVN)
      2. Non-Trauma Related Avascular Necrosis (AVN)
    7. Healthcare, BY Treatment (USD Billion)
      1. Nonsteroidal Anti-Inflammatory Drugs (NSAIDS)
      2. Cholesterol Lowing Drugs
      3. Osteoporosis Drugs
      4. Blood Thinners
      5. Others
    8. Healthcare, BY Diagnosis (USD Billion)
      1. Imaging
      2. Biopsy
      3. CT Scan
      4. PET
      5. X-Ray
    9. Healthcare, BY End User (USD Billion)
      1. Hospital Pharmacies
      2. Retail Pharmacies
      3. Online Pharmacies
    10. Healthcare, BY Region (USD Billion)
      1. North America
      2. Europe
      3. APAC
      4. South America
      5. MEA
    11. Competitive Landscape
      1. Overview
      2. Competitive Analysis
      3. Market share Analysis
      4. Major Growth Strategy in the Healthcare
      5. Competitive Benchmarking
      6. Leading Players in Terms of Number of Developments in the Healthcare
      7. Key developments and growth strategies
      8. Major Players Financial Matrix
    12. Company Profiles
      1. Bristol-Myers Squibb (US)
      2. Amgen (US)
      3. Novartis (CH)
      4. Pfizer (US)
      5. Eli Lilly and Company (US)
      6. Sanofi (FR)
      7. AstraZeneca (GB)
      8. Merck & Co. (US)
      9. Johnson & Johnson (US)
    13. Appendix
      1. References
      2. Related Reports 6 LIST OF FIGURES
    14. MARKET SYNOPSIS
    15. NORTH AMERICA MARKET ANALYSIS
    16. US MARKET ANALYSIS BY TYPE
    17. US MARKET ANALYSIS BY TREATMENT
    18. US MARKET ANALYSIS BY DIAGNOSIS
    19. US MARKET ANALYSIS BY END USER
    20. CANADA MARKET ANALYSIS BY TYPE
    21. CANADA MARKET ANALYSIS BY TREATMENT
    22. CANADA MARKET ANALYSIS BY DIAGNOSIS
    23. CANADA MARKET ANALYSIS BY END USER
    24. EUROPE MARKET ANALYSIS
    25. GERMANY MARKET ANALYSIS BY TYPE
    26. GERMANY MARKET ANALYSIS BY TREATMENT
    27. GERMANY MARKET ANALYSIS BY DIAGNOSIS
    28. GERMANY MARKET ANALYSIS BY END USER
    29. UK MARKET ANALYSIS BY TYPE
    30. UK MARKET ANALYSIS BY TREATMENT
    31. UK MARKET ANALYSIS BY DIAGNOSIS
    32. UK MARKET ANALYSIS BY END USER
    33. FRANCE MARKET ANALYSIS BY TYPE
    34. FRANCE MARKET ANALYSIS BY TREATMENT
    35. FRANCE MARKET ANALYSIS BY DIAGNOSIS
    36. FRANCE MARKET ANALYSIS BY END USER
    37. RUSSIA MARKET ANALYSIS BY TYPE
    38. RUSSIA MARKET ANALYSIS BY TREATMENT
    39. RUSSIA MARKET ANALYSIS BY DIAGNOSIS
    40. RUSSIA MARKET ANALYSIS BY END USER
    41. ITALY MARKET ANALYSIS BY TYPE
    42. ITALY MARKET ANALYSIS BY TREATMENT
    43. ITALY MARKET ANALYSIS BY DIAGNOSIS
    44. ITALY MARKET ANALYSIS BY END USER
    45. SPAIN MARKET ANALYSIS BY TYPE
    46. SPAIN MARKET ANALYSIS BY TREATMENT
    47. SPAIN MARKET ANALYSIS BY DIAGNOSIS
    48. SPAIN MARKET ANALYSIS BY END USER
    49. REST OF EUROPE MARKET ANALYSIS BY TYPE
    50. REST OF EUROPE MARKET ANALYSIS BY TREATMENT
    51. REST OF EUROPE MARKET ANALYSIS BY DIAGNOSIS
    52. REST OF EUROPE MARKET ANALYSIS BY END USER
    53. APAC MARKET ANALYSIS
    54. CHINA MARKET ANALYSIS BY TYPE
    55. CHINA MARKET ANALYSIS BY TREATMENT
    56. CHINA MARKET ANALYSIS BY DIAGNOSIS
    57. CHINA MARKET ANALYSIS BY END USER
    58. INDIA MARKET ANALYSIS BY TYPE
    59. INDIA MARKET ANALYSIS BY TREATMENT
    60. INDIA MARKET ANALYSIS BY DIAGNOSIS
    61. INDIA MARKET ANALYSIS BY END USER
    62. JAPAN MARKET ANALYSIS BY TYPE
    63. JAPAN MARKET ANALYSIS BY TREATMENT
    64. JAPAN MARKET ANALYSIS BY DIAGNOSIS
    65. JAPAN MARKET ANALYSIS BY END USER
    66. SOUTH KOREA MARKET ANALYSIS BY TYPE
    67. SOUTH KOREA MARKET ANALYSIS BY TREATMENT
    68. SOUTH KOREA MARKET ANALYSIS BY DIAGNOSIS
    69. SOUTH KOREA MARKET ANALYSIS BY END USER
    70. MALAYSIA MARKET ANALYSIS BY TYPE
    71. MALAYSIA MARKET ANALYSIS BY TREATMENT
    72. MALAYSIA MARKET ANALYSIS BY DIAGNOSIS
    73. MALAYSIA MARKET ANALYSIS BY END USER
    74. THAILAND MARKET ANALYSIS BY TYPE
    75. THAILAND MARKET ANALYSIS BY TREATMENT
    76. THAILAND MARKET ANALYSIS BY DIAGNOSIS
    77. THAILAND MARKET ANALYSIS BY END USER
    78. INDONESIA MARKET ANALYSIS BY TYPE
    79. INDONESIA MARKET ANALYSIS BY TREATMENT
    80. INDONESIA MARKET ANALYSIS BY DIAGNOSIS
    81. INDONESIA MARKET ANALYSIS BY END USER
    82. REST OF APAC MARKET ANALYSIS BY TYPE
    83. REST OF APAC MARKET ANALYSIS BY TREATMENT
    84. REST OF APAC MARKET ANALYSIS BY DIAGNOSIS
    85. REST OF APAC MARKET ANALYSIS BY END USER
    86. SOUTH AMERICA MARKET ANALYSIS
    87. BRAZIL MARKET ANALYSIS BY TYPE
    88. BRAZIL MARKET ANALYSIS BY TREATMENT
    89. BRAZIL MARKET ANALYSIS BY DIAGNOSIS
    90. BRAZIL MARKET ANALYSIS BY END USER
    91. MEXICO MARKET ANALYSIS BY TYPE
    92. MEXICO MARKET ANALYSIS BY TREATMENT
    93. MEXICO MARKET ANALYSIS BY DIAGNOSIS
    94. MEXICO MARKET ANALYSIS BY END USER
    95. ARGENTINA MARKET ANALYSIS BY TYPE
    96. ARGENTINA MARKET ANALYSIS BY TREATMENT
    97. ARGENTINA MARKET ANALYSIS BY DIAGNOSIS
    98. ARGENTINA MARKET ANALYSIS BY END USER
    99. REST OF SOUTH AMERICA MARKET ANALYSIS BY TYPE
    100. REST OF SOUTH AMERICA MARKET ANALYSIS BY TREATMENT
    101. REST OF SOUTH AMERICA MARKET ANALYSIS BY DIAGNOSIS
    102. REST OF SOUTH AMERICA MARKET ANALYSIS BY END USER
    103. MEA MARKET ANALYSIS
    104. GCC COUNTRIES MARKET ANALYSIS BY TYPE
    105. GCC COUNTRIES MARKET ANALYSIS BY TREATMENT
    106. GCC COUNTRIES MARKET ANALYSIS BY DIAGNOSIS
    107. GCC COUNTRIES MARKET ANALYSIS BY END USER
    108. SOUTH AFRICA MARKET ANALYSIS BY TYPE
    109. SOUTH AFRICA MARKET ANALYSIS BY TREATMENT
    110. SOUTH AFRICA MARKET ANALYSIS BY DIAGNOSIS
    111. SOUTH AFRICA MARKET ANALYSIS BY END USER
    112. REST OF MEA MARKET ANALYSIS BY TYPE
    113. REST OF MEA MARKET ANALYSIS BY TREATMENT
    114. REST OF MEA MARKET ANALYSIS BY DIAGNOSIS
    115. REST OF MEA MARKET ANALYSIS BY END USER
    116. KEY BUYING CRITERIA OF HEALTHCARE
    117. RESEARCH PROCESS OF MRFR
    118. DRO ANALYSIS OF HEALTHCARE
    119. DRIVERS IMPACT ANALYSIS: HEALTHCARE
    120. RESTRAINTS IMPACT ANALYSIS: HEALTHCARE
    121. SUPPLY / VALUE CHAIN: HEALTHCARE
    122. HEALTHCARE, BY TYPE, 2024 (% SHARE)
    123. HEALTHCARE, BY TYPE, 2024 TO 2035 (USD Billion)
    124. HEALTHCARE, BY TREATMENT, 2024 (% SHARE)
    125. HEALTHCARE, BY TREATMENT, 2024 TO 2035 (USD Billion)
    126. HEALTHCARE, BY DIAGNOSIS, 2024 (% SHARE)
    127. HEALTHCARE, BY DIAGNOSIS, 2024 TO 2035 (USD Billion)
    128. HEALTHCARE, BY END USER, 2024 (% SHARE)
    129. HEALTHCARE, BY END USER, 2024 TO 2035 (USD Billion)
    130. BENCHMARKING OF MAJOR COMPETITORS 7 LIST OF TABLES
    131. LIST OF ASSUMPTIONS
    132. North America MARKET SIZE ESTIMATES; FORECAST
      1. BY TYPE, 2025-2035 (USD Billion)
      2. BY TREATMENT, 2025-2035 (USD Billion)
      3. BY DIAGNOSIS, 2025-2035 (USD Billion)
      4. BY END USER, 2025-2035 (USD Billion)
    133. US MARKET SIZE ESTIMATES; FORECAST
      1. BY TYPE, 2025-2035 (USD Billion)
      2. BY TREATMENT, 2025-2035 (USD Billion)
      3. BY DIAGNOSIS, 2025-2035 (USD Billion)
      4. BY END USER, 2025-2035 (USD Billion)
    134. Canada MARKET SIZE ESTIMATES; FORECAST
      1. BY TYPE, 2025-2035 (USD Billion)
      2. BY TREATMENT, 2025-2035 (USD Billion)
      3. BY DIAGNOSIS, 2025-2035 (USD Billion)
      4. BY END USER, 2025-2035 (USD Billion)
    135. Europe MARKET SIZE ESTIMATES; FORECAST
      1. BY TYPE, 2025-2035 (USD Billion)
      2. BY TREATMENT, 2025-2035 (USD Billion)
      3. BY DIAGNOSIS, 2025-2035 (USD Billion)
      4. BY END USER, 2025-2035 (USD Billion)
    136. Germany MARKET SIZE ESTIMATES; FORECAST
      1. BY TYPE, 2025-2035 (USD Billion)
      2. BY TREATMENT, 2025-2035 (USD Billion)
      3. BY DIAGNOSIS, 2025-2035 (USD Billion)
      4. BY END USER, 2025-2035 (USD Billion)
    137. UK MARKET SIZE ESTIMATES; FORECAST
      1. BY TYPE, 2025-2035 (USD Billion)
      2. BY TREATMENT, 2025-2035 (USD Billion)
      3. BY DIAGNOSIS, 2025-2035 (USD Billion)
      4. BY END USER, 2025-2035 (USD Billion)
    138. France MARKET SIZE ESTIMATES; FORECAST
      1. BY TYPE, 2025-2035 (USD Billion)
      2. BY TREATMENT, 2025-2035 (USD Billion)
      3. BY DIAGNOSIS, 2025-2035 (USD Billion)
      4. BY END USER, 2025-2035 (USD Billion)
    139. Russia MARKET SIZE ESTIMATES; FORECAST
      1. BY TYPE, 2025-2035 (USD Billion)
      2. BY TREATMENT, 2025-2035 (USD Billion)
      3. BY DIAGNOSIS, 2025-2035 (USD Billion)
      4. BY END USER, 2025-2035 (USD Billion)
    140. Italy MARKET SIZE ESTIMATES; FORECAST
      1. BY TYPE, 2025-2035 (USD Billion)
      2. BY TREATMENT, 2025-2035 (USD Billion)
      3. BY DIAGNOSIS, 2025-2035 (USD Billion)
      4. BY END USER, 2025-2035 (USD Billion)
    141. Spain MARKET SIZE ESTIMATES; FORECAST
      1. BY TYPE, 2025-2035 (USD Billion)
      2. BY TREATMENT, 2025-2035 (USD Billion)
      3. BY DIAGNOSIS, 2025-2035 (USD Billion)
      4. BY END USER, 2025-2035 (USD Billion)
    142. Rest of Europe MARKET SIZE ESTIMATES; FORECAST
      1. BY TYPE, 2025-2035 (USD Billion)
      2. BY TREATMENT, 2025-2035 (USD Billion)
      3. BY DIAGNOSIS, 2025-2035 (USD Billion)
      4. BY END USER, 2025-2035 (USD Billion)
    143. APAC MARKET SIZE ESTIMATES; FORECAST
      1. BY TYPE, 2025-2035 (USD Billion)
      2. BY TREATMENT, 2025-2035 (USD Billion)
      3. BY DIAGNOSIS, 2025-2035 (USD Billion)
      4. BY END USER, 2025-2035 (USD Billion)
    144. China MARKET SIZE ESTIMATES; FORECAST
      1. BY TYPE, 2025-2035 (USD Billion)
      2. BY TREATMENT, 2025-2035 (USD Billion)
      3. BY DIAGNOSIS, 2025-2035 (USD Billion)
      4. BY END USER, 2025-2035 (USD Billion)
    145. India MARKET SIZE ESTIMATES; FORECAST
      1. BY TYPE, 2025-2035 (USD Billion)
      2. BY TREATMENT, 2025-2035 (USD Billion)
      3. BY DIAGNOSIS, 2025-2035 (USD Billion)
      4. BY END USER, 2025-2035 (USD Billion)
    146. Japan MARKET SIZE ESTIMATES; FORECAST
      1. BY TYPE, 2025-2035 (USD Billion)
      2. BY TREATMENT, 2025-2035 (USD Billion)
      3. BY DIAGNOSIS, 2025-2035 (USD Billion)
      4. BY END USER, 2025-2035 (USD Billion)
    147. South Korea MARKET SIZE ESTIMATES; FORECAST
      1. BY TYPE, 2025-2035 (USD Billion)
      2. BY TREATMENT, 2025-2035 (USD Billion)
      3. BY DIAGNOSIS, 2025-2035 (USD Billion)
      4. BY END USER, 2025-2035 (USD Billion)
    148. Malaysia MARKET SIZE ESTIMATES; FORECAST
      1. BY TYPE, 2025-2035 (USD Billion)
      2. BY TREATMENT, 2025-2035 (USD Billion)
      3. BY DIAGNOSIS, 2025-2035 (USD Billion)
      4. BY END USER, 2025-2035 (USD Billion)
    149. Thailand MARKET SIZE ESTIMATES; FORECAST
      1. BY TYPE, 2025-2035 (USD Billion)
      2. BY TREATMENT, 2025-2035 (USD Billion)
      3. BY DIAGNOSIS, 2025-2035 (USD Billion)
      4. BY END USER, 2025-2035 (USD Billion)
    150. Indonesia MARKET SIZE ESTIMATES; FORECAST
      1. BY TYPE, 2025-2035 (USD Billion)
      2. BY TREATMENT, 2025-2035 (USD Billion)
      3. BY DIAGNOSIS, 2025-2035 (USD Billion)
      4. BY END USER, 2025-2035 (USD Billion)
    151. Rest of APAC MARKET SIZE ESTIMATES; FORECAST
      1. BY TYPE, 2025-2035 (USD Billion)
      2. BY TREATMENT, 2025-2035 (USD Billion)
      3. BY DIAGNOSIS, 2025-2035 (USD Billion)
      4. BY END USER, 2025-2035 (USD Billion)
    152. South America MARKET SIZE ESTIMATES; FORECAST
      1. BY TYPE, 2025-2035 (USD Billion)
      2. BY TREATMENT, 2025-2035 (USD Billion)
      3. BY DIAGNOSIS, 2025-2035 (USD Billion)
      4. BY END USER, 2025-2035 (USD Billion)
    153. Brazil MARKET SIZE ESTIMATES; FORECAST
      1. BY TYPE, 2025-2035 (USD Billion)
      2. BY TREATMENT, 2025-2035 (USD Billion)
      3. BY DIAGNOSIS, 2025-2035 (USD Billion)
      4. BY END USER, 2025-2035 (USD Billion)
    154. Mexico MARKET SIZE ESTIMATES; FORECAST
      1. BY TYPE, 2025-2035 (USD Billion)
      2. BY TREATMENT, 2025-2035 (USD Billion)
      3. BY DIAGNOSIS, 2025-2035 (USD Billion)
      4. BY END USER, 2025-2035 (USD Billion)
    155. Argentina MARKET SIZE ESTIMATES; FORECAST
      1. BY TYPE, 2025-2035 (USD Billion)
      2. BY TREATMENT, 2025-2035 (USD Billion)
      3. BY DIAGNOSIS, 2025-2035 (USD Billion)
      4. BY END USER, 2025-2035 (USD Billion)
    156. Rest of South America MARKET SIZE ESTIMATES; FORECAST
      1. BY TYPE, 2025-2035 (USD Billion)
      2. BY TREATMENT, 2025-2035 (USD Billion)
      3. BY DIAGNOSIS, 2025-2035 (USD Billion)
      4. BY END USER, 2025-2035 (USD Billion)
    157. MEA MARKET SIZE ESTIMATES; FORECAST
      1. BY TYPE, 2025-2035 (USD Billion)
      2. BY TREATMENT, 2025-2035 (USD Billion)
      3. BY DIAGNOSIS, 2025-2035 (USD Billion)
      4. BY END USER, 2025-2035 (USD Billion)
    158. GCC Countries MARKET SIZE ESTIMATES; FORECAST
      1. BY TYPE, 2025-2035 (USD Billion)
      2. BY TREATMENT, 2025-2035 (USD Billion)
      3. BY DIAGNOSIS, 2025-2035 (USD Billion)
      4. BY END USER, 2025-2035 (USD Billion)
    159. South Africa MARKET SIZE ESTIMATES; FORECAST
      1. BY TYPE, 2025-2035 (USD Billion)
      2. BY TREATMENT, 2025-2035 (USD Billion)
      3. BY DIAGNOSIS, 2025-2035 (USD Billion)
      4. BY END USER, 2025-2035 (USD Billion)
    160. Rest of MEA MARKET SIZE ESTIMATES; FORECAST
      1. BY TYPE, 2025-2035 (USD Billion)
      2. BY TREATMENT, 2025-2035 (USD Billion)
      3. BY DIAGNOSIS, 2025-2035 (USD Billion)
      4. BY END USER, 2025-2035 (USD Billion)
    161. PRODUCT LAUNCH/PRODUCT DEVELOPMENT/APPROVAL
    162. ACQUISITION/PARTNERSHIP

Avascular Necrosis Market Segmentation

Avascular Necrosis Products Type Outlook (USD Billion, 2018-2032)

Trauma Related Avascular Necrosis (AVN)

Non-Trauma Related Avascular Necrosis (AVN)

Avascular Necrosis Treatment Outlook (USD Billion, 2018-2032)

Nonsteroidal Anti-Inflammatory Drugs (NSAIDS)

Cholesterol Lowing Drugs

Osteoporosis Drugs

Blood Thinners

Others

Avascular Necrosis Diagnosis Outlook (USD Billion, 2018-2032)

Imaging

Biopsy

CT Scan

PET

X- Ray

Avascular Necrosis End user Outlook (USD Billion, 2018-2032)

Hospital Pharmacies

Retail Pharmacies

Online Pharmacies

Avascular Necrosis Products Regional Outlook (USD Billion, 2018-2032)

North America Outlook (USD Billion, 2018-2032)

North America Avascular Necrosis Products by Type

Trauma Related Avascular Necrosis (AVN)

Non-Trauma Related Avascular Necrosis (AVN)

North America Avascular Necrosis by Treatment

Nonsteroidal Anti-Inflammatory Drugs (NSAIDS)

Cholesterol Lowing Drugs

Osteoporosis Drugs

Blood Thinners

Others

North America Avascular Necrosis by Diagnosis

Imaging

Biopsy

CT Scan

PET

X- Ray

North America Avascular Necrosis by End user

Hospital Pharmacies

Retail Pharmacies

Online Pharmacies

US Outlook (USD Billion, 2018-2032)

US Avascular Necrosis Products by Type

Trauma Related Avascular Necrosis (AVN)

Non-Trauma Related Avascular Necrosis (AVN)

US Avascular Necrosis by Treatment

Nonsteroidal Anti-Inflammatory Drugs (NSAIDS)

Cholesterol Lowing Drugs

Osteoporosis Drugs

Blood Thinners

Others

US Avascular Necrosis by Diagnosis

Imaging

Biopsy

CT Scan

PET

X- Ray

US Avascular Necrosis by End user

Hospital Pharmacies

Retail Pharmacies

Online Pharmacies
CANADA Outlook (USD Billion, 2018-2032)

CANADA Avascular Necrosis Products by Type

Trauma Related Avascular Necrosis (AVN)

Non-Trauma Related Avascular Necrosis (AVN)

CANADA Avascular Necrosis by Treatment

Nonsteroidal Anti-Inflammatory Drugs (NSAIDS)

Cholesterol Lowing Drugs

Osteoporosis Drugs

Blood Thinners

Others

CANADA Avascular Necrosis by Diagnosis

Imaging

Biopsy

CT Scan

PET

X- Ray

CANADA Avascular Necrosis by End user

Hospital Pharmacies

Retail Pharmacies

Online Pharmacies

Europe Outlook (USD Billion, 2018-2032)

Europe Avascular Necrosis Products by Type

Trauma Related Avascular Necrosis (AVN)

Non-Trauma Related Avascular Necrosis (AVN)

Europe Avascular Necrosis by Treatment

Nonsteroidal Anti-Inflammatory Drugs (NSAIDS)

Cholesterol Lowing Drugs

Osteoporosis Drugs

Blood Thinners

Others

Europe Avascular Necrosis by Diagnosis

Imaging

Biopsy

CT Scan

PET

X- Ray

Europe Avascular Necrosis by End user

Hospital Pharmacies

Retail Pharmacies

Online Pharmacies

Germany Outlook (USD Billion, 2018-2032)

Germany Avascular Necrosis Products by Type

Trauma Related Avascular Necrosis (AVN)

Non-Trauma Related Avascular Necrosis (AVN)

Germany Avascular Necrosis by Treatment

Nonsteroidal Anti-Inflammatory Drugs (NSAIDS)

Cholesterol Lowing Drugs

Osteoporosis Drugs

Blood Thinners

Others

Germany Avascular Necrosis by Diagnosis

Imaging

Biopsy

CT Scan

PET

X- Ray

Germany Avascular Necrosis by End user

Hospital Pharmacies

Retail Pharmacies

Online Pharmacies
France Outlook (USD Billion, 2018-2032)

France Avascular Necrosis Products by Type

Trauma Related Avascular Necrosis (AVN)

Non-Trauma Related Avascular Necrosis (AVN)

France Avascular Necrosis by Treatment

Nonsteroidal Anti-Inflammatory Drugs (NSAIDS)

Cholesterol Lowing Drugs

Osteoporosis Drugs

Blood Thinners

Others

France Avascular Necrosis by Diagnosis

Imaging

Biopsy

CT Scan

PET

X- Ray

France Avascular Necrosis by End user

Hospital Pharmacies

Retail Pharmacies

Online Pharmacies

UK Outlook (USD Billion, 2018-2032)

UK Avascular Necrosis Products by Type

Trauma Related Avascular Necrosis (AVN)

Non-Trauma Related Avascular Necrosis (AVN)

UK Avascular Necrosis by Treatment

Nonsteroidal Anti-Inflammatory Drugs (NSAIDS)

Cholesterol Lowing Drugs

Osteoporosis Drugs

Blood Thinners

Others

UK Avascular Necrosis by Diagnosis

Imaging

Biopsy

CT Scan

PET

X- Ray

UK Avascular Necrosis by End user

Hospital Pharmacies

Retail Pharmacies

Online Pharmacies

ITALY Outlook (USD Billion, 2018-2032)

ITALY Avascular Necrosis Products by Type

Trauma Related Avascular Necrosis (AVN)

Non-Trauma Related Avascular Necrosis (AVN)

ITALY Avascular Necrosis by Treatment

Nonsteroidal Anti-Inflammatory Drugs (NSAIDS)

Cholesterol Lowing Drugs

Osteoporosis Drugs

Blood Thinners

Others

ITALY Avascular Necrosis by Diagnosis

Imaging

Biopsy

CT Scan

PET

X- Ray

ITALY Avascular Necrosis by End user

Hospital Pharmacies

Retail Pharmacies

Online Pharmacies

SPAIN Outlook (USD Billion, 2018-2032)

Spain Avascular Necrosis Products by Type

Trauma Related Avascular Necrosis (AVN)

Non-Trauma Related Avascular Necrosis (AVN)

Spain Avascular Necrosis by Treatment

Nonsteroidal Anti-Inflammatory Drugs (NSAIDS)

Cholesterol Lowing Drugs

Osteoporosis Drugs

Blood Thinners

Others

Spain Avascular Necrosis by Diagnosis

Imaging

Biopsy

CT Scan

PET

X- Ray

Spain Avascular Necrosis by End user

Hospital Pharmacies

Retail Pharmacies

Online Pharmacies

Rest Of Europe Outlook (USD Billion, 2018-2032)

Rest Of Europe Avascular Necrosis Products by Type

Trauma Related Avascular Necrosis (AVN)

Non-Trauma Related Avascular Necrosis (AVN)

Rest Of Europe Avascular Necrosis by Treatment

Nonsteroidal Anti-Inflammatory Drugs (NSAIDS)

Cholesterol Lowing Drugs

Osteoporosis Drugs

Blood Thinners

Others

Rest Of Europe Avascular Necrosis by Diagnosis

Imaging

Biopsy

CT Scan

PET

X- Ray

Rest Of Europe Avascular Necrosis by End user

Hospital Pharmacies

Retail Pharmacies

Online Pharmacies

Asia-Pacific Outlook (USD Billion, 2018-2032)

Asia-Pacific Avascular Necrosis Products by Type

Trauma Related Avascular Necrosis (AVN)

Non-Trauma Related Avascular Necrosis (AVN)

Asia-Pacific Avascular Necrosis by Treatment

Nonsteroidal Anti-Inflammatory Drugs (NSAIDS)

Cholesterol Lowing Drugs

Osteoporosis Drugs

Blood Thinners

Others

Asia-Pacific Avascular Necrosis by Diagnosis

Imaging

Biopsy

CT Scan

PET

X- Ray

Asia-Pacific Avascular Necrosis by End user

Hospital Pharmacies

Retail Pharmacies

Online Pharmacies

China Outlook (USD Billion, 2018-2032)

China Avascular Necrosis Products by Type

Trauma Related Avascular Necrosis (AVN)

Non-Trauma Related Avascular Necrosis (AVN)

China Avascular Necrosis by Treatment

Nonsteroidal Anti-Inflammatory Drugs (NSAIDS)

Cholesterol Lowing Drugs

Osteoporosis Drugs

Blood Thinners

Others

China Avascular Necrosis by Diagnosis

Imaging

Biopsy

CT Scan

PET

X- Ray

China Avascular Necrosis by End user

Hospital Pharmacies

Retail Pharmacies

Online Pharmacies

Japan Outlook (USD Billion, 2018-2032)

Japan Avascular Necrosis Products by Type

Trauma Related Avascular Necrosis (AVN)

Non-Trauma Related Avascular Necrosis (AVN)

Japan Avascular Necrosis by Treatment

Nonsteroidal Anti-Inflammatory Drugs (NSAIDS)

Cholesterol Lowing Drugs

Osteoporosis Drugs

Blood Thinners

Others

Japan Avascular Necrosis by Diagnosis

Imaging

Biopsy

CT Scan

PET

X- Ray

Japan Avascular Necrosis by End user

Hospital Pharmacies

Retail Pharmacies

Online Pharmacies

India Outlook (USD Billion, 2018-2032)

India Avascular Necrosis Products by Type

Trauma Related Avascular Necrosis (AVN)

Non-Trauma Related Avascular Necrosis (AVN)

India Avascular Necrosis by Treatment

Nonsteroidal Anti-Inflammatory Drugs (NSAIDS)

Cholesterol Lowing Drugs

Osteoporosis Drugs

Blood Thinners

Others

India Avascular Necrosis by Diagnosis

Imaging

Biopsy

CT Scan

PET

X- Ray

India Avascular Necrosis by End user

Hospital Pharmacies

Retail Pharmacies

Online Pharmacies

Australia Outlook (USD Billion, 2018-2032)

Australia Avascular Necrosis Products by Type

Trauma Related Avascular Necrosis (AVN)

Non-Trauma Related Avascular Necrosis (AVN)

Australia Avascular Necrosis by Treatment

Nonsteroidal Anti-Inflammatory Drugs (NSAIDS)

Cholesterol Lowing Drugs

Osteoporosis Drugs

Blood Thinners

Others

Australia Avascular Necrosis by Diagnosis

Imaging

Biopsy

CT Scan

PET

X- Ray

Australia Avascular Necrosis by End user

Hospital Pharmacies

Retail Pharmacies

Online Pharmacies

Rest of Asia-Pacific Outlook (USD Billion, 2018-2032)

Rest of Asia-Pacific Avascular Necrosis Products by Type

Trauma Related Avascular Necrosis (AVN)

Non-Trauma Related Avascular Necrosis (AVN)

Rest of Asia-Pacific Avascular Necrosis by Treatment

Nonsteroidal Anti-Inflammatory Drugs (NSAIDS)

Cholesterol Lowing Drugs

Osteoporosis Drugs

Blood Thinners

Others

Rest of Asia-Pacific Avascular Necrosis by Diagnosis

Imaging

Biopsy

CT Scan

PET

X- Ray

Rest of Asia-Pacific Avascular Necrosis by End user

Hospital Pharmacies

Retail Pharmacies

Online Pharmacies

Rest of the World Outlook (USD Billion, 2018-2032)

Rest of the World Avascular Necrosis Products by Type

Trauma Related Avascular Necrosis (AVN)

Non-Trauma Related Avascular Necrosis (AVN)

Rest of the World Avascular Necrosis by Treatment

Nonsteroidal Anti-Inflammatory Drugs (NSAIDS)

Cholesterol Lowing Drugs

Osteoporosis Drugs

Blood Thinners

Others

Rest of the World Avascular Necrosis by Diagnosis

Imaging

Biopsy

CT Scan

PET

X- Ray

Rest of the World Avascular Necrosis by End user

Hospital Pharmacies

Retail Pharmacies

Online Pharmacies

Middle East Outlook (USD Billion, 2018-2032)

Middle East Avascular Necrosis Products by Type

Trauma Related Avascular Necrosis (AVN)

Non-Trauma Related Avascular Necrosis (AVN)

Middle East Avascular Necrosis by Treatment

Nonsteroidal Anti-Inflammatory Drugs (NSAIDS)

Cholesterol Lowing Drugs

Osteoporosis Drugs

Blood Thinners

Others

Middle East Avascular Necrosis by Diagnosis

Imaging

Biopsy

CT Scan

PET

X- Ray

Middle East Avascular Necrosis by End user

Hospital Pharmacies

Retail Pharmacies

Online Pharmacies

Africa Outlook (USD Billion, 2018-2032)

Africa Avascular Necrosis Products by Type

Trauma Related Avascular Necrosis (AVN)

Non-Trauma Related Avascular Necrosis (AVN)

Africa Avascular Necrosis by Treatment

Nonsteroidal Anti-Inflammatory Drugs (NSAIDS)

Cholesterol Lowing Drugs

Osteoporosis Drugs

Blood Thinners

Others

Africa Avascular Necrosis by Diagnosis

Imaging

Biopsy

CT Scan

PET

X- Ray

Africa Avascular Necrosis by End user

Hospital Pharmacies

Retail Pharmacies

Online Pharmacies

Latin America Outlook (USD Billion, 2018-2032)

Latin America Avascular Necrosis Products by Type

Trauma Related Avascular Necrosis (AVN)

Non-Trauma Related Avascular Necrosis (AVN)

Latin America Avascular Necrosis by Treatment

Nonsteroidal Anti-Inflammatory Drugs (NSAIDS)

Cholesterol Lowing Drugs

Osteoporosis Drugs

Blood Thinners

Others

Latin America Avascular Necrosis by Diagnosis

Imaging

Biopsy

CT Scan

PET

X- Ray

Latin America Avascular Necrosis by End user

Hospital Pharmacies

Retail Pharmacies

Online Pharmacies

Infographic

Free Sample Request

Kindly complete the form below to receive a free sample of this Report

Get Free Sample

Customer Strories

“I am very pleased with how market segments have been defined in a relevant way for my purposes (such as "Portable Freezers & refrigerators" and "last-mile"). In general the report is well structured. Thanks very much for your efforts.”

Victoria Milne

Founder

Compare Licence

×
Features License Type
Single User Multiuser License Enterprise User
Price $4,950 $5,950 $7,250
Maximum User Access Limit 1 User Upto 10 Users Unrestricted Access Throughout the Organization
Free Customization
Direct Access to Analyst
Deliverable Format
Platform Access
Discount on Next Purchase 10% 15% 15%
Printable Versions