Request Free Sample ×

Kindly complete the form below to receive a free sample of this Report

* Please use a valid business email

Leading companies partner with us for data-driven Insights

clients tt-cursor
Hero Background

Beer Market

ID: MRFR/FnB/1116-CR
128 Pages
Varsha More
Last Updated: June 01, 2026
Beer Market Size, Share, Industry Trend & Analysis Research Report By Product Type (Ale, Lager, Non/Low-Alcohol Beer, Other Beer Types), By Category (Standard, Premium), By Packaging Type (Bottles, Cans, Others), By Distribution Channel (On-Trade, Off-Trade), By Geography (North America, Europe, Asia-Pacific, South America, Middle East & Africa) - Forecast to 2035
Download PDF ×

We do not share your information with anyone. However, we may send you emails based on your report interest from time to time. You may contact us at any time to opt-out.


Beer Market Summary

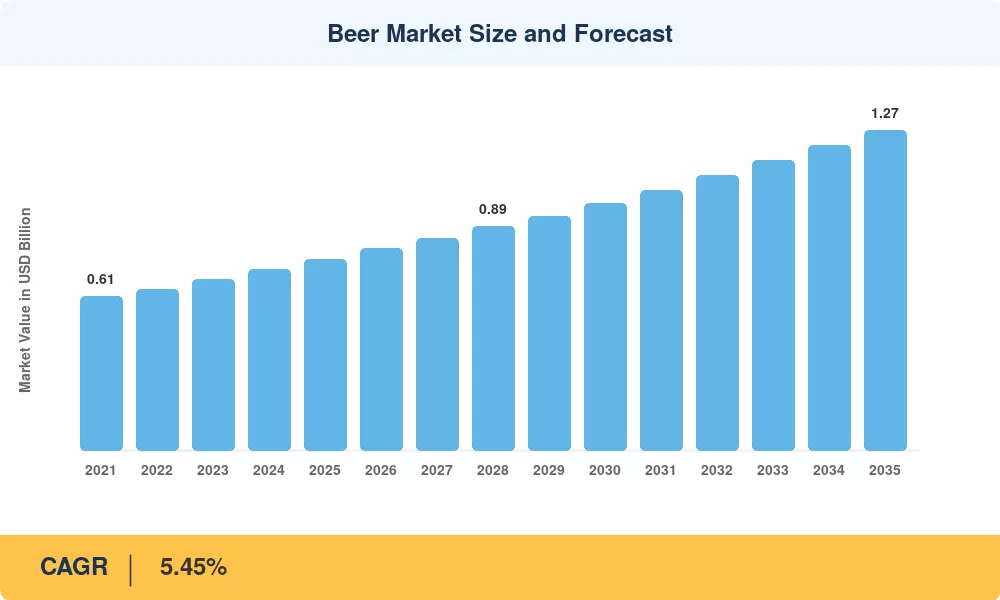
The global Beer Market reached USD 0.76 trillion in 2025 and is positioned to start the forecast at USD 0.80 trillion in 2026, climbing to USD 1.27 trillion by 2035 at a 5.45% CAGR. Two catalysts anchor this trajectory: roughly USD 14 billion in announced brewery capex between 2024 and 2027 across Asia-Pacific and Latin America, and the European Union's revised Packaging and Packaging Waste Regulation, which is reshaping beer packaging sustainability requirements for every major exporter [1][2]. The Beer Market sits at the intersection of cultural consumption habits and rapid portfolio reinvention.

Brewing operations are undergoing a quiet but decisive technology shift. Legacy gravity-fed brewhouses and manual quality lines are giving way to AI-assisted fermentation control, IoT-enabled cold-chain monitoring, and aluminum can lines that replace heavier glass bottling. Heineken alone has committed roughly USD 3.7 billion through 2030 to digitize breweries and decarbonize its packaging mix [3], signaling how operational modernization is now inseparable from category growth.

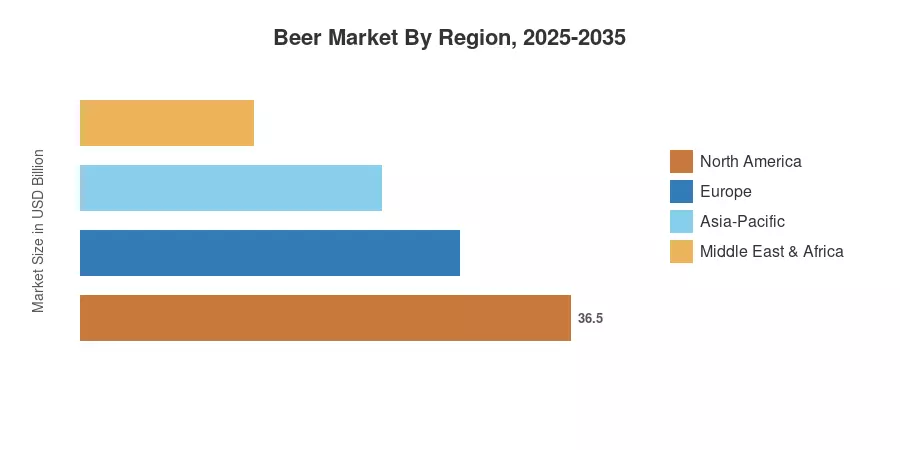
Asia-Pacific commands 32.8% of global revenue in 2025 and remains the fastest-growing region at a 5.77% CAGR, propelled by premiumization in China and Vietnam. Europe follows as the second-largest region, anchored by Germany, the UK, and a maturing low-alcohol beer innovation cluster. The decade ahead will reward brewers who combine cultural fluency with disciplined capital allocation.

Key Report Takeaways

• By Product Type

  • Lager dominated the Beer Market in 2025 with an 81.4% volume share, supported by mainstream pricing and deep distribution
  • Non/low-alcohol beer is poised for the fastest growth at a 5.62% CAGR through 2035, driven by Gen-Z moderation behavior

• By Category

  • Premium beer is set to expand at a 5.78% CAGR, outpacing the standard segment in the Beer Market
  • The standard segment retains dominance but is structurally ceding share.


• By Packaging

  • Cans will record a 5.92% CAGR, the fastest packaging format, reflecting beer packaging sustainability priorities


• By Distribution

  • Off-trade channels are projected to grow at a 5.39% CAGR, lifted by at-home consumption
  • On-trade venues retain a revenue edge due to higher per-unit pricing


• By Region

  • Asia-Pacific holds 32.8% of 2025 revenue in the Beer Market, while South America emerges as a secondary growth engine

Market Size and Forecast (2021–2035)

Market sizing combines brewery production volumes from national statistical agencies, customs trade flows, retail audits from Nielsen and IRI, and primary interviews with brewery procurement teams across 22 countries. Historical revenues are reconciled to USD using period-average exchange rates.

Beer Market Size and Forecast
Our Impact
Enabled $4.3B Revenue Impact for Fortune 500 and Leading Multinationals
Partnering with 2000+ Global Organizations Each Year
30K+ Citations by Top-Tier Firms in the Industry
 

Driver Impact Analysis

Driver ~% Impact on CAGR Geographic Relevance Impact Timeline
Premiumization of the craft versus the premium beer mix +1.4% Global Medium-term
Low-alcohol beer innovation and NoLo portfolios +1.1% Europe, North America Long-term
Asia-Pacific urbanization and disposable income +1.3% APAC Long-term
Beer packaging sustainability investment +0.6% EU, North America Medium-term
Direct-to-retailer digital channels +0.5% Global Short-term
Female and Gen-Z drinker recruitment +0.7% Global Medium-term
Regenerative agriculture barley sourcing +0.3% Europe, North America Long-term


Premiumization and the Craft Versus Premium Beer Shift

According to IWSR statistics [7], consumers are willing to pay 22–28% more per liter for super-premium lagers and craft-leaning varieties than they were in 2019, making premiumization the single most significant lever. Multinationals like AB InBev and Asahi now run "above-premium" portfolios that incorporate both craft authenticity and global scale, so the craft versus premium beer dynamic is no longer a binary. In developed markets where volume is flat but value compounds, this dynamic determines trends in beer consumption.


Low-Alcohol Beer Innovation

Heineken 0.0, Guinness 0.0, and Athletic Brewing have collectively triggered a NoLo wave that the IWSR projects will reach 4% of total beer volumes by 2028, up from 2.3% in 2024 [8]. Low-alcohol beer innovation is being supported by tax differentials in Spain, Japan, and the UK, where reduced excise rates on sub-1.2% ABV products lower retail price thresholds and accelerate trial.

Asia-Pacific Urbanization

While premium SKUs are expanding at double-digit rates, China's per-capita beer consumption is stabilizing at 28 liters. Meanwhile, USDA FAS predicts that India's beer volumes will increase by 6.4% year through 2030 as state-level licensing changes increase retail access [9]. This growth corridor is extended to the Philippines and Vietnam.


Beer Packaging Sustainability

The EU PPWR mandates a 65% recycled-content threshold for aluminum packaging by 2030 and a 10% reuse target for beverage containers [10]. Brewers, including Carlsberg, are investing in fiber-based "Snap Pack" replacements and lightweight glass, with cumulative industry spend on beer packaging sustainability projected at USD 9.8 billion through 2030.


Restraints Impact Analysis

Restraint ~% Impact on CAGR Geographic Relevance Impact Timeline
Excise tax escalation and minimum unit pricing -0.9% UK, Nordics, India Medium-term
Health and wellness moderation trend -0.7% Global Long-term
Barley and aluminum input cost volatility -0.6% Global Short-term
Restrictions on alcohol advertising -0.4% EU, Asia Medium-term
GLP-1 weight-loss drug uptake impact on consumption -0.3% North America Long-term


Excise Tax Escalation

Scotland raised minimum unit pricing to GBP 0.65 per unit in September 2024, cutting beer sales volumes by 3.1% in the following two quarters [14]. Similar policies are under review in Ireland and parts of Australia, eroding margin headroom for the larger ale beer segment, most exposed to price-sensitive consumers.

Health and Wellness Moderation

Roughly 41% of US adults aged 21–34 now report deliberately reducing alcohol intake, per a 2024 Gallup poll [15]. This structural shift in beer consumption trends pressures full-strength volumes even as it expands the NoLo total addressable market, leaving the net category impact slightly negative for traditional SKUs.

Input Cost Volatility

European malting barley prices swung between EUR 230 and EUR 360 per tonne during 2022–2024, while aluminum LME prices hovered near USD 2,500/tonne [16]. Brewers without long-term hedges or vertical sourcing face compressed gross margins, particularly in independent craft segments.


Beer Market Opportunities

African Urban Brewery Buildouts

With per-capita consumption of less than 12 liters compared to a global mean of 27 liters, Nigeria, Kenya, and Ethiopia collectively constitute the largest unexplored beer pool outside of Asia [19]. Through 2027, Heineken and Castel plan to invest approximately USD 1.6 billion in greenfield breweries, opening durable beer consumption trends associated with a younger demographic


Premium Non-Alcoholic Craft

The intersection of craft versus premium beer and zero-alcohol formats is creating a USD 12 billion opportunity by 2030. Brands such as Lucky Saint and Brewdog AF demonstrate that low-alcohol beer innovation can command premium price points without cannibalizing core SKUs

Data-Monetized Direct-to-Consumer Platforms

Brewers are launching subscription clubs and loyalty apps that monetize consumption data. AB InBev's BEES platform processed USD 47 billion in B2B GMV in 2024 [11], pointing to a new revenue model layered on top of physical product sales.

Smart Packaging and Returnable Glass

Traceability and reuse loops are being made possible via QR-enabled labels and digital twins on returnable bottles. Investments in sustainable beer packaging are increasingly linked with customer involvement; in Germany, each returnable bottle cycles more than 40 times on average [10].


Latin America Premium Migration

Brazil and Mexico are seeing premium lager grow at 8–10% annually, even as standard volumes plateau. The craft versus premium beer migration in these markets will add roughly USD 18 billion in incremental annual revenue by 2032


Beer Market Future Outlook

AI-Driven Brewery Operations

Brewers are deploying machine-learning fermentation models that reduce batch variance by 18–22% and cut energy consumption per hectoliter by up to 9% [22]. AB InBev's "Beer Garage" reported USD 250 million in annualized savings from AI applications by 2024, and the IEA projects food and beverage AI adoption will lift sector productivity by 11% by 2030 [22].

Platform Economics in Beer Distribution

The shift to direct-to-retailer apps is restructuring beer distribution. BEES, eB2B, and similar platforms are expected to handle USD 110 billion in annual beer GMV by 2028, transforming brewers into data-rich consumer goods companies with platform-style margins.

Decarbonization and Renewable Brewing

The IRENA renewable industrial heat roadmap identifies brewing as a "fast-decarbonization" subsector, with biomass and heat-pump retrofits able to cut Scope 1 emissions 60% by 2032 [23]. Carlsberg and Heineken have committed to net-zero brewing operations by 2030 and 2040, respectively, embedding beer packaging sustainability and renewable energy procurement into capex planning.

Reshaped Consumer Cohorts

The next decade will see Gen-Z and Gen-Alpha drinkers reshape beer consumption trends fundamentally, with sober-curious behavior, flavor experimentation, and functional ingredients (adaptogens, electrolytes) crossing into beer adjacencies. McKinsey estimates 28% of beer volume by 2035 will fall into "next-generation" categories combining low ABV and functional positioning.


Beer Market Segmentation

By Product Type

Segment Metric Primary Demand Driver
Lager 81.4% share (2025) Mainstream distribution
Ale USD 92.4 B (2025) Craft growth
Non/Low-Alcohol 5.62% CAGR Moderation trend
Other Beer Types USD 18.7 B (2025) Sours, stouts, hybrids


Lager continues to anchor the Beer Market because of its broad palate appeal and efficient brewing economics, with the lager ale beer segment together representing more than 90% of total volume. The ale category, however, captures a disproportionate share of premium pricing — IPAs alone generated USD 38 billion in 2025 retail value globally.

Non/low-alcohol beer is the structural growth engine, with low-alcohol beer innovation pulling in adult consumers who previously left the category. Heineken 0.0 alone reached distribution in 117 markets by 2024 [8].

By Category

Segment Metric Primary Demand Driver
Standard 74.1% share (2025) Price accessibility
Premium 5.78% CAGR Trade-up behavior


The standard segment retains dominance but is structurally ceding share. Premium volumes are growing 2.6x faster than standard, with the craft versus premium beer dynamic most visible in China, the US, and Brazil

By Packaging Type

Segment Metric Primary Demand Driver
Bottles 51.2% share (2025) Reuse infrastructure
Cans 5.92% CAGR Convenience, recyclability
Others USD 24.3 B (2025) Kegs, draught


Cans are the fastest-growing format because of beer packaging sustainability metrics: aluminum's 75% recycled-content profile substantially reduces lifecycle emissions versus virgin glass.

By Distribution Channel

Segment Metric Primary Demand Driver
On-Trade 54.3% share (2025) Hospitality recovery
Off-Trade 5.39% CAGR At-home occasions


On-trade venues retain a revenue edge due to higher per-unit pricing, but off-trade is closing the gap as evolving beer consumption trends favor at-home occasions, especially among consumers aged 35+ [12].


Regional Market Share Analysis

Region 2025 Metric Primary Investment Themes
North America 24.6% share Premium imports, NoLo
Europe 27.1% share Sustainability, craft
Asia-Pacific 32.8% share Premiumization, capacity
South America 9.7% share Affordable premium
Middle East & Africa 5.8% share Greenfield breweries
Total 100.0%


North America

Country Metric Key Driver
US USD 138.5 B (2025) Mexican import surge
Canada 5.1% CAGR Craft consolidation
Mexico 7.8% share of the region Export-led premium


US import beer, led by Constellation Brands' Modelo and Corona, captured 18.4% of the domestic Beer Market in 2025, with Mexican-origin volumes growing 7.1% year over year [20]. Canadian craft brewers continue consolidating under provincial license caps, while Mexico's Yucatán and Coahuila brewing hubs are expanding export-grade capacity.

Europe

Country Metric Key Driver
Germany 18.2% share of the region Reinheitsgebot heritage
UK 4.9% CAGR NoLo leadership
France USD 14.8 B (2025) Premium imports
Italy 5.2% CAGR Craft renaissance
Spain USD 19.6 B (2025) Tourism on-trade
Nordic Countries 4.3% CAGR Sustainability adoption
Russia 11.4% share of the region Domestic large brewers
Rest of Europe 5.0% CAGR Eastern Europe lager


Germany's brewing sector remains anchored by 1,500+ regional breweries and the durability of the lager ale beer segment, while the UK leads Europe in low-alcohol beer innovation with NoLo penetration above 7% [8]. EU PPWR enforcement starting in 2026 will further reshape packaging economics.

Asia-Pacific

Country Metric Key Driver
China 38.4% share of the region Premium lager growth
India 7.9% CAGR Licensing reforms
Japan USD 27.5 B (2025) Happoshu and NoLo
South Korea 4.8% CAGR Imported craft demand
ASEAN USD 33.2 B (2025) Vietnam, Philippines
Rest of Asia-Pacific 5.6% CAGR Australia, NZ


China's CR Beer-Heineken alliance and Tsingtao's premium portfolio continue to dominate national beer consumption trends, while India's removal of state excise barriers in Maharashtra and Karnataka unlocked an estimated USD 1.9 billion in incremental retail revenue in 2024 [9].

South America

Country Metric Key Driver
Brazil 64.2% share of the region Ambev premium portfolio
Argentina 4.3% CAGR Quilmes expansion
Rest of South America USD 9.1 B (2025) Colombia, Chile


Brazil's premium beer volumes grew 9.8% in 2024, even as standard segments contracted, illustrating the craft versus premium beer divergence playing out across emerging markets [21].

Middle East & Africa

Country Metric Key Driver
Saudi Arabia USD 0.4 B (2025) NoLo-only market
UAE 6.7% CAGR Tourism and licensing
South Africa 28.6% share of the region SAB Heineken footprint
Egypt 5.8% CAGR Al Ahram dominance
Rest of MEA USD 16.4 B (2025) Nigeria, Kenya


Saudi Arabia's nascent NoLo segment, while small, is growing above 12% annually as the Kingdom liberalizes non-alcoholic beverage retail [19]. Sub-Saharan Africa remains the most strategically important greenfield opportunity for brewers globally.

Beer Market By Region, 2025-2035
 

Competitive Benchmarking

The global Beer Market is moderately concentrated, with the top five brewers controlling an estimated 56% of revenue and an HHI in the 1,150–1,300 range. Regional fragmentation persists in craft, where 11,000+ independent brewers operate in the US alone.

Company Est. Revenue Share Range Key Offerings Strategic Positioning
AB InBev ~22–25% Budweiser, Stella, Corona (ex-US), Michelob Ultra Global scale, BEES platform
Heineken N.V. ~10–13% Heineken, Amstel, Birra Moretti, Tiger NoLo leadership, sustainability
China Resources Beer ~6–9% Snow, Heineken (China), Amstel China premium pivot
Carlsberg Group ~5–7% Carlsberg, Tuborg, 1664 Blanc, Somersby Asia and CEE strength
Molson Coors ~4–6% Coors Light, Miller Lite, Blue Moon, Madri North America anchor
Asahi Group Holdings ~4–6% Asahi Super Dry, Peroni, Pilsner Urquell Premium global lager
Constellation Brands ~3–5% Modelo, Corona (US), Pacifico US import dominance
Kirin Holdings ~2–4% Kirin Ichiban, Lion Brands Japan, Oceania
Tsingtao Brewery ~2–4% Tsingtao, Laoshan China heritage
Diageo (Guinness) ~2–3% Guinness, Guinness 0.0 Stout and NoLo niche
Boston Beer Company ~1–2% Samuel Adams, Truly US craft pioneer
San Miguel Corporation ~1–2% San Miguel Pale Pilsen, Red Horse Philippines anchor


Recent News & Developments

  • AB InBev (March 2025): Announced USD 300 million expansion of its BEES B2B platform across Africa, processing 2.4 billion orders in 2024 [11].
  • Heineken (September 2024): Launched Heineken Silver in 12 additional markets, targeting younger drinkers with a lower-bitterness profile [3].
  • Carlsberg (June 2024): Closed GBP 3.3 billion acquisition of Britvic, integrating soft drinks for at-home occasions [25].
  • Asahi (November 2024): Acquired Octopi Brewing in Wisconsin to expand US craft contract brewing capacity [26].
  • Diageo (January 2025): Reported Guinness 0.0 grew 50%+ year over year, becoming the fastest-growing beer in the UK off-trade [8].
  • European Commission (April 2024): Finalized PPWR with 2030 reuse and recycled-content targets directly impacting bottle and can economics [10].
  • Constellation Brands (October 2024): Approved USD 4 billion capex through 2028 to expand Mexican brewing capacity in Veracruz [20].
  • Tsingtao (February 2025): Launched a "1903 Pure Draft" premium line targeting Chinese tier-1 city consumers [21].
 

Beer Market Report Scope

Parameter Detail
Market Scope Global Beer Market — lager, ale, non/low-alcohol, other beer types
Study Period 2021–2035
Base Year 2025
Forecast Period 2026–2035
CAGR 5.45%
Market Size (2025) USD 0.76 Trillion
Market Size (2035) USD 1.27 Trillion
Fastest Growing Segments Non/Low-Alcohol Beer, Cans, Premium
Companies Profiled AB InBev, Heineken, CRB, Carlsberg, Molson Coors, Asahi, Constellation, Kirin, Tsingtao, Diageo, Boston Beer, San Miguel
Valuation Currency USD


FAQs

How are private-equity investors approaching the Beer Market in 2025?

Private equity is concentrating on regional craft platforms and NoLo specialists, with 38 disclosed transactions in 2024 exceeding USD 50 million in deal value. The thesis hinges on margin expansion through shared distribution and contract brewing.

What contract terms should retail buyers negotiate with major brewers?

Buyers should prioritize escalator clauses tied to aluminum and barley indices rather than flat annual pricing, plus minimum service levels on cold-chain delivery [11]. Volume rebates are increasingly replaced by data-sharing commitments through B2B apps.

How does aluminum can sourcing in the Beer Market compare with glass?

Aluminum cans carry a 30–40% lower per-unit carbon footprint than virgin glass and are 45% lighter in freight terms [10]. Glass retains brand-equity advantages for premium SKUs but loses on logistics economics at scale.

What regulatory nuance separates Indian state markets in the Beer Market?

India's beer policy is state-administered, with Maharashtra and Karnataka operating relatively open licensing regimes while Tamil Nadu and Kerala route sales through state monopolies [9]. Brewers must plan SKU portfolios and pricing on a state-by-state basis.

How are GLP-1 weight-loss drugs affecting beer demand projections?

Early Morgan Stanley data suggests GLP-1 users reduce alcohol consumption by 14–18%, translating to a modest 30–50 basis-point CAGR headwind in the US through 2030 [18]. The impact is heaviest on standard lager volumes.

Which emerging use cases are reshaping the Beer Market beyond traditional retail?

Brewery-as-experience venues, festival activations, and ready-to-drink beer cocktails are creating high-margin adjacencies. Heineken and Diageo report experience-economy revenue growing 14% annually.

What integration challenges face brewers adopting AI brewery systems in the Beer Market?

Legacy SCADA architectures, fragmented sensor data, and skilled-operator shortages slow AI deployment, with a median project payback at 28 months [22]. Co-investment with technology vendors shortens timelines meaningfully.

Author
Author
Author Profile
Varsha More LinkedIn
Senior Research Analyst
Experienced business professional with a demonstrated history of working in the CFnB industry. Skilled in market research, and market estimation. Strong professional with a Masters focused in marketing management.

Research Approach


Secondary Research

The secondary research process involved comprehensive analysis of regulatory databases, trade publications, brewing industry journals, and authoritative government statistics. Key sources included the Alcohol and Tobacco Tax and Trade Bureau (TTB), U.S. Food & Drug Administration (FDA) for labeling standards, European Commission Directorate-General for Agriculture and Rural Development, HM Revenue & Customs (HMRC) UK alcohol statistics, Brewers Association (U.S.), Beer Institute (U.S.), The Brewers of Europe, China Alcoholic Drinks Association (CADA), Kirin Holdings Beer Reports, BarthHaas Hops and Beer Reports, National Institute on Alcohol Abuse and Alcoholism (NIAAA), World Health Organization (WHO) Global Alcohol Status Reports, OECD Alcohol Consumption Statistics, FAO (Food and Agriculture Organization) barley and hops production data, Eurostat agri-food trade databases, UN Comtrade import/export statistics, and national alcohol beverage control boards from key markets.

These sources were employed to gather production volume statistics, regulatory compliance data, excise tax frameworks, barley and hop cultivation trends, per capita consumption patterns, and market landscape analysis for macrobreweries, craft breweries, microbreweries, canned beer, bottled beer, and alcoholic and non-alcoholic variants.


Primary Research

Qualitative and quantitative insights were obtained by interviewing supply-side and demand-side stakeholders during the primary research process. Supply-side sources comprised Chief Executive Officers, Vice Presidents of Brewing Operations, Master Brewers, Heads of Sustainability, Chief Commercial Officers, and regulatory compliance heads from macrobreweries, craft breweries, microbreweries, malt suppliers, hop producers, and packaging manufacturers (specifically, aluminum can and glass bottle suppliers). Demand-side sources included on-premise venue owners (bars and restaurants), beverage directors for hospitality groups, category managers for supermarket and hypermarket chains, specialty beer retailer buyers, procurement leads for convenience store chains, and e-commerce platform directors who oversee alcohol delivery. The primary research validated market segmentation across packaging types (cans vs. bottles), confirmed product pipeline timelines for non-alcoholic and low-alcohol innovations, and gathered insights on distribution channel dynamics, pricing strategies, excise tax impacts, and regional consumption patterns.

Primary Respondent Breakdown:

By Designation: C-level Primaries (32%), Director Level (35%), Others (33%)

By Region: North America (32%), Europe (29%), Asia-Pacific (28%), Rest of World (11%)


Market Size Estimation

Revenue mapping and production volume analysis (measured in hectoliters) were employed to determine global market valuation. The methodology comprised the following:

Identification of over 50 significant brewery firms and independent operators in North America, Europe, Asia-Pacific, Latin America, and the Middle East and Africa

Product mapping is performed across a variety of packaging types (cans, bottles), categories (alcoholic, non-alcoholic), production types (macrobrewery, microbrewery, craft brewery), price segments (popular-priced, premium), and distribution channels (on-premises, off-premises, online).

Examination of annual revenues that are specific to alcohol portfolios, including excise tax-adjusted net sales, as reported and modeled

Coverage of manufacturers and brand owners that account for 75-80% of the global market share in 2024

Extrapolation is employed to generate segment-specific valuations, which are then cross-referenced with import/export trade data and barley/malt supply chain inputs. This is achieved by combining bottom-up (production volume × average selling price by country/segment) and top-down (manufacturer revenue validation) approaches.

Download Free Sample

Kindly complete the form below to receive a free sample of this Report