Segmentation Quick Reference
| Dimension | Sub-Segments | Dominant Segment | Fastest Growing Segment |
| By Product Type | Ale, Lager, Non/Low-Alcohol Beer, Other Beer Types | Lager | Non/Low-Alcohol Beer |
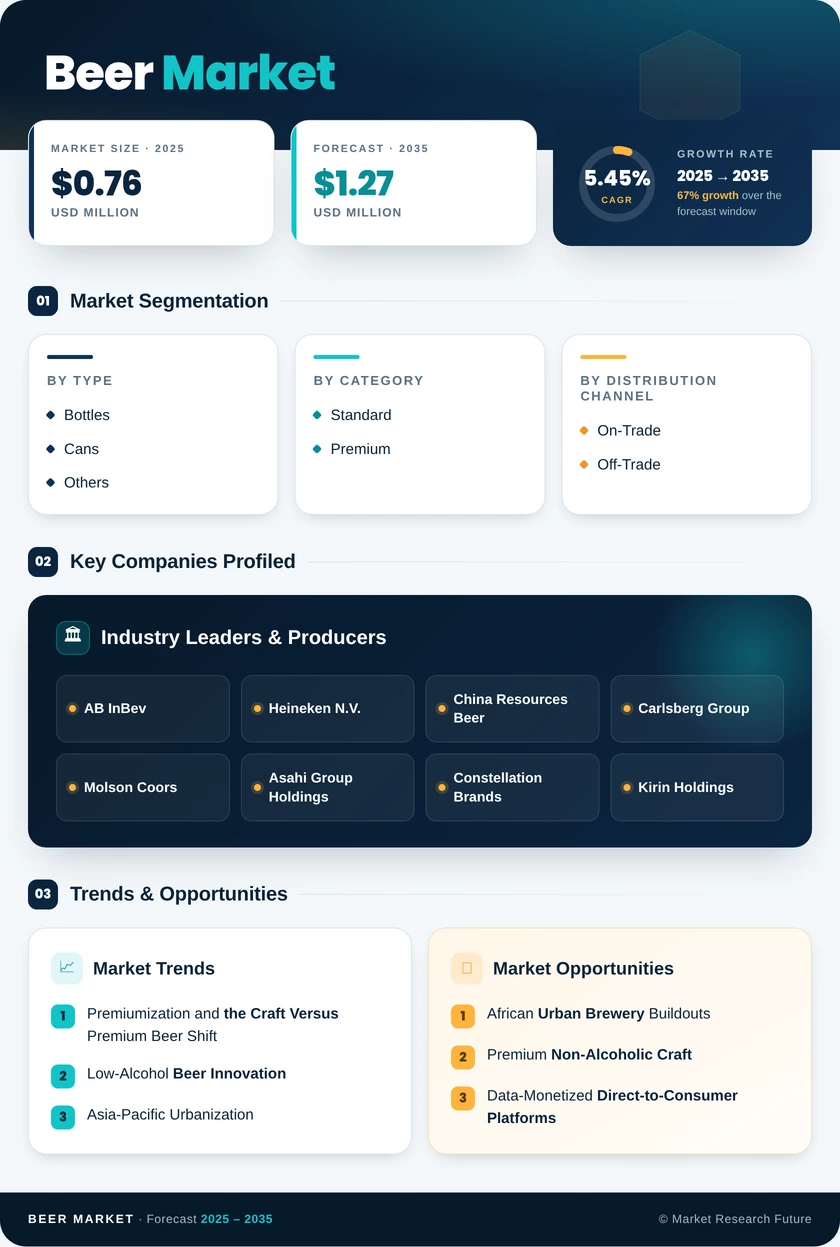
| By Category | Standard, Premium | Standard | Premium |
| By Packaging Type | Bottles, Cans, Others | Bottles | Cans |
| By Distribution Channel | On-Trade, Off-Trade | On-Trade | Off-Trade |
| By Geography | North America, Europe, Asia-Pacific, South America, Middle East & Africa | Asia-Pacific | Asia-Pacific |
Market Segmentation Overview
By Product Type
| Sub-Segment | Key Trend |
| Ale | IPA-led premium pricing and craft halo |
| Lager | Mainstream volume anchor with stable global scale |
| Non/Low-Alcohol Beer | Fastest growth lifted by moderation and Gen-Z adoption |
| Other Beer Types | Sours, stouts, and hybrid styles are expanding niche occasions |
Lager remains the volume backbone of the global beer industry, but non/low-alcohol formats are restructuring the category mix. Ale captures disproportionate value through craft and IPA pricing, while emerging styles seed long-term innovation pipelines.
By Category
| Sub-Segment | Key Trend |
| Standard | Mass-market accessibility with stable but slowing volumes |
| Premium | Trade-up behavior and super-premium imports leading value growth |
Premium expansion is decoupling value from volume in mature beer markets. Standard SKUs maintain household reach but yield revenue share to premium and above-premium imports.
By Packaging Type
| Sub-Segment | Key Trend |
| Bottles | Returnable infrastructure entrenched in Europe and Latin America |
| Cans | Fastest growth in lightweight logistics and high recyclability |
| Others (Kegs, Draught) | On-trade recovery and microbrewery taproom expansion |
Cans are accelerating because of beverage-grade aluminum's recycling efficiency and shipping economics, while bottle reuse loops remain strategically important in regulated EU markets.
By Distribution Channel
| Sub-Segment | Key Trend |
| On-Trade | Hospitality revenue rebound and premium-by-the-glass occasions |
| Off-Trade | Convenience, e-commerce, and at-home occasions are driving the CAGR |
On-trade retains premium pricing economics, while off-trade is the structural growth winner as digital grocery and convenience formats embed beer purchases into everyday baskets.
By Geography
| Sub-Segment | Key Trend |
| North America | Mexican import strength and craft consolidation |
| Europe | Sustainability regulation and NoLo leadership |
| Asia-Pacific | Premiumization, capacity additions, and India unlock |
| South America | Premium trade-up in Brazil and Mexico spillover |
| Middle East & Africa | Greenfield breweries and NoLo whitespace |
Asia-Pacific anchors both volume and growth, while Africa represents the highest-optionality region for the next decade of brewery capex and consumer recruitment.