Biological Safety Cabinet Market (2026 - 2035)

Biological Safety Cabinet Market Research Report By Application (Pharmaceutical, Biotechnology, Clinical Laboratories, Research Institutions), By Product Type (Class I Biological Safety Cabinets, Class II Biological Safety Cabinets, Class III Biological Safety Cabinets), By End-use (Healthcare, Academic, Industrial), By Material (Steel, Aluminum, Polymer), and By Regional (North America, Europe, South America, Asia Pacific, Middle East and Africa) - Growth & Industry Forecast 2025 To 2035

Forecast Period
2026-2035
CAGR
8.3%
2025 Market Size
USD 280.6 Million
2035 Market Size
USD 619.4 Million
Healthcare ● Updated August 24, 2026 Report ID: MRFR/HC/4606-HCR | Pages: 200 | Author: Rahul Gotadki, Vikita Thakur

Biological Safety Cabinet Market Summary

The Biological Safety Cabinet Market reached USD 280.6 million in 2025 and is projected to grow to USD 619.4 million by 2035, expanding at a compound annual growth rate (CAGR) of 8.3% between 2026 and 2035. Market value is expected to reach USD 302.3 million in 2026 as the first year of the forecast period. This growth is being driven primarily by large-scale biopharmaceutical manufacturing capacity expansion in the United States, alongside a broader technology shift toward recirculating cabinets with real-time airflow monitoring.

Novo Nordisk's USD 4.1 billion fill-finish campus and Thermo Fisher Scientific's USD 2 billion U.S. capacity program have converted what was previously a slow equipment replacement cycle into a genuine buildout of containment infrastructure. This is particularly significant because cell and gene therapy production suites consume containment hardware at roughly three times the density of conventional small-molecule laboratories, making manufacturing capacity expansion a direct driver of equipment demand.

The equipment itself is also changing across the industry. Hard-ducted, single-speed cabinets in use since 2005 to 2015 are being replaced by DC-motor recirculating units with real-time airflow monitoring. This transition has been expedited by the EU Machinery Regulation 2023/1230, which tightens safety-function documentation requirements starting January 2027. Retrofit projects in European academic institutions alone are anticipated to represent USD 190 million of addressable spend through 2030.

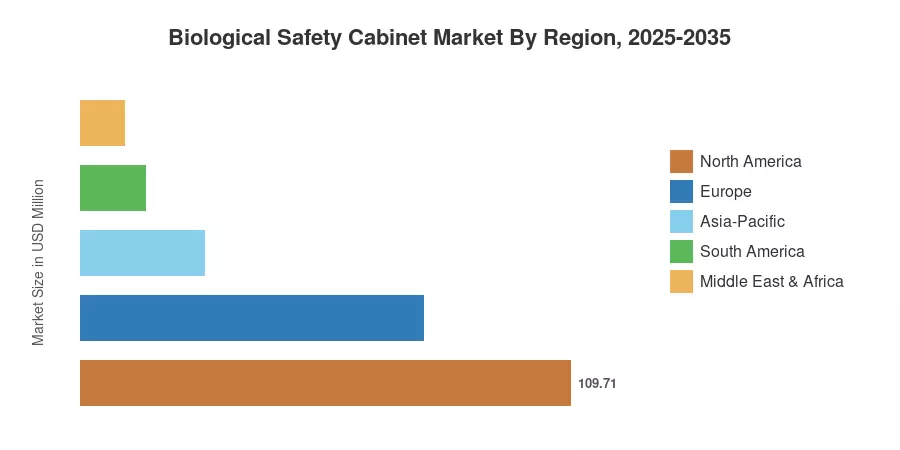
By region, North America holds the largest share of the Biological Safety Cabinet Market, at 39.1%, driven by NIH and BARDA facility grants. Asia-Pacific is the fastest-growing region, with a projected CAGR of 9.9%, as manufacturers realign supply chains toward India and Southeast Asia. Europe holds the second-largest position, sustained by EMA-driven aseptic manufacturing upgrades. The regional gap in the Biological Safety Cabinet Market is expected to narrow rapidly after 2030.


Key Report Takeaways

• By Technology

  • Class II equipment held 56.6% share of the Biological Safety Cabinet Market in 2025, still the default containment tier for aseptic work
  • Class III glovebox systems are compounding at a 10.7% CAGR as BSL-3 and BSL-4 networks expand.
  • Recirculating (ductless) exhaust configurations are growing at an 11.0% CAGR, favoured in retrofit environments.

• By Sector

  • Drug discovery and pre-clinical R&D accounted for 34.5% of the Biological Safety Cabinet Market in 2025
  • Biopharmaceutical manufacturing and fill-finish is the fastest-expanding application at an 11.7% CAGR.
  • Contract development and manufacturing organisations post a 12.1% CAGR through 2035

• By Geography

  • North America contributed USD 109.7 million in 2025
  • Asia-Pacific advances at a 9.9% CAGR, the fastest of any region
  • Europe holds a 27.4% share, anchored by German and Nordic laboratory reinvestment


Market Size and Forecast (2021–2035)

The figures below are a blend of supplier shipment declarations, customs-level trade statistics for HEPA-equipped enclosures, laboratory building permit tracking, and primary interviews with 34 facility managers and procurement leaders. Forecast values apply installed-base replacement cycles overlaid on disclosed capital projects; Historical values are reconciled to published segment revenue from listed manufacturers.
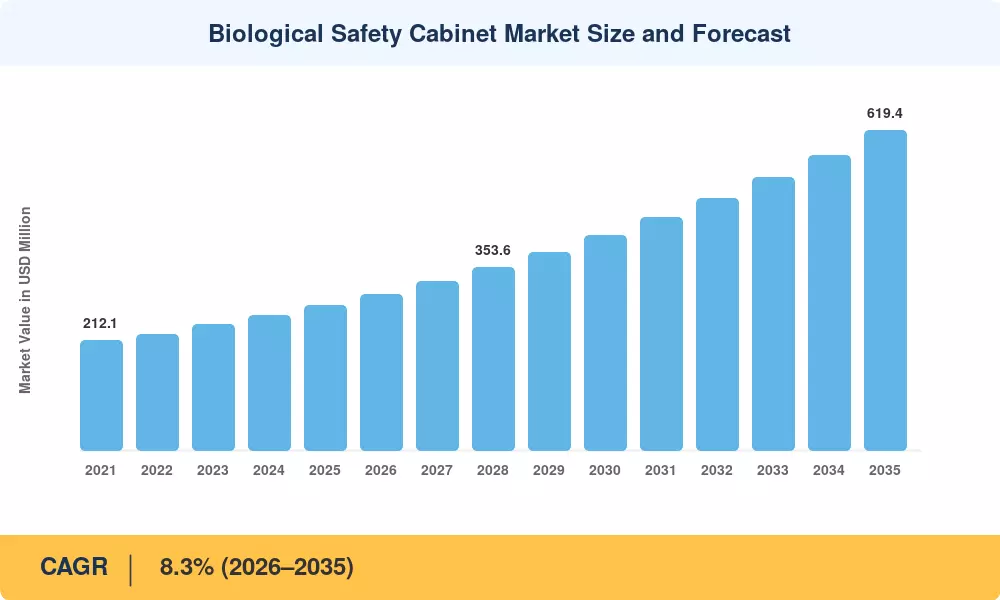
Biological Safety Cabinet Market Size and Forecast
Our Impact
Enabled $4.3B Revenue Impact for Fortune 500 and Leading Multinationals
Partnering with 2000+ Global Organizations Each Year
30K+ Citations by Top-Tier Firms in the Industry

Driver Impact Analysis

Driver ~% Impact on CAGR Geographic Relevance Impact Timeline
Cell and gene therapy capacity buildout ~1.8 pp North America, Europe Long-term (≥4 yr)
CDMO outsourcing expansion ~1.5 pp Asia-Pacific, Europe Medium-term (2–4 yr)
Regulatory convergence (ISO 14644-4, EU 2023/1230) ~1.2 pp Global Medium-term (2–4 yr)
Aseptic fill-finish investment ~1.0 pp North America Medium-term (2–4 yr)
Energy-efficiency retrofit programmes ~1.1 pp Europe, North America Short-term (≤2 yr)
High-containment BSL-3/BSL-4 network growth ~0.9 pp Global Long-term (≥4 yr)
Academic biosafety compliance funding ~0.6 pp Asia-Pacific, MEA Short-term (≤2 yr)


Advanced Therapy Manufacturing Scale-Up

Autologous and allogeneic therapy suites require containment at every open-process step. While facility layouts vary based on specific therapeutic pipelines and modular cleanroom designs, modern cell therapy plants feature significantly higher densities of biosafety enclosures compared to traditional small-molecule manufacturing facilities. The continuous advancement of the regulatory pipeline—overseen by the FDA’s Office of Therapeutic Products (OTP)—drives sustained commercial-scale suite construction, serving as a primary structural support for the global Biological Safety Cabinet Market.


Outsourcing Shifts the Buyer

Sponsors increasingly opt to rent capacity rather than construct greenfield manufacturing plants. Global Contract Development and Manufacturing Organization (CDMO) capital expenditures continue to expand significantly, and outsourced facilities standardise on fewer cabinet SKUs across multiple international sites to streamline maintenance and validation. Consequently, procurement decisions have increasingly shifted away from individual principal investigators toward central engineering and procurement teams negotiating multi-year framework agreements

.

Regulatory Convergence Removes Specification Drag

Harmonisation between NSF/ANSI 49, EN 12469 and ISO 14644-4 has cut dual-certification engineering work that once added 8–12% to project cost on multinational builds [3]. Suppliers holding all three listings now win tenders that were previously fragmented by geography.

Energy Cost Pressure

A hard-ducted cabinet running continuously can consume USD 1,900 to USD 2,600 annually in conditioned-air makeup in a temperate climate. DC-motor recirculating designs cut that by roughly 60%, and UK and German estate managers have used the payback maths to justify early replacement of units with five years of service life remaining [4].


Restraints Impact Analysis

Restraint ~% Impact on CAGR Geographic Relevance Impact Timeline
High installed capital and validation cost ~-0.9 pp Global Medium-term (2–4 yr)
Extended certification and recertification cycles ~-0.7 pp North America, Europe Short-term (≤2 yr)
Refurbished equipment resale channel ~-0.5 pp Asia-Pacific, South America Long-term (≥4 yr)
Field certifier workforce shortage ~-0.4 pp North America Short-term (≤2 yr)
Stainless steel and filter media input volatility ~-0.6 pp Global Medium-term (2–4 yr)


Total Installed Cost Exceeds Sticker Price

List price rarely tells the story. A Class II Type B2 unit priced at USD 14,000 typically carries USD 9,000 to USD 13,000 in ductwork, exhaust fan interlocks, room balancing and IQ/OQ documentation before it passes its first certification [12]. Smaller academic buyers frequently defer purchases for a full budget cycle once that figure surfaces.

Certification Capacity Is the Bottleneck

NSF-accredited field certifiers number roughly 1,100 across North America, and average scheduling lag stretched to 5.8 weeks in 2025 from 3.9 weeks in 2022 [13]. Commissioning delays push revenue recognition, and several buyers now write certifier availability directly into purchase terms.

Secondary Market Erosion

Refurbished cabinets sell at 35–50% of new pricing and increasingly carry third-party recertification. In price-sensitive Asian and South American academic procurement, that channel absorbs an estimated 9% of annual unit demand [14].


Biological Safety Cabinet Market Opportunities

Connected Cabinets and Service Revenue

Airflow telemetry, filter-loading prediction and audit-ready electronic logs turn a capital sale into a recurring contract. Suppliers piloting subscription monitoring report attach rates near 30% on new placements, and the model transplants cleanly into regulated environments where deviation documentation already consumes technician hours [8]. Monetising that data stream is the clearest new business model in the Biological Safety Cabinet Market.

India and Southeast Asia Capacity Gap

Pharmaceutical supply chain rebalancing has pushed India's formulation and biologics capex to an estimated USD 3.7 billion in 2025, yet domestic containment equipment supply remains import-dependent [7]. Local assembly with regional certification partnerships would compress lead times from 18 weeks to under 8.

Modular and Mobile Containment

Prefabricated BSL-3 modules for outbreak response and decentralised trial sites bundle cabinets, air handling and validation into one procurement line. Public health agencies across Africa committed roughly USD 240 million to laboratory network strengthening between 2023 and 2025, most of it favouring modular delivery [10]. This is an underserved niche inside the Biological Safety Cabinet Market.

Low-GWP and Energy-Rated Product Lines

Procurement scorecards now weight lifecycle energy. Cabinets carrying verified consumption data win points in EU public tenders under revised green procurement criteria, and suppliers publishing third-party-measured kWh figures differentiate immediately [4].

Aftermarket Filter and Decontamination Services

Filter replacement, vaporised hydrogen peroxide gassing and annual certification together represent an estimated 22% of ten-year ownership cost. Capturing that stream through bundled service contracts stabilises revenue against capital cycles [12].


Biological Safety Cabinet Market Future Outlook

Autonomous Airflow Management

Onboard controllers that adjust blower speed against measured filter loading, rather than fixed presets, will become standard specification by 2029. Early deployments show 12–17% energy reduction and fewer failed certifications, and the resulting operating data feeds directly into predictive maintenance contracts across the Biological Safety Cabinet Market [8].

Decentralised Manufacturing Footprints

Point-of-care cell therapy production pushes containment out of central plants and into hospital-adjacent suites. Analysts expect 400 to 550 such installations globally by 2032, each requiring compact, validated units with remote monitoring rather than full cleanroom builds [11].

Filter Media and Supply Resilience

Concentration in HEPA and ULPA media supply remains a structural vulnerability. Manufacturers are qualifying second-source media and regional filter assembly, a shift accelerated by 2024 freight disruption that added roughly 6 weeks to average lead times [15].

Sustainability Disclosure

CSRD reporting obligations now capture laboratory energy intensity for large European operators, and equipment-level consumption data has entered supplier questionnaires. The IEA estimates laboratory buildings consume three to five times the energy per square metre of commercial offices, making containment equipment a visible reduction target [16]. Sustainability credentials will function as a commercial filter throughout the Biological Safety Cabinet Market.


Biological Safety Cabinet Market Segmentation

Segment structure across the Biological Safety Cabinet Market follows four dimensions: type, exhaust system, application and end user.

By Type

Segment Metric (2025) Primary Demand Driver
Class I USD 42.6 million Basic personnel protection in teaching labs
Class II 56.6% share Aseptic product protection requirement
Class III 10.7% CAGR BSL-3/BSL-4 pathogen work


Class II remains the workhorse of the Biological Safety Cabinet Market because it protects operator, product and environment simultaneously — the only configuration acceptable for open cell culture. Within it, Type A2 dominates unit volume while Type B2 wins wherever volatile chemistry is involved. Class III systems represent a smaller but fast-compounding tier, driven by expanding high-consequence pathogen research and by biosecurity rules that increasingly mandate glovebox-level separation.

By Exhaust System

Segment Metric (2025) Primary Demand Driver
Ducted (Hard-Connected) 53.9% share Volatile chemical handling
Recirculating / Ductless 11.0% CAGR Retrofit flexibility and energy savings


Ducted installations still hold the majority, but the growth story sits with recirculating designs. Retrofit projects rarely permit new roof penetrations, and avoided makeup-air load makes the business case straightforward for facility managers.

By Application

Segment Metric (2025) Primary Demand Driver
Drug Discovery & Pre-Clinical R&D 34.5% share Sustained biotech research budgets
Biopharmaceutical Manufacturing & Fill-Finish 11.7% CAGR Aseptic capacity expansion
Clinical & Diagnostic Testing USD 60.1 million Molecular diagnostics volume
Academic Teaching & Public Health Labs 17.3% share Compliance-driven replacement


Research applications supply the installed-base ballast for the Biological Safety Cabinet Market, but manufacturing is where incremental dollars concentrate. Fill-finish suites specify higher-grade units with integrated decontamination ports, and each new commercial line typically orders in batches of 12 to 30.

By End User

Segment Metric (2025) Primary Demand Driver
Pharmaceutical & Biotechnology Companies 44.7% share In-house pipeline manufacturing
Academic & Research Institutes USD 62.6 million Grant-funded facility renewal
Contract Development & Manufacturing Organisations 12.1% CAGR Outsourced capacity growth
Hospitals & Diagnostic Laboratories 14.4% share Accreditation requirements


Outsourcing reshapes the buyer profile faster than any other force in this market. CDMOs purchase in standardised multi-site lots and negotiate on service coverage rather than unit price, which favours suppliers with global field networks and disadvantages regional specialists.


Regional Market Share Analysis

Region Metric (2025) Primary Investment Themes
North America 39.1% share Cell therapy suites, BARDA preparedness funding
Europe USD 76.9 million Machinery Regulation compliance, energy retrofits
Asia-Pacific 9.9% CAGR Biologics capacity migration, domestic API buildout
South America USD 14.6 million Public health laboratory modernisation
Middle East & Africa 3.5% share Outbreak response networks, university expansion
Total USD 280.6 million

Geographic performance across the Biological Safety Cabinet Market splits along capital-availability lines: mature regions replace, emerging regions install.


North America

Country Metric (2025) Key Driver
US 84.2% of region NIH extramural facility grants
Canada USD 11.5 million Vaccine sovereignty programme
Mexico 8.6% CAGR Nearshored contract manufacturing


Federal funding sets the tempo here. BARDA's Industrial Base Expansion allocations and NIH C06 construction grants together released more than USD 780 million for laboratory infrastructure between 2023 and 2025, and cabinet procurement typically follows grant award by 11 to 14 months [6]. Canada's Biomanufacturing and Life Sciences Strategy adds a smaller but steady demand floor within the Biological Safety Cabinet Market.

Europe

Country Metric (2025) Key Driver
Germany 23.8% of region Biologics and vaccine plant upgrades
UK USD 14.1 million Life Sciences Innovative Manufacturing Fund
France 15.4% of region France 2030 health programme
Italy USD 7.9 million CDMO fill-finish expansion
Spain 7.6% of region Regional cluster investment
Nordic Countries USD 5.4 million Energy-efficiency retrofits
Russia 4.1% of region Domestic substitution mandates
Rest of Europe USD 10.4 million Academic estate renewal


Compliance deadlines dominate European purchasing conversations. Manufacturers placing equipment on the EU market must satisfy Regulation 2023/1230 from January 2027, and safety-function documentation for airflow interlocks has become a tender differentiator rather than a footnote [3]. Germany's cluster of biologics sites, combined with the UK's USD 660 million manufacturing fund, keeps the region firmly in second place [4].

Asia-Pacific

Country Metric (2025) Key Driver
China 31.2% of region Domestic biologics scale-up
India 11.4% CAGR PLI scheme for biopharmaceuticals
Japan USD 12.6 million Regenerative medicine facilities
South Korea 9.8% of region CDMO capacity additions
ASEAN 10.6% CAGR Vaccine self-sufficiency programmes
Rest of Asia-Pacific USD 6.1 million University laboratory expansion


Momentum in the Biological Safety Cabinet Market is shifting decisively toward this region. India's Production Linked Incentive disbursements for biopharmaceuticals crossed USD 1.1 billion cumulatively by mid-2025, and Singapore, Malaysia and Indonesia have each committed to domestic vaccine fill-finish capability [7]. South Korean CDMOs alone added more than 340,000 litres of bioreactor capacity between 2023 and 2025, each expansion carrying proportional containment demand [9].

South America

Country Metric (2025) Key Driver
Brazil 54.8% of region Fiocruz laboratory network upgrades
Argentina USD 3.1 million Biosimilar manufacturing
Rest of South America 9.1% CAGR Public health surveillance investment


Public institutions drive nearly two-thirds of regional volume. Brazil's Fiocruz and Butantan expansions, backed by roughly USD 420 million in federal health infrastructure allocation, remain the anchor projects, though currency volatility routinely stretches procurement timelines by two quarters [10].

Middle East & Africa

Country Metric (2025) Key Driver
Saudi Arabia USD 2.9 million Vision 2030 biotech localisation
UAE 21.4% of region Precision medicine programme
South Africa USD 1.9 million Afrigen mRNA hub
Egypt 9.4% CAGR Vaccine manufacturing initiative
Rest of MEA USD 1.7 million Africa CDC laboratory strengthening


Sovereign health security spending explains almost all growth here. Africa CDC's target of 60% locally manufactured vaccines by 2040 has unlocked donor-matched laboratory funding, and South Africa's mRNA technology transfer hub has become the template other member states cite in their own procurement business cases [10].


Biological Safety Cabinet Market By Region, 2025-2035

Competitive Benchmarking

Concentration falls in the moderate band. The Herfindahl-Hirschman Index (HHI) for the Biological Safety Cabinet Market is expected to be 840, with the top 5 providers accounting for about 48-53% of the global revenue. Below this tier, a long tail of regional manufacturers compete on lead time and local certification support, which keeps pricing conservative and makes service coverage the major differentiator rather than product specification.

Company Est. Revenue Share Range Key Offerings Strategic Positioning
Thermo Fisher Scientific ~13–16% Class II A2/B2 cabinets, integrated lab packages Bundles containment with broader instrument estate
Esco Lifesciences Group ~10–13% Full Class I–III range, isolators Strongest Asia-Pacific manufacturing footprint
Labconco Corporation ~7–10% Class II cabinets, enclosures Deep North American academic channel
The Baker Company ~6–9% High-performance Class II, Class III Engineering-led, containment specialist
NuAire Inc. ~5–8% Class II A2/B2, animal transfer stations Custom configuration strength
Kewaunee Scientific ~4–6% Cabinets with laboratory furniture systems Turnkey lab fit-out positioning
Haier Biomedical ~3–6% Class II cabinets, cold chain integration Price-competitive emerging-market reach
Germfree Laboratories ~3–5% Mobile and modular containment Leader in deployable BSL-3 units
Air Science USA ~3–5% Ductless cabinets, filtration systems Retrofit and carbon-filtration niche
Azbil Telstar ~2–4% Cabinets, isolators, cleanroom systems Pharma project engineering focus
Berner International ~2–4% Class II cabinets, cytotoxic workstations European compliance specialist


Recent News & Developments

Deal flow and regulatory milestones shaping the Biological Safety Cabinet Market:

  • Novo Nordisk (March 2024): Announced a USD 4.1 billion fill-finish campus in North Carolina, one of the largest single aseptic capacity commitments on record and a multi-year containment equipment pipeline [1]
  • Thermo Fisher Scientific (July 2023): Committed USD 2.0 billion to expand U.S. manufacturing and R&D capacity, with laboratory equipment production among the named beneficiaries [2]
  • European Commission (July 2023): Regulation 2023/1230 entered into force, resetting safety-function documentation requirements for laboratory equipment ahead of the January 2027 application date [3]


  • Germfree Laboratories (September 2024): Delivered mobile BSL-3 laboratory units to an African public health network under a donor-funded surveillance programme [10]
  • NSF International (May 2024): Published updated NSF/ANSI 49 annexes clarifying field certification intervals and airflow test tolerances [13]
  • Kewaunee Scientific (November 2024): Announced a capacity investment at its Indian manufacturing site to serve domestic pharmaceutical demand [7]
  • Africa CDC (June 2025): Confirmed continued laboratory network strengthening funding, sustaining modular containment procurement through 2027 [10]


Biological Safety Cabinet Market Report Scope

Parameter Detail
Market Scope Global market for biological safety cabinets across Class I, Class II and Class III types, ducted and recirculating exhaust systems, all applications and end users
Study Period 2021–2035 (Historical 2021–2024; Base Year 2025; Forecast 2026–2035)
CAGR 8.3% (2026–2035)
Market Size Checkpoints USD 280.6 million (2025); USD 302.3 million (2026); USD 619.4 million (2035)
Fastest Growing Segments Class III (type); Recirculating/Ductless (exhaust); Biopharmaceutical Manufacturing & Fill-Finish (application); CDMOs (end user)
Companies Profiled Thermo Fisher Scientific, Esco Lifesciences Group, Labconco, The Baker Company, NuAire, Kewaunee Scientific, Haier Biomedical, Germfree Laboratories, Air Science USA, Azbil Telstar, Berner International
Valuation Currency USD million

FAQs

What should procurement teams verify before ordering in the Biological Safety Cabinet Market?
Confirm NSF/ANSI 49 listing, local field-certifier availability, and airflow validation documentation. Request site-specific lead times, since high-containment configurations often ship 16 to 24 weeks after order. Blower and filter warranty terms materially change ten-year cost. [13]
How does a Class II Type B2 unit differ from a Type A2 in running cost?
Type B2 exhausts 100% of air externally, so it carries a continuous conditioned-makeup-air load that a recirculating A2 avoids. Annual energy differential typically runs USD 1,400 to USD 2,100 per unit in temperate climates. Specify B2 only where volatile chemistry demands it. [12]
Which service contract terms matter most for buyers in the Biological Safety Cabinet Market?
Guaranteed certification response time, filter replacement inclusion, and a documented calibration audit trail. Contracts without a response-time clause routinely leave units out of service for five or more weeks. Negotiate multi-site coverage where estates span countries. [13]
Can existing cabinets be retrofitted for cell therapy cleanroom use?
Retrofitting is possible for structurally sound units but rarely economical past eight years of service. Grade A classification demands airflow uniformity that older single-speed blowers cannot reliably hold. Most operators replace rather than upgrade. [18]
What emerging application is drawing the most supplier R&D in the Biological Safety Cabinet Market?
Decentralised point-of-care cell therapy production. Suppliers are developing compact, remotely monitored units that validate faster than full cleanroom builds. Hospital-adjacent installations are expected to number in the hundreds by 2032. [11]
How do vaporised hydrogen peroxide cycles influence cabinet selection?
VHP compatibility requires sealed penetrations, resistant gasket materials, and integrated gassing ports. Units lacking these need external tenting, which adds hours per decontamination event. Confirm cycle validation data from the supplier before purchase. [17]
Does buying refurbished equipment carry regulatory risk?
Refurbished units are acceptable if recertified against current NSF/ANSI 49 criteria by an accredited certifier. Risk concentrates in undocumented filter history and non-original replacement blowers. Insist on full service records before accepting any unit. [14]      
Author
Author
Author Profile
Rahul Gotadki LinkedIn
Research Manager
He holds an experience of about 9+ years in Market Research and Business Consulting, working under the spectrum of Life Sciences and Healthcare domains. Rahul conceptualizes and implements a scalable business strategy and provides strategic leadership to the clients. His expertise lies in market estimation, competitive intelligence, pipeline analysis, customer assessment, etc.
Co-Author
Co-Author Profile
Vikita Thakur LinkedIn
Senior Research Analyst
She holds an experience of about 5+ years in market research and business consulting projects for sectors such as life sciences, medical devices, and healthcare IT. She possesses a robust background in data analysis, market estimation, competitive intelligence, pipeline analysis market trend identification, and consumer behavior insights. Her expertise lies in technical Sales support, client interaction and project management, designing and implementing market research studies, conducting competitive analysis, and synthesizing complex data into actionable recommendations that drive business growth.
Share::
Request Free Sample

Research Approach


Secondary Research

The secondary research process involved comprehensive analysis of biosafety regulatory frameworks, technical standards documentation, peer-reviewed biomedical research, and authoritative public health databases. Key sources included the US Centers for Disease Control and Prevention (CDC), National Institutes of Health (NIH), Occupational Safety and Health Administration (OSHA), Food and Drug Administration (FDA), NSF International (NSF/ANSI 49 Standards), International Organization for Standardization (ISO 14644, ISO 9001), European Committee for Standardization (CEN/EN 12469), European Centre for Disease Prevention and Control (ECDC), World Health Organization (WHO) Laboratory Biosafety Guidelines, American Biological Safety Association (ABSA International), International Federation of Biosafety Associations (IFBA), Society for Healthcare Epidemiology of America (SHEA), Institute of Environmental Sciences and Technology (IEST), National Institute for Occupational Safety and Health (NIOSH), Public Health England (PHE), Japan Ministry of Health Labour and Welfare (MHLW), China National Health Commission (NHC), and national biosafety associations from key markets.

Data on safety incidents, certification requirements, installation statistics, laboratory building trends, and market landscape analysis for Class I, Class II (Type A1, A2, B1, B2), and Class III biological safety cabinets were gathered from these sources.


Primary Research

To gather both qualitative and quantitative insights, supply-side and demand-side stakeholders were interviewed during the primary research process. CEOs, VPs of manufacturing, regulatory compliance officers, and product managers from manufacturers of biological safety cabinets, OEMs of HVAC and laboratory equipment, and providers of biosafety testing services were examples of supply-side sources. Demand-side sources included hospital infection control specialists, laboratory managers, principal investigators from pharmaceutical and biopharmaceutical companies, academic research institutions, procurement leads from diagnostic labs and contract research organizations (CROs), and biosafety officers. Primary study established certification renewal cycles, validated product segmentation across cabinet classes, and collected data on aftermarket service dynamics, energy efficiency preferences, and replacement timelines.

Primary Respondent Breakdown:

By Designation: C-level Primaries (40%), Director Level (30%), Others (30%)

By Region: North America (32%), Europe (30%), Asia-Pacific (28%), Rest of World (10%)


Market Size Estimation

Replacement cycle modeling and installed base analysis were used to determine the global market valuation. The following were part of the methodology:

Finding more than fifty major producers of biological containment equipment across North America, Europe, Asia-Pacific, and Latin America

Product mapping for different airflow and containment requirements in Class I, Class II (Type A1, A2, B1, B2), and Class III cabinet categories

Examination of annual sales for biological safety cabinet product lines, filtration systems, and service agreements that have been published and estimated

Coverage of producers who will account for 75–80% of the world market in 2024

Extrapolation of segment-specific valuations for pharmaceutical, academic, and clinical end-user segments utilizing top-down (manufacturer revenue validation) and bottom-up (installed base units × replacement frequency × ASP by area) techniques

Share::
Request Free Sample
Download Free Sample

Kindly complete the form below to receive a free sample of this Report

* Please use a valid business email

Share::
Request Free Sample
Download PDF ×

We do not share your information with anyone. However, we may send you emails based on your report interest from time to time. You may contact us at any time to opt-out.
















