Bionic Eye Market (2026 - 2035)

Bionic Eye Market Research Report By Technology (Retinal Implants, Cortical Implants, Bionic Eye Prosthetics), By Application (Vision Restoration, Research Development, Clinical Trials), By End User (Hospitals, Research Institutions, Ophthalmology Clinics), By Functionality (Functional Vision Enhancement, Image Processing, Neural Interface) and By Regional (North America, Europe, South America, Asia-Pacific, Middle East and Africa) - Industry Forecast Till 2035
ID: MRFR/MED/0753-HCR
80 Pages
Nidhi Mandole, Rahul Gotadki
Last Updated: July 02, 2026
Bionic Eye Market
Market Size
Forecast Period2026-2035
CAGR (2026-2035)12.4%
2025 Market SizeUSD 382.80 Million
2035 Market SizeUSD 1,245.00 Million
Key Players
Second Sight Medical Products
Cortigent Inc.
Pixium Vision
Bionic Vision Technologies
Science Corporation
Nano Retina
Opportunities
  • Cortical Implants Expanding the Addressable Population
  • AI-Driven Phosphene Optimization and Closed-Loop Firmware
  • Emerging-Market Government Subsidization Programs

Bionic Eye Market Summary

The Global Bionic Eye Market size was valued at USD 382.80 Million in 2025, and the market is projected to grow from USD 434.48 Million in 2026 to USD 1,245.00 Million by 2035, registering a CAGR of 12.4% during the forecast period 2026–2035. This expansion rests on an aging global population — the WHO estimates 2.2 billion people live with some form of vision impairment — combined with accelerated regulatory pathways such as the FDA's Breakthrough Device Designation program, which has shortened approval timelines for visual prosthetics by roughly 30% since 2020 [1]. Public funding bodies in the US, EU, and Australia have collectively channeled over USD 600 Million into neural-interface vision research since 2018 [2], creating a pipeline of devices approaching clinical viability.

The Bionic Eye Market is currently experiencing a fundamental technological transformation. Legacy external-camera configurations that are connected to wired processors are being replaced by entirely implantable systems that are powered by wireless telemetry. The active surface area of micro-electronic arrays has decreased to less than 1 mm², and the number of electrodes has increased to over 100 channels. This has resulted in a shift in resolution from rudimentary phosphene perception to functional shape recognition [3]. The cortical pathway has been validated as a viable alternative to retinal approaches, as evidenced by the combined grant funding of cortical implant initiatives at Monash University, Baylor College of Medicine, and several European consortia, which exceeds USD 150 million [4].

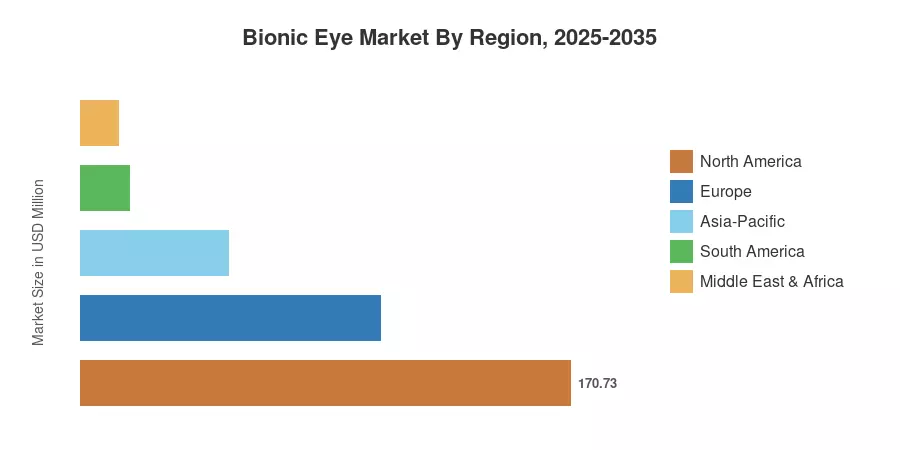
North America is responsible for approximately 44.6% of the Bionic Eye Market, which is primarily driven by a concentration of clinical trial sites and robust Medicare reimbursement codes (CPT 0100T–0101T). The Asia-Pacific region is expected to experience the highest rate of growth, with a compound annual growth rate (CAGR) of 13.5%. This growth is being driven by the increasing capacity of ophthalmic surgical procedures in China, India, and South Korea. Europe's second-largest position is anchored by Horizon Europe neurotechnology grants and NHS pilot programs, with an approximate 27.3% share. The Bionic Eye Market is poised to evolve from a niche surgical intervention to a scalable clinical platform in the coming decade as device miniaturization continues and cost profiles improve.


Key Report Takeaways

• By Technology

  • Retinal prosthesis held approximately 54.2% of the Bionic Eye Market share in 2025, reflecting its longer clinical track record and established surgical protocols.
  • Cortical visual prosthesis is expanding at a 13.2% CAGR through 2035 as multi-center trials validate superior resolution potential for patients ineligible for retinal devices.

• By Device Placement

  • External wearable systems led the Bionic Eye Market with about 69.4% share in 2025, owing to lower surgical complexity.


• By Component

  • Power and telemetry modules are growing at a 13.3% CAGR, driven by wireless charging breakthroughs that eliminate percutaneous connectors.

• By End-User

  • Hospitals and eye-care chains captured roughly 48.9% of revenue in the Bionic Eye Market in 2025, serving as the primary implantation setting.


• By Region

  • Asia-Pacific is set to expand at the highest regional CAGR of 13.5% during 2026–2035, led by government-subsidized ophthalmic programs in China and India.


Market Size and Forecast (2021–2035)

Market Research Future employs a bottom-up revenue methodology for the Bionic Eye Market, triangulating device shipment volumes, average selling prices across retinal, cortical, and optic-nerve platforms, and procedure reimbursement data from 40+ national health systems. Historical figures (2021–2024) draw on company filings and MedTech regulatory clearance databases, while the forecast (2026–2035) applies scenario-weighted CAGR modeling anchored to clinical-trial pipeline maturity curves.
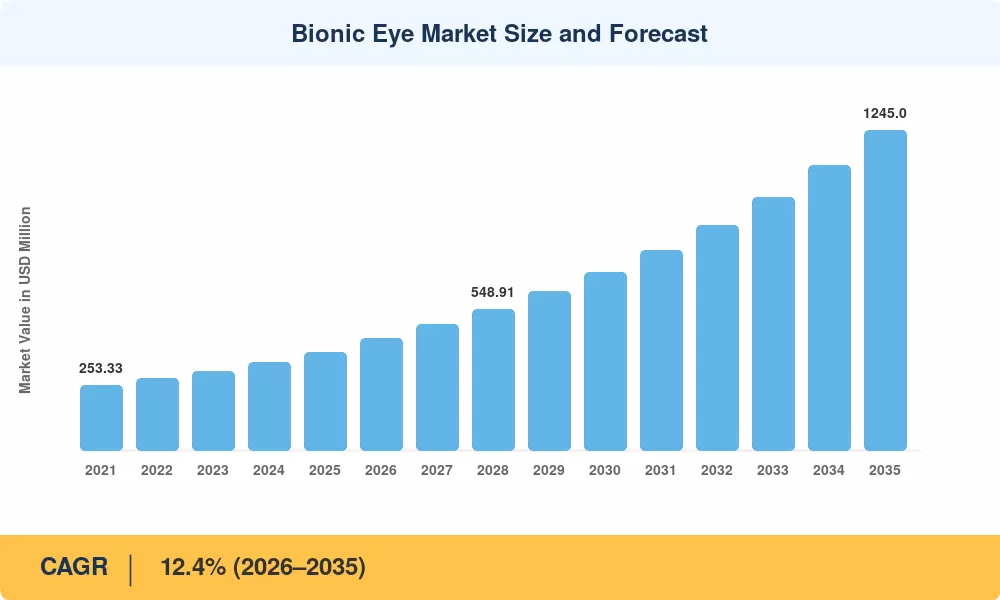
Bionic Eye Market Size and Forecast
Our Impact
Enabled $4.3B Revenue Impact for Fortune 500 and Leading Multinationals
Partnering with 2000+ Global Organizations Each Year
30K+ Citations by Top-Tier Firms in the Industry

Driver Impact Analysis

Driver ~% Impact on CAGR Geographic Relevance Impact Timeline
Aging population & rising retinal disease burden ~22% Global Long-term (≥4 yr)
Breakthrough Device & fast-track regulatory pathways ~18% North America, Europe Short-term (≤2 yr)
Wireless power & miniaturization advances ~16% Global Medium-term (2–4 yr)
Public grant funding for neural-interface R&D ~14% North America, Europe, Oceania Medium-term (2–4 yr)
Expanding reimbursement codes & payer coverage ~13% North America, Europe Short-term (≤2 yr)
Cortical implant clinical-trial pipeline acceleration ~10% Global Long-term (≥4 yr)
AI-enabled phosphene optimization algorithms ~7% North America, Asia-Pacific Medium-term (2–4 yr)


Aging Population and Retinal Disease Burden

The United Nations projects the global population aged 60 and above will reach 2.1 billion by 2050, doubling from 2024 levels. This demographic shift significantly expands the patient pool for age-related retinal conditions, which are leading causes of vision loss. As life expectancy rises globally, the healthcare burden of degenerative ocular diseases grows structurally and persistently.


Regulatory Fast-Tracking and Breakthrough Designations

Access to innovative technologies that address debilitating conditions is expedited through the FDA Breakthrough Devices Program. The FDA has issued more than 1,280 designations since its inception, which have facilitated prioritized review and improved expert interaction. This regulatory mechanism substantially reduces the development cycle, facilitating the faster market entry of neurostimulation devices and the transformation of clinical trial pathways for vision-restoration technologies.


Wireless Power Transmission and Device Miniaturization

Advancements in engineering have now enabled near-field wireless power systems to attain a coupling efficiency of over 85%. Simultaneously, the advancement of ultra-thin, flexible polyimide electrode arrays reduces tissue trauma during implantation. In addition to minimizing complex surgical risks, these technological refinements increase the number of patients eligible for long-term vision-restoring implants and improve device longevity and biocompatibility.


Public Grant Funding for Neural-Interface Research

Innovation in visual neurotechnology is primarily stimulated by global public investment. In fiscal year 2026, the NIH BRAIN Initiative, which is a cornerstone of US neuroscience research, allocated approximately $429 million to support the development of neural mapping and interface technologies. The translation of laboratory-based visual-interface prototypes is effectively accelerated by the de-risking of high-capital, early-stage development that is facilitated by such sustained government support.


Restraints Impact Analysis

Restraint ~% Drag on CAGR Geographic Relevance Impact Timeline
High device and surgical costs (USD 100K–150K per procedure) ~30% Global Short-term (≤2 yr)
Reimbursement gaps in emerging markets ~25% Asia-Pacific, South America, MEA Medium-term (2–4 yr)
Post-surgical complication and explant risk ~18% Global Long-term (≥4 yr)
Limited patient candidacy pool (narrow indications) ~15% Global Medium-term (2–4 yr)
Surgical learning curve and specialist scarcity ~12% Emerging markets Long-term (≥4 yr)


Prohibitive Procedure Economics

High-technology medical interventions face substantial financial barriers due to their significant capital requirements. As global medical cost trends reach approximately 9% annually, affordability for complex implants remains a primary concern for patients and payers. Without robust reimbursement pathways, the high out-of-pocket costs limit equitable access to vision-restoration technologies, often restricting adoption to affluent populations.


Reimbursement Gaps in Emerging Markets

Global access to essential medical technologies remains significantly inequitable, with reports indicating that access to necessary assistive products can be as low as 3% in some low-income nations. Without standardized national reimbursement codes and dedicated policy frameworks for advanced visual prosthetics, these regions lack the infrastructure to support large-scale clinical integration and adoption.


Post-Surgical Complications and Explant Risk

Surgical implantation of complex neural devices inherently carries risks of infection, inflammatory responses, and mechanical failure. Clinical data indicate that implant-related complications, such as device failure or tissue rejection, can occur in a notable percentage of cases. These clinical risks necessitate long-term monitoring, which can deter referring physicians and limit broad clinical utility.


Bionic Eye Market Opportunities

Cortical Implants Expanding the Addressable Population

Cortical visual prostheses bypass the eye, addressing conditions like optic-nerve atrophy or glaucoma, which affect approximately 148 million people globally. Unlike retinal devices, these systems interface directly with the visual cortex. Ongoing international pilot studies are evaluating safety and efficacy, potentially offering the only viable visual restoration pathway for patients with total peripheral retinal damage.


AI-Driven Phosphene Optimization and Closed-Loop Firmware

Advancements in machine learning now enable real-time optimization of neural stimulation, significantly enhancing perceived image quality. By processing visual inputs through adaptive algorithms, these systems can improve object recognition and spatial navigation. This software-defined approach allows manufacturers to refine device performance post-implantation, providing critical functional improvements that transform basic light perception into meaningful visual utility.


Emerging-Market Government Subsidization Programs

Government-led initiatives are increasingly prioritizing medical innovation to address high rates of blindness. For instance, China’s 14th Five-Year Plan emphasizes strategic development in neurotechnology and high-end medical devices to enhance national self-reliance. Similarly, India continues to invest in the National Programme for Control of Blindness, fostering an environment where advanced ocular prosthetics may receive support.

Drone-as-a-Service Analogies: Implant-as-a-Service Financing

To overcome high initial capital barriers, the medical device sector is shifting toward outcome-based payment structures. By implementing pay-per-procedure or risk-sharing models, manufacturers and healthcare providers can distribute financial burdens across the patient's treatment lifecycle. This flexible financing strategy is essential for increasing procedure volumes and ensuring that innovative technologies reach patients in diverse markets.


Data Monetization from Implant Telemetry

Implanted devices serve as critical data collection platforms, capturing longitudinal metrics like electrode impedance and patient-reported outcomes. This real-world evidence is invaluable for validating long-term safety and regulatory performance. Manufacturers utilize these de-identified datasets to support clinical studies, secure regulatory approvals, and inform the iterative design of next-generation visual neuroprosthetics for improved patient health.


Bionic Eye Market Future Outlook

AI-Augmented Neural Decoding and Adaptive Stimulation

By 2030, machine-learning pipelines will evolve bionic-eye systems from static stimulators into highly adaptive vision technologies. Integration of edge-computing chips allows for real-time inference, crucial for minimizing latency in visual processing. This software-driven paradigm shifts competitive focus from simple electrode density to sophisticated, personalized neural decoding, mirroring broader trends in high-performance implantable medical technology.


Platform Economics and Manufacturer Services Revenue

Future revenue models will increasingly shift toward service-based architectures, including remote calibration and firmware-defined performance enhancements. As integrated remote monitoring becomes standard, post-implant services are expected to account for a significant portion of total revenue. This transition mirrors the evolution of cardiac devices, where cloud-connected platforms provide sustained value beyond the initial hardware implantation.

Convergence with Gene Therapy and Optogenetics

The therapeutic landscape is diversifying through hybrid approaches that combine electronic stimulation with biological sensitivity. While electronic prosthetics remain primary for total blindness, optogenetic sensitization of retinal cells offers a complementary pathway for partial vision restoration. By the early 2030s, the market will likely segment into distinct electronic, biological, and hybrid therapeutic categories.


Regulatory Harmonization and Global Access

Regulatory bodies are working toward harmonized performance standards for active implantable medical devices to facilitate global market entry. These efforts aim to reduce the substantial costs associated with duplicative clinical trials across major jurisdictions. Achieving international alignment is critical for scaling access, as it enables manufacturers to streamline development pathways for specialized, low-volume visual neuroprosthetics.


Bionic Eye Market Segmentation

By Technology

Segment Key Metric Primary Demand Driver
Retinal Prosthesis 54.2% share (2025) Established surgical protocols and FDA approvals
Cortical Visual Prosthesis 13.2% CAGR (2026–2035) Broader patient eligibility beyond retinal disease
Optic-Nerve Prosthesis USD 28.96 Million (2025) Niche trauma-indication use cases


Retinal prosthesis dominates the Bionic Eye Market on installed base, with the Argus II system having accumulated the longest real-world evidence dataset among commercial visual prosthetics. Epiretinal and subretinal configurations each serve distinct pathologies — epiretinal designs interface with ganglion cells and suit retinitis pigmentosa patients. In contrast, subretinal photovoltaic arrays target dry AMD by stimulating bipolar cells directly. Surgical familiarity and existing reimbursement codes sustain retinal prosthesis dominance through the near term.

Cortical visual prosthesis is the fastest-growing technology segment in the Bionic Eye Market, driven by its ability to restore rudimentary vision in patients with complete retinal or optic-nerve destruction. The Monash Gennaris system and Cortigent's Orion device are the two furthest-advanced cortical platforms, each targeting 60+ electrode channels in pivotal-phase trials [7]. Successful commercialization would meaningfully expand the addressable population beyond the current retinal-disease-only boundary.

By Device Placement

Segment Key Metric Primary Demand Driver
External Wearable Systems 69.4% share (2025) Lower surgical invasiveness and cost
Fully Implantable Systems 13.1% CAGR (2026–2035) Wireless power maturation, cosmetic preference


External wearable configurations — comprising a glasses-mounted camera, an external video processing unit, and a wireless transmitter — remain the default architecture in the Bionic Eye Market because they minimize intraocular hardware and simplify device servicing. Fully implantable systems, however, are gaining share as wireless power coupling exceeds 85% efficiency and application-specific integrated circuits (ASICs) shrink processing hardware to sub-cubic-centimeter volumes [3].

By Component

Segment Key Metric Primary Demand Driver
Micro-Electronic Array & Sensors 44.4% share (2025) Core functional element of all device architectures
Power & Telemetry Modules 13.3% CAGR (2026–2035) Wireless charging and data-link innovation
Video Processing Units USD 61.52 Million (2025) AI-enhanced image preprocessing
Surgical Accessories & Implant Tools 8.6% share (2025) Single-use instrument kits for sterile procedures


Micro-electronic arrays constitute the technological core of every bionic-eye platform, and their share of the Bionic Eye Market component mix reflects both high unit value and intensive R&D investment. Power and telemetry modules are growing fastest as the industry transitions away from percutaneous cable connections, with resonant inductive coupling and infrared optical power transfer emerging as competing standards.

By End-User

Segment Key Metric Primary Demand Driver
Hospitals & Eye-Care Chains 48.9% share (2025) Primary implantation and post-op rehabilitation setting
Ophthalmology Clinics USD 88.47 Million (2025) Outpatient follow-up and device calibration
Academic & Research Institutes 13.4% CAGR (2026–2035) Clinical-trial hosting and surgeon training


Hospitals and integrated eye-care chains anchor the Bionic Eye Market end-user landscape because bionic-eye implantation requires full operating-room infrastructure, anesthesiology support, and vitreoretinal surgical expertise. Academic medical centers drive the highest growth rate as they serve as pivotal-trial sites and training hubs, creating a flywheel where surgical volume builds institutional expertise that attracts additional trial sponsors.


Regional Market Share Analysis

Region Key Metric Primary Investment Themes
North America 44.6% share (2025) Medicare reimbursement expansion, NIH BRAIN Initiative funding
Europe 27.3% share (2025) Horizon Europe grants, NHS pilot adoption programs
Asia-Pacific 13.5% CAGR (2026–2035) Government subsidy programs, ophthalmic-capacity buildout
South America USD 17.22 Million (2025) Public-hospital procurement tenders
Middle East & Africa 3.5% share (2025) Medical-tourism hubs, philanthropic funding
Total USD 382.80 Million (2025)

The Bionic Eye Market concentrates in regions with advanced ophthalmic surgical infrastructure, robust payer frameworks, and active clinical-trial ecosystems, though emerging regions are accelerating investment. North America leads the market, and Asia-Pacific is the fastest-growing region in this market.


North America

Country Key Metric Key Driver
US 78.4% of regional share CMS reimbursement codes CPT 0100T–0101T [6]
Canada 13.8% of regional share CIHR neural-interface grants [15]
Mexico USD 13.32 Million (2025) Medical-tourism ophthalmology clusters


The US dominates the North American Bionic Eye Market through a combination of Medicare Part B coverage for FDA-approved visual prosthetics, the highest concentration of retinal-surgery fellowship programs globally, and NIH grant pipelines that fund early-stage device development through to pivotal trials. Canada's contribution centers on university-hospital research collaborations, particularly at the University of Toronto and McGill, while Mexico's private ophthalmology clinics in Monterrey and Guadalajara serve as lower-cost implantation sites attracting cross-border patients.

Europe

Country Key Metric Key Driver
Germany 10.1% CAGR (2026–2035) Fraunhofer micro-electronics R&D [9]
UK 24.8% of regional share NHS Innovation Accelerator pilot [17]
France USD 12.41 Million (2025) CEA-Leti photovoltaic implant program [18]
Italy 11.2% of regional share San Raffaele Hospital implant center [14]
Spain USD 5.18 Million (2025) ISCIII retinal research grants [9]
Nordic Countries 8.7% of regional share Universal healthcare coverage advantage [9]
Russia USD 3.95 Million (2025) Limited domestic manufacturing capacity
Rest of Europe 12.6% of regional share EU cross-border patient directive [9]


Europe's Bionic Eye Market benefits from universal-coverage health systems that reduce patient cost exposure, complemented by Horizon Europe neurotechnology grants totaling EUR 120 Million for 2021–2027 [9]. The UK's NHS Innovation Accelerator has fast-tracked evaluations of two bionic-eye platforms since 2023, while Germany's Fraunhofer Institute contributes world-leading micro-fabrication capabilities for electrode arrays. France anchors the photovoltaic-subretinal segment through CEA-Leti's collaboration with Pixium Vision.

Asia-Pacific

Country Key Metric Key Driver
China 14.2% CAGR (2026–2035) 14th Five-Year Plan neurotechnology funding [8]
India USD 6.84 Million (2025) NPCB blindness-prevention budget reallocation [8]
Japan 21.5% of regional share AMED regenerative-medicine integration [19]
South Korea 11.9% of regional share KIST brain-machine interface program [19]
ASEAN USD 4.52 Million (2025) Medical-tourism ophthalmology growth
Rest of Asia-Pacific 8.4% of regional share Academic research partnerships [19]


Asia-Pacific represents the fastest-growing corridor in the Bionic Eye Market, propelled by China's national medical-device innovation fund and India's expanding public-hospital ophthalmic infrastructure. Japan's AMED agency supports hybrid approaches combining regenerative cell therapies with electronic implants, positioning the country as a leader in next-generation integration strategies. South Korea's KIST brain-machine interface program provides foundational neuroscience research that feeds into commercial device development.

South America

Country Key Metric Key Driver
Brazil 58.3% of regional share SUS public-hospital procurement
Argentina USD 3.10 Million (2025) University-hospital trial participation
Rest of South America 18.7% of regional share Philanthropic surgical missions


Brazil's SUS (Unified Health System) represents the primary procurement channel for the South American Bionic Eye Market. However, classification of visual prosthetics as experimental by the ANS regulatory body continues to limit private-insurance-driven demand. Clinical trial participation at Hospital das Clínicas in São Paulo provides patient access outside reimbursement channels.

Middle East & Africa

Country Key Metric Key Driver
Saudi Arabia 29.1% of regional share Vision 2030 healthcare investment [20]
UAE USD 3.78 Million (2025) Medical-tourism hub positioning [20]
South Africa 18.5% of regional share Groote Schuur ophthalmic surgery center
Egypt USD 1.52 Million (2025) Magdi Yacoub Foundation partnerships
Rest of MEA 21.3% of regional share NGO-funded blindness programs


The MEA Bionic Eye Market remains nascent but strategically important. Saudi Arabia's Vision 2030 healthcare modernization program has earmarked USD 65 billion for advanced medical infrastructure, and the UAE's free-zone hospital clusters in Dubai Health City attract medical-tourism patients from across the Gulf region [20]. Sub-Saharan Africa relies primarily on philanthropic surgical missions and WHO-affiliated blindness-prevention initiatives for patient access.


Bionic Eye Market By Region, 2025-2035

Competitive Benchmarking

The Bionic Eye Market exhibits moderate concentration, with an estimated top-five share of 55–60% and a Herfindahl-Hirschman Index (HHI) in the 1,200–1,500 range — indicative of a moderately concentrated market where precision manufacturing barriers, regulatory scrutiny, and surgical-training requirements deter rapid new entry. Competition centers on electrode resolution, power efficiency, form factor, and clinical evidence depth rather than price.

Company Est. Revenue Share Range Key Offerings for the Bionic Eye Market Strategic Positioning
Second Sight Medical Products ~12–16% Argus II retinal prosthesis system Largest installed base; US-market pioneer
Cortigent Inc. ~8–11% Orion cortical visual prosthesis Cortical-pathway leader; FDA Breakthrough designation
Pixium Vision ~7–10% PRIMA subretinal photovoltaic system Photovoltaic architecture; EU-first launch strategy
Bionic Vision Technologies ~5–8% Bionic eye suprachoroidal array Australian research consortium commercialization
Science Corporation ~4–7% Science Eye cortical platform High-channel-count cortical design; VC-backed
Nano Retina (Nuvision Bio) ~4–6% NR600 subretinal implant Miniaturized, fully implantable design
GenSight Biologics ~3–5% GS030 optogenetic + electronic hybrid Gene-therapy-device convergence strategy
Retina Implant AG ~3–5% Alpha AMS subretinal chip German engineering; subretinal micro-photodiode array
Monash Vision Group ~2–4% Gennaris cortical implant Academic-to-commercial pathway; ARC funding
Bionode ~2–3% Neural-interface electrode systems Electrode technology supplier across platforms


Recent News & Developments


  • Bayer- (May, 2026)—Bayer announced its acquisition of the PER-001 retina program from Perfuse Therapeutics to expand its pipeline for ischemia-driven retinal diseases.


  • Science Corporation- (March, 2026)—Following successful international clinical trials of the PRIMA retinal implant, the company officially submitted applications for regulatory approval in the US and Europe.


  • Neuralink- (July 2025)—Neuralink partnered with a University of California-led clinical trial to advance its "Blindsight" smart bionic eye technology toward its first human implants.


Bionic Eye Market Report Scope

Parameter Details
Market Scope Global Bionic Eye Market covering retinal, cortical, and optic-nerve prosthetic devices
Study Period 2021–2035
CAGR 12.4% (2026–2035)
Base Year Market Size USD 382.80 Million (2025)
Forecast Endpoint USD 1,245.00 Million (2035)
Fastest Growing Segment Cortical Visual Prosthesis (Technology); Academic & Research Institutes (End-User); Asia-Pacific (Region)
Companies Profiled 10 (Second Sight, Cortigent, Pixium Vision, Bionic Vision Technologies, Science Corporation, Nano Retina, GenSight Biologics, Retina Implant AG, Monash Vision Group, Bionode)
Valuation Currency USD Million


FAQs

What minimum visual acuity can current bionic-eye devices restore?
Current devices restore light-and-shadow perception equivalent to roughly 20/1260 visual acuity, sufficient for doorway detection and large-object navigation but not reading-level resolution [3]. Next-generation high-density arrays target 20/200 thresholds.
How long does a bionic-eye implant typically last before replacement is needed?
Clinical data show median implant longevity of 7–10 years, with hermetic encapsulation improvements extending projections beyond 12 years for newer designs [13]. Battery-free photovoltaic architectures may further extend device life.
Which patient conditions are currently excluded from bionic-eye candidacy?
Patients with complete optic-nerve atrophy, congenital blindness without prior visual cortex development, or active ocular infections are excluded from retinal prosthesis candidacy [7]. Cortical devices may eventually serve some of these populations.
What role do clinical trial registries play in evaluating competing bionic-eye platforms?
ClinicalTrials.gov and the EU Clinical Trials Register list active enrollment status, endpoint design, and preliminary safety data, allowing hospitals to benchmark platforms before procurement decisions [6].
How do hospitals typically finance bionic-eye procedures for uninsured patients?
Hospitals use manufacturer-sponsored compassionate-use programs, charitable foundations, and outcomes-based risk-sharing agreements to offset costs for uninsured patients [12].
What training pathway do surgeons require before performing bionic-eye implantation?
Surgeons complete a vitreoretinal fellowship followed by manufacturer-proctored cadaveric training and supervised live-case observation, typically totaling 12–18 months of specialized preparation [14].
How does electrode channel count influence functional visual outcomes?
Higher channel counts improve spatial resolution, but diminishing returns appear above approximately 100 channels due to current-spread overlap between adjacent electrodes [10]. Stimulation algorithms matter as much as hardware density.    
What is the current size of the bionic eye market?
The bionic eye market reached USD 382.80 million in 2025 and is projected to reach USD 1,245.00 million by 2035.
What is the CAGR of the bionic eye market?
The bionic eye market is projected to grow at a CAGR of 12.4% during the forecast period 2026–2035.
Which region leads the bionic eye market?
North America holds the largest share at 44.6%, while Asia-Pacific is the fastest-growing region at 13.5% CAGR.
Author
Author
Author Profile
Nidhi Mandole LinkedIn
Senior Research Analyst
She is an extremely curious individual currently working in Healthcare and Medical Devices Domain. Nidhi is comfortably versed in data centric research backed by healthcare educational background. She leverages extensive data mining and analytics tools such as Primary and Secondary Research, Statistical Analysis, Machine Learning, Data Modelling. Her key role also involves Technical Sales Support, Client Interaction and Project management within the Healthcare team. Lastly, she showcases extensive affinity towards learning new skills and remain fascinated in implementing them.
Co-Author
Co-Author Profile
Rahul Gotadki LinkedIn
Research Manager
He holds an experience of about 9+ years in Market Research and Business Consulting, working under the spectrum of Life Sciences and Healthcare domains. Rahul conceptualizes and implements a scalable business strategy and provides strategic leadership to the clients. His expertise lies in market estimation, competitive intelligence, pipeline analysis, customer assessment, etc.

Research Approach


Secondary Research

The secondary research process involved comprehensive analysis of regulatory databases, peer-reviewed ophthalmology and neuroprosthetics journals, clinical trial repositories, and authoritative health organizations. Key sources included:

Regulatory & Compliance Authorities:

US Food & Drug Administration (FDA), Center for Devices and Radiological Health (CDRH), Division of Ophthalmic, Neurological, and ENT Devices

European Medicines Agency (EMA) Medical Device Expert Panels and Orphan Medical Devices Pilot Program

Health Canada Medical Devices Directorate

Therapeutic Goods Administration (TGA), Australia

Pharmaceuticals and Medical Devices Agency (PMDA), Japan

Medicines and Healthcare products Regulatory Agency (MHRA), United Kingdom

National Medical Products Administration (NMPA), China

Clinical & Epidemiological Data Sources:

National Eye Institute (NEI/NIH) Ocular Epidemiology Program and NEI Data Commons

Centers for Disease Control and Prevention (CDC) Vision and Eye Health Surveillance System (VEHSS)

World Health Organization (WHO) Global Health Observatory and World Report on Vision

International Agency for the Prevention of Blindness (IAPB) Vision Atlas

National Center for Health Statistics (NCHS) Health Interview Survey Data

Vision Loss Expert Group (VLEG) Global Burden of Disease Study

ClinicalTrials.gov and EU Clinical Trials Register for active bionic eye device trials

Professional & Clinical Organizations:

American Academy of Ophthalmology (AAO) Intelligent Research in Sight (IRIS) Registry

European Society of Retina Specialists (EURETINA)

American Society of Retina Specialists (ASRS)

Association for Research in Vision and Ophthalmology (ARVO)

IEEE Engineering in Medicine and Biology Society (EMBS) Neuroprosthetics Technical Committee

International Council of Ophthalmology (ICO)

European Retina Forum

Market & Technology Intelligence:

Patent analysis databases (USPTO, EPO, WIPO) for retinal prosthetics and cortical visual prosthetics

IEEE Xplore Digital Library and PubMed/MEDLINE for neuroprosthetics research

Company annual reports, SEC filings (10-K, 10-Q), and investor presentations from publicly traded medical device manufacturers

Trade publications: Ophthalmology, Retina, Investigative Ophthalmology & Visual Science (IOVS), Journal of Neural Engineering

These sources were utilized to collect implant procedure statistics, regulatory approval pathways (Premarket Approval, Humanitarian Device Exemption, Breakthrough Devices), clinical safety and efficacy studies, prevalence data for retinitis pigmentosa and age-related macular degeneration, and competitive intelligence across retinal implants, cortical implants, and optic nerve prosthetics.


Primary Research

To gather qualitative and quantitative information unique to the development and uptake of visual prosthesis, supply-side and demand-side players were interviewed during the primary research process. CEOs, VPs of R&D, directors of regulatory affairs, and heads of commercial strategy from companies that manufacture bionic eyes, neuroprosthetics, and ocular implants were among the supply-side sources. Companies creating cortical visual prosthesis, wireless visual processing technologies, and retinal prostheses (epiretinal and subretinal) were represented by key participants.Demand-side sources included procurement leads from academic medical centers, tertiary eye care hospitals, and specialized vision rehabilitation centers, as well as vitreoretinal surgeons, neuro-ophthalmologists, ocular trauma experts, and medical directors of eye hospitals. Primary study obtained information on surgical adoption trends, reimbursement coding (CPT/HCPCS), and patient selection criteria in addition to validating market segmentation and clinical trial schedules.

Primary Respondent Breakdown:

By Designation: C-level Primaries (32%), Director Level (35%), Others (33%)

By Region: North America (38%), Europe (25%), Asia-Pacific (28%), Rest of World (9%)


Market Size Estimation

Global market valuation was derived through revenue mapping and implant procedure volume analysis specific to neuroprosthetic vision restoration devices. The methodology included:

Manufacturer Mapping: Identification of 35+ key manufacturers and emerging startups across North America, Europe, Asia-Pacific, and Israel, including developers of retinal prostheses (Argus II, Prima, Alpha AMS), cortical implants (Orion, Gennaris), and photovoltaic subretinal systems.

Product Categorization: Segmentation mapping across retinal implants (epiretinal vs. subretinal), optic nerve prosthetics, cortical visual prosthetics, and components (microelectrode arrays, external visual processors, telemetry modules, power units).

Revenue Analysis: Analysis of reported and modeled annual revenues specific to visual prosthetics portfolios, including direct device sales, accessories, maintenance contracts, and software upgrades.

Market Coverage: Coverage of manufacturers representing 75-80% of global market share in 2024, with particular focus on FDA-approved (PMA/HDE) and CE-marked devices.

Extrapolation Approaches: Bottom-up calculation (target patient population × implant penetration rate × average selling price by country/region) cross-validated with top-down manufacturer revenue validation to derive segment-specific valuations for retinitis pigmentosa, age-related macular degeneration, and other retinal degenerative indications.

Procedure Volume Validation: Cross-referencing of clinical registry data, hospital discharge records, and reimbursement claims to validate unit sales estimates for external wearable systems versus fully implantable configurations.

Download Free Sample

Kindly complete the form below to receive a free sample of this Report

Download PDF ×

We do not share your information with anyone. However, we may send you emails based on your report interest from time to time. You may contact us at any time to opt-out.
















