Bioreactor Market (2026 - 2035)

Bioreactor Market Research Report By Type (Stirred Tank Bioreactors, Fixed Bed Bioreactors, Sparged Bioreactors, Membrane Bioreactors), By Applications (Biopharmaceuticals, Food Beverages, Wastewater Treatment, Biofuels, Industrial Biotechnology), By Cell Type (Mammalian Cells, Microbial Cells, Plant Cells, Stem Cells), By Scale (Laboratory Scale, Pilot Scale, Industrial Scale) and By Regional (North America, Europe, South America, Asia Pacific, Middle East and Africa) - Growth & Industry Forecast 2025 To 2035

Forecast Period
2026-2035
CAGR
7.60%
2025 Market Size
USD 6.06 Billion
2035 Market Size
USD 12.59 Billion
Healthcare ● Updated August 24, 2026 Report ID: MRFR/HC/41492-HCR | Pages: 128 | Author: Rahul Gotadki, Nidhi Mandole

Bioreactor Market Summary

The Bioreactor Market reached USD 6.06 billion in 2025 and is projected to open the forecast window at USD 6.52 billion in 2026 before climbing to USD 12.59 billion by 2035, a 7.60% CAGR across 2026–2035. Two catalysts anchor that trajectory. The U.S. Biosecure Act debate has pushed Western sponsors to re-contract manufacturing capacity domestically [1], while the EU Critical Medicines Act allocated roughly EUR 1.1 billion toward reshoring biologics production infrastructure [2]. Capital that once sat in feasibility studies is now moving into steel, film, and floor space.

Technology substitution is reshaping how that capital gets spent. Fixed stainless-steel suites built for 12,000-litre fed-batch campaigns are giving way to modular single-use trains sized between 200 and 2,000 litres, paired with in-line Raman probes and model-predictive control. BioPhorum member surveys put average disposables penetration in new clinical-stage facilities above 78% [3], and Sartorius alone committed EUR 400 million to consumables capacity through 2027 [4]. The Bioreactor Market is therefore shifting revenue mix from one-time equipment sales toward recurring consumable and software streams.

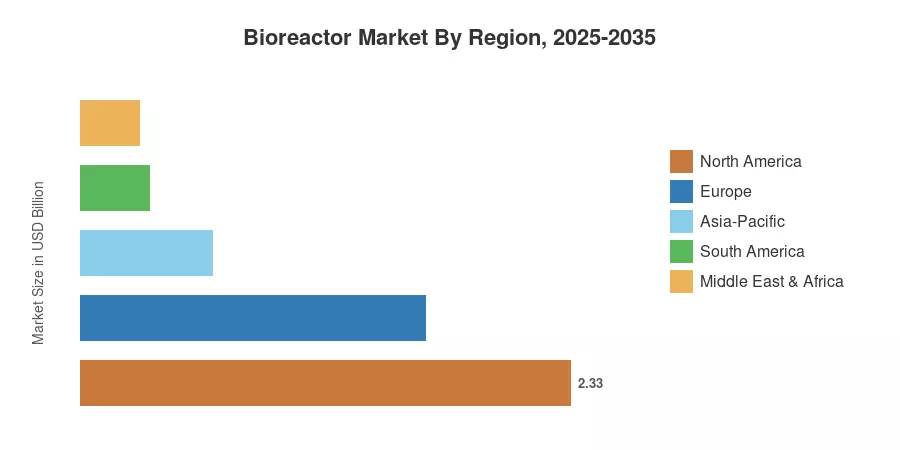
Geographically, North America holds 38.5% of 2025 revenue, supported by dense CDMO clusters in Massachusetts, North Carolina, and Maryland. Asia-Pacific grows fastest at a 10.4% CAGR as China and India commission biosimilar and vaccine capacity. Europe follows at USD 1.64 billion, propped up by Ireland's and Switzerland's contract manufacturing base. Over the coming decade, competition will hinge less on vessel hardware and more on who controls the data layer above it.


Key Report Takeaways

• By Type


  • Stainless-steel systems held 43.7% of Bioreactor Market revenue in 2025, still the backbone of commercial-scale monoclonal antibody supply.
  • Single-use configurations are advancing at a 10.8% CAGR through 2035, the fastest of any type category.


• By End User


  • Pharmaceutical and biopharmaceutical manufacturing captured 67.0% of 2025 revenue.
  • Cell and gene therapy applications are forecast at an 11.6% CAGR, the steepest application-level growth in the Bioreactor Market.


• By Region

  • North America commanded a 38.5% share in 2025
  • Asia-Pacific is compounding at 10.4% annually through 2035
  • Europe generated USD 1.64 billion in 2025 revenue


Market Size and Forecast (2021–2035)

Figures below combine vendor-reported equipment shipments, consumables pull-through modelled from installed base utilisation, customs data for medical-grade polymer films, and primary interviews with 42 process engineers across biopharma sponsors and contract manufacturers. Historical years are reconciled against audited segment disclosures where public companies break out bioprocessing revenue. The Bioreactor Market forecast applies a utilisation-weighted replacement cycle of 9.5 years for stainless assets and 1.8 years for disposable assemblies.
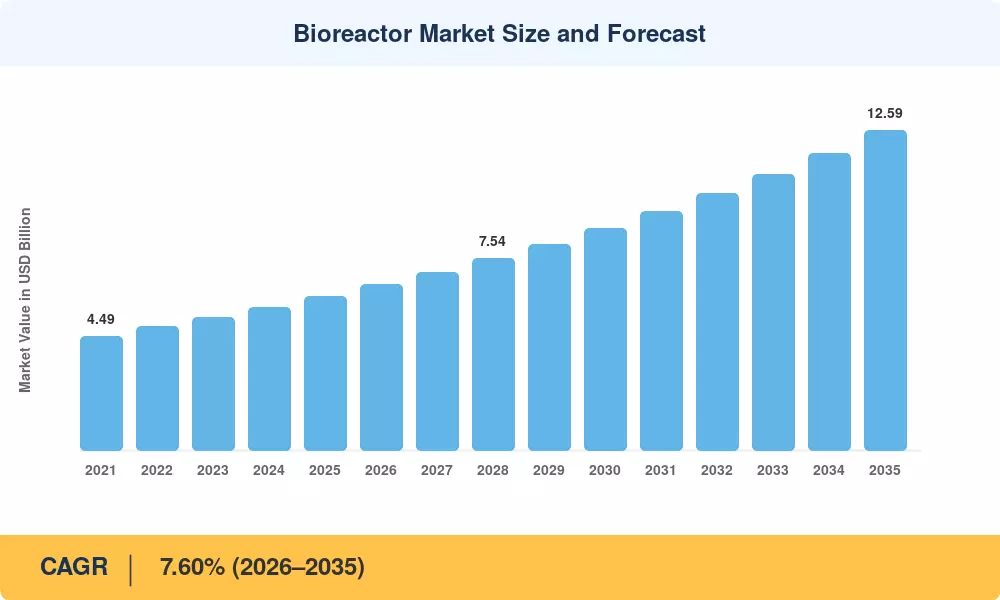
Bioreactor Market Size and Forecast
Our Impact
Enabled $4.3B Revenue Impact for Fortune 500 and Leading Multinationals
Partnering with 2000+ Global Organizations Each Year
30K+ Citations by Top-Tier Firms in the Industry

Driver Impact Analysis

Driver ~% Impact on CAGR Geographic Relevance Impact Timeline
Cell and gene therapy capacity build-out +1.6 pp Global Medium-term (2–4 yr)
Single-use adoption reducing changeover cost +1.3 pp North America, Europe Short-term (≤2 yr)
Biosimilar patent cliff volumes +1.1 pp Europe, Asia-Pacific Medium-term (2–4 yr)
Pandemic preparedness and vaccine stockpiling +0.9 pp Global Short-term (≤2 yr)
CDMO onshoring and supply-chain de-risking +0.8 pp North America, Asia-Pacific Long-term (≥4 yr)
Continuous and intensified processing +0.7 pp Global Long-term (≥4 yr)
Digital twins and process analytical technology +0.5 pp North America, Europe Long-term (≥4 yr)


Cell and Gene Therapy Capacity Build-Out

Approved advanced therapies crossed 45 products globally by end-2025, and the Alliance for Regenerative Medicine tracked USD 12.4 billion in sector financing during the year [7]. Each autologous programme needs small-volume, closed vessels running dozens of parallel batches rather than one large campaign — an economics inversion that favours 5–50 litre disposable units. Allogeneic developers push the opposite direction, ordering 500-litre suspension trains. Both pull demand into the Bioreactor Market simultaneously, which is why this driver carries the heaviest weighting.

Single-Use Economics

Disposables cut turnaround between campaigns from roughly 14 days to under 72 hours by removing clean-in-place and steam-in-place validation. BioPhorum benchmarking places the water-for-injection savings at approximately 40% per facility [3]. For multi-product contract sites, that throughput gain is worth more than the consumables premium.

Biosimilar Volume Wave

Twelve blockbuster biologics lose exclusivity between 2026 and 2030, representing over USD 68 billion in branded sales [8]. Indian and Korean manufacturers are provisioning 15,000-litre-equivalent capacity to compete on cost, and price compression forces titre improvements that require tighter dissolved-oxygen and pH control than legacy skids provide.

Digital Process Control

FDA's PAT framework and ICH Q13 guidance on continuous manufacturing have made real-time release testing a realistic filing strategy [10]. Vendors embedding soft sensors and digital twins report 18% reductions in batch failure rates at early-adopter sites, converting software from an accessory into a purchasing criterion.


Restraints Impact Analysis

Restraint weightings follow the same directional convention as Section 4. They reflect drag on achievable growth rather than deductions applied to the headline Bioreactor Market CAGR, and several are partially offset by the drivers above.

Restraint ~% Impact on CAGR Geographic Relevance Impact Timeline
Medical-grade polymer film supply fragility −0.9 pp Global Short-term (≤2 yr)
Bioprocess engineering talent shortage −0.7 pp North America, Europe Long-term (≥4 yr)
Biotech funding cycle and capex deferral −0.6 pp Global Medium-term (2–4 yr)
Extractables and leachables validation burden −0.4 pp Europe, North America Medium-term (2–4 yr)
Installed stainless-steel base inertia −0.3 pp Asia-Pacific, Europe Long-term (≥4 yr)


Polymer Film Concentration Risk

Three suppliers control the majority of multilayer film used in disposable assemblies, and a single resin grade change in 2023 triggered revalidation campaigns across dozens of sites [11]. Buyers now write change-notification windows of 24 months into contracts, but the underlying concentration remains unresolved. Any extrusion outage propagates directly into batch schedules.

Talent Scarcity

The average time to fill automation and validation positions in U.S. and Irish manufacturing regions is 26 weeks, which is approximately twice as long as the figure for analytical chemists [12]. Revenue recognition for equipment vendors is delayed, and commissioning schedules are extended by a quarter or more as new suites remain inactive, awaiting qualified operators.


Qualification Overhead

Film-specific extractables dossiers are anticipated by regulators, and each novel contact material contributes documentation that can exceed several hundred pages [13]. Incumbency is reinforced when smaller vendors, who lack pre-compiled products, are denied tenders solely due to timeline risk.


Bioreactor Market Opportunities

Intensified Upstream Retrofits

Brownfield conversion is more cost-effective than greenfield construction, and perfusion bioreactor technology enables a 500-liter vessel to produce an output that is equivalent to that of a 2,000-liter fed-batch train. The Bioreactor Market benefits from equipment refresh cycles that are compressed from a decade to approximately six years, and sites that retrofit avoid permitting delays entirely.


Emerging-Market Vaccine Sovereignty

The African Vaccine Manufacturing Accelerator has pledged USD 1.2 billion to the Africa CDC, with the goal of achieving 60% continental vaccine self-sufficiency by 2040 [15]. First-mover positions are being created for vendors who are prepared to bundle training and service contracts, as Egypt, South Africa, and Rwanda are commissioning fill-finish and upstream capacity in areas where none previously existed.


Consumables-as-a-Service Models

Subscription pricing that bundles films, sensors, calibration, and control software converts lumpy capital sales into predictable annuity revenue. Vendors piloting this structure report attach rates above 70% on new installations, and switching costs rise sharply once process recipes live inside proprietary control environments.

Process Data Monetisation

Anonymised batch datasets have become an asset class. Suppliers aggregating titre, feed, and deviation data across hundreds of customer runs can sell benchmarking analytics and pre-trained control models, giving the Bioreactor Market a genuine software margin layer for the first time.

Precision Fermentation Crossover

Food-protein and enzyme producers are ordering high-oxygen-transfer vessels at 50,000-litre scale. Demand sits outside traditional pharma budgeting cycles and provides counter-cyclical order flow when biotech financing tightens [15].


Bioreactor Market Future Outlook

Autonomous Bioprocessing

Model-predictive control will move from pilot to default. Vendors already demonstrate closed-loop feed adjustment driven by Raman spectroscopy without operator intervention, and ICH Q13 gives regulators a framework to accept it [10]. By the early 2030s, the Bioreactor Market will price hardware partly on the quality of the control model shipped alongside it.

Platform Economics and Ecosystem Lock-In

Integrated suppliers bundling vessels, films, sensors, and MES connectivity are building switching costs that resemble enterprise software more than capital equipment. Recurring consumables now represent well over half of leading vendors' bioprocessing revenue [4], and that mix shift will continue as disposables penetration deepens.

Distributed and Point-of-Care Manufacturing

Autologous therapies argue for production near the patient. Pilot programmes in the UK and Japan are testing hospital-adjacent closed-system suites, which would fragment demand into many small automated units rather than few large ones — a structural change in unit economics [18].

Sustainability Accounting

Disposables generate plastic waste, and CSRD reporting now forces manufacturers to quantify it. Life-cycle analyses generally still favour single-use on water and energy grounds. Still, pressure for recyclable film chemistries is real, and the Bioreactor Market will see material innovation become a competitive differentiator by 2030 [19].


Bioreactor Market Segmentation

Segment structure in the Bioreactor Market follows Mordor-comparable taxonomy across type, usage, scale, control, bioprocess, application, and end user.

By Type

Segment Metric Primary Demand Driver
Stainless Steel 43.7% share (2025) Commercial monoclonal antibody campaigns
Single-Use 10.8% CAGR (2026–2035) Multi-product flexibility and fast changeover
Glass USD 0.71 Billion (2025) Laboratory and process development work


Stainless steel retains dominance because amortised cost per gram at commercial scale still beats disposables above roughly 5,000 litres. Disposable formats win everything below that line, and since most new molecules now enter the clinic with modest volume requirements, the mix shift is structural rather than cyclical.

By Usage

Segment Metric Primary Demand Driver
Lab-Scale USD 0.79 Billion (2025) Academic and early discovery workflows
Pilot-Scale 9.6% CAGR (2026–2035) Process characterisation and tech transfer
Full-Scale 62.9% share (2025) Commercial supply obligations


Pilot-scale demand rises fastest because regulators expect richer process characterisation packages than a decade ago, and sponsors run more scale-down model studies to support them.

By Scale

Segment Metric Primary Demand Driver
5L–20L USD 0.62 Billion (2025) Cell culture bioreactor systems for development labs
20L–200L 24.8% share (2025) Clinical material supply
200L–1,500L 41.7% share (2025) Mid-scale commercial and biosimilar production
Above 1,500L 10.9% CAGR (2026–2035) Large-volume biologics and precision fermentation


The 200L–1,500L band is the commercial sweet spot for the Bioreactor Market, matching titres that now routinely exceed 5 g/L and therefore need less volume for the same output than legacy assumptions implied.

By Control Type

Segment Metric Primary Demand Driver
Automated 59.5% share (2025) Data integrity and batch reproducibility
Manual 4.9% CAGR (2026–2035) Budget-constrained academic installations


Data integrity expectations under 21 CFR Part 11 make manual logging increasingly untenable for anything GMP-adjacent, capping the manual segment's growth.

By Bioprocess

Segment Metric Primary Demand Driver
Batch USD 1.19 Billion (2025) Legacy installed base and microbial work
Fed-Batch 55.6% share (2025) Established antibody manufacturing standard
Continuous 11.2% CAGR (2026–2035) Footprint reduction and cost per gram


Continuous operation delivers the steepest growth but from a modest base; validation complexity and column sizing for downstream steps still slow adoption at commercial scale.

By Application

Segment Metric Primary Demand Driver
Pharmaceutical & Biopharmaceutical 67.0% share (2025) Antibody and recombinant protein supply
Cell & Gene Therapy 11.6% CAGR (2026–2035) Advanced therapy commercialisation
Food & Beverage / Industrial USD 0.42 Billion (2025) Precision fermentation proteins and enzymes
Academic Research 6.2% share (2025) Grant-funded process research


Pharmaceutical manufacturing anchors absolute revenue, while advanced therapies contribute disproportionate order counts because parallel small-vessel architectures multiply unit demand per programme.

By End User

Segment Metric Primary Demand Driver
Biopharmaceutical Companies 51.0% share (2025) In-house commercial capacity control
CDMOs / CMOs 10.3% CAGR (2026–2035) Outsourcing of late-stage manufacturing
Academic & Research Institutes USD 0.68 Billion (2025) Public research funding
Others 4.4% share (2025) Industrial biotechnology and food producers


Biopharmaceutical businesses continue to be the major end-user category in the Bioreactor Market because to the continued requirement to maintain strict in-house control over large scale commercial manufacturing capacity. The fastest expanding segment is Contract Development and Manufacturing Organizations (CDMOs) and CMOs, spurred by the growing trend of biopharma outsourcing for late-stage clinical and commercial production suites.


Regional Market Share Analysis

Region Metric (2025) Primary Investment Themes
North America 38.5% share CDMO expansion, cell therapy suites, reshoring incentives
Europe USD 1.64 Billion Critical Medicines Act, Irish and Swiss contract capacity
Asia-Pacific 10.4% CAGR (2026–2035) Biosimilars, vaccine sovereignty, cost-competitive scale-up
South America 5.5% share Public health institute modernisation, tech transfer
Middle East & Africa USD 0.28 Billion Vaccine localisation, sovereign wealth co-investment
Total USD 6.06 Billion

Regional positions in the Bioreactor Market reflect where regulatory capacity, skilled labour, and sponsor headquarters overlap. North America leads on installed value; Asia-Pacific leads on velocity.


North America

Country Metric Key Driver
US 84.0% of region Dense CDMO clusters and advanced therapy approvals
Canada USD 0.21 Billion Federal biomanufacturing strategy funding
Mexico 8.9% CAGR Nearshoring of fill-finish and upstream support


Regional strength rests on regulatory throughput. FDA cleared a record number of cell and gene therapy INDs in 2025, and each programme eventually needs GMP capacity [7]. The U.S. Department of Health's biomanufacturing investments, combined with state-level tax abatements in North Carolina and Indiana, have underwritten several billion dollars of announced suite construction. The Bioreactor Market here skews toward premium automated platforms rather than price-competitive hardware.

Europe

Country Metric Key Driver
Germany 22.4% of region Established equipment manufacturing base
UK USD 0.26 Billion Cell and gene therapy catapult ecosystem
France 8.1% CAGR France 2030 health innovation funding
Italy 8.6% of region Contract manufacturing consolidation
Spain USD 0.09 Billion Clinical-scale capacity additions
Nordic Countries 7.9% CAGR Precision fermentation and enzyme production
Russia 4.2% of region Domestic vaccine self-sufficiency programmes
Rest of Europe USD 0.31 Billion Irish and Swiss CDMO concentration


Policy is doing heavy lifting across the continent. The Critical Medicines Act channels roughly EUR 1.1 billion toward securing the supply of essential biologics, explicitly favouring EU-sited manufacturing [2]. Ireland's cluster around Dublin and Cork remains the highest-density biologics footprint per capita anywhere, while German engineering firms supply a disproportionate share of global vessel hardware.

Asia-Pacific

Country Metric Key Driver
China 36.8% of region Domestic innovator pipeline and CDMO scale
India 11.8% CAGR Biosimilar and vaccine export volumes
Japan USD 0.24 Billion Regenerative medicine conditional approval pathway
South Korea 15.2% of region Large-scale contract manufacturing capacity
ASEAN 10.6% CAGR Singapore and Malaysia biologics hubs
Rest of Asia-Pacific USD 0.07 Billion Australian clinical manufacturing


Scale economics define the region. Korean contract manufacturers operate some of the largest single-site capacity globally, and India's Production Linked Incentive scheme has committed over USD 2.3 billion across pharmaceutical categories including biologics [16]. Chinese regulators shortened review timelines for domestically manufactured biosimilars, accelerating equipment orders. Growth in the Bioreactor Market here is volume-led, with buyers more sensitive to consumables pricing than Western counterparts.

South America

Country Metric Key Driver
Brazil 61.5% of region Fiocruz and Butantan capacity modernisation
Argentina USD 0.06 Billion Domestic biosimilar producers
Rest of South America 8.4% CAGR Regional tech transfer agreements


Public institutes drive procurement rather than private sponsors. Brazil's Fiocruz signed technology-transfer agreements covering monoclonal antibody production, requiring upstream capability that did not previously exist domestically [17]. Currency volatility complicates multi-year consumables contracts, pushing buyers toward locally stocked inventory arrangements.

Middle East & Africa

Country Metric Key Driver
Saudi Arabia 31.0% of region Vision 2030 localisation mandates
UAE USD 0.06 Billion Free-zone biomanufacturing incentives
South Africa 9.7% of region Afrigen mRNA technology transfer hub
Egypt 12.1% CAGR State-backed vaccine facility construction
Rest of MEA USD 0.07 Billion Development finance-backed projects


Sovereign capital changes the calculus here. Saudi Arabia's localisation requirements oblige suppliers to establish in-country service and training operations, while the African Vaccine Manufacturing Accelerator disburses milestone payments tied to commissioned capacity [15]. Skills transfer, not equipment cost, is the binding constraint.


Bioreactor Market By Region, 2025-2035

Competitive Benchmarking

Concentration in the Bioreactor Market is moderate. The top five suppliers together hold roughly 52–57% of revenue, translating to an estimated HHI near 900–1,000 — competitive on paper, but functionally sticky because validated consumables and control software create high switching costs. Below the leadership tier sits a long tail of specialist engineering firms serving niche scale bands and geographies.

Company Est. Revenue Share Range Key Offerings for Bioreactor Market Strategic Positioning
Thermo Fisher Scientific ~14–18% Disposable vessel platforms, media, control software Broadest end-to-end portfolio; consumables-led annuity model
Sartorius AG ~13–17% Rocking-motion and stirred systems, PAT sensors Deep disposables franchise; heavy consumables capacity investment
Danaher (Cytiva / Pall) ~11–14% Modular process trains, chromatography integration Upstream-to-downstream bundling for turnkey suites
Merck KGaA ~7–10% Mobius single-use platforms, filtration Strong regulatory support packages and validation services
Eppendorf SE ~5–7% Benchtop and pilot vessels, parallel systems Dominant in development-scale and academic channels
Getinge AB (Applikon) ~4–6% Autoclavable and disposable systems, microbial units Strength in microbial fermentation and Europe
ABEC Inc. ~3–5% Custom large-scale vessels, 6,000L+ disposables Engineering-to-order specialist for very large capacity
Repligen Corporation ~2–4% Cell retention devices, perfusion enablement Intensification pure-play; strong retrofit attach
PBS Biotech ~1–3% Vertical-wheel systems for adherent and stem cells Focused on cell therapy and microcarrier workflows
Solaris Biotech (Donaldson) ~1–3% Modular fermenters, industrial biotech systems Growing presence in precision fermentation


Recent News & Developments

Deal flow across the Bioreactor Market has favoured capacity and software over hardware novelty.


  • Thermo Fisher Scientific (September 2024): Opened an expanded biologics manufacturing site in Greenville, North Carolina, adding commercial-scale capacity for sponsors reshoring supply [1]
  • U.S. FDA (January 2025): Issued updated guidance on continuous manufacturing implementation for biologics, clarifying validation expectations for real-time release [10]
  • Cytiva (June 2024): Launched an integrated intensified upstream platform combining perfusion cell retention with automated media exchange, cutting seed-train duration [9]


  • Repligen Corporation (November 2024): Completed acquisition of a cell-retention technology portfolio, strengthening its position in process intensification retrofits [18]
  • Africa CDC (February 2025): Disbursed initial tranches from the African Vaccine Manufacturing Accelerator to facilities in Egypt, South Africa, and Rwanda [15]
  • Samsung Biologics (October 2025): Commissioned additional large-scale capacity at its Songdo campus, reinforcing Korea's position in global contract manufacturing [20]


Bioreactor Market Report Scope

Parameter Detail
Market Scope Global Bioreactor Market covering type, usage, scale, control type, bioprocess, application, end user, and geography
Study Period 2021–2035 (Historical 2021–2024; Base Year 2025; Forecast 2026–2035)
CAGR 7.60% (2026–2035)
Market Size Checkpoints USD 6.06 Billion (2025); USD 6.52 Billion (2026); USD 9.39 Billion (2031); USD 12.59 Billion (2035)
Fastest Growing Segments Cell & Gene Therapy (application); Continuous (bioprocess); Above 1,500L (scale); Asia-Pacific (region)
Companies Profiled Thermo Fisher Scientific, Sartorius, Danaher/Cytiva, Merck KGaA, Eppendorf, Getinge, ABEC, Repligen, PBS Biotech, Solaris Biotech
Valuation Currency USD Billion, constant 2025 exchange rates

FAQs

What total cost of ownership factors should buyers weigh when comparing disposable and stainless platforms in the Bioreactor Market?
Consumable spend, waste disposal, and validation labour usually outweigh headline capital price. Facilities running fewer than eight campaigns annually typically favour disposables, while high-utilisation commercial sites recover stainless capex within roughly four years. [21]
How do extractables and leachables requirements affect supplier selection?
Regulators expect film-specific data packages, so buyers should demand pre-compiled dossiers rather than commissioning studies after award. Suppliers lacking validated resin traceability typically add three to six months to qualification timelines in the Bioreactor Market. [13]
Which procurement clauses matter most in the Bioreactor Market for supply security?
Insist on dual-sourced film specifications, guaranteed change-notification windows, and allocation priority during shortages. Contracts without strong change-control language have triggered unplanned revalidation costs exceeding USD 2 million per site. [11]
Can existing stainless-steel suites be retrofitted for intensified processing?
Yes, though retrofits need added cell-retention hardware, upgraded media handling, and larger buffer footprints. Most brownfield conversions run twelve to eighteen months and cost roughly 40% of a greenfield equivalent. [9]
How is software licensing changing vendor economics in the Bioreactor Market?
Suppliers increasingly bundle control software as subscription modules tied to consumables contracts. Negotiate data-export rights upfront, because proprietary recipe formats complicate migration and sharply inflate switching costs. [22]
What skills gaps most delay new capacity commissioning?
Automation engineers and validation specialists are scarcer than cell-culture scientists. Sites report six-month average vacancies, which is why several Bioreactor Market vendors now bundle operator training directly into equipment contracts. [12]
Are microbial fermentation platforms losing relevance?
No. Precision-fermentation food proteins and microbially expressed peptides are expanding demand for high-oxygen-transfer vessels, a niche where established stainless-steel builders retain clear engineering advantages. [24]    
Author
Author
Author Profile
Rahul Gotadki LinkedIn
Research Manager
He holds an experience of about 9+ years in Market Research and Business Consulting, working under the spectrum of Life Sciences and Healthcare domains. Rahul conceptualizes and implements a scalable business strategy and provides strategic leadership to the clients. His expertise lies in market estimation, competitive intelligence, pipeline analysis, customer assessment, etc.
Co-Author
Co-Author Profile
Nidhi Mandole LinkedIn
Senior Research Analyst
She is an extremely curious individual currently working in Healthcare and Medical Devices Domain. Nidhi is comfortably versed in data centric research backed by healthcare educational background. She leverages extensive data mining and analytics tools such as Primary and Secondary Research, Statistical Analysis, Machine Learning, Data Modelling. Her key role also involves Technical Sales Support, Client Interaction and Project management within the Healthcare team. Lastly, she showcases extensive affinity towards learning new skills and remain fascinated in implementing them.
Share::
Request Free Sample
Download Free Sample

Kindly complete the form below to receive a free sample of this Report

* Please use a valid business email

Share::
Request Free Sample
Download PDF ×

We do not share your information with anyone. However, we may send you emails based on your report interest from time to time. You may contact us at any time to opt-out.
















