Download Free Sample
Kindly complete the form below to receive a free sample of this Report
Bioremediation Wastewater Treatment Services Market Research Report By End Use (Municipal Wastewater Treatment, Industrial Wastewater Treatment, Agricultural Wastewater Treatment, Mining Wastewater Treatment), By Technology (Aerobic Treatment, Anaerobic Treatment, Phytoremediation, Bioaugmentation, Biostimulation), By Application (Oil Spill Cleanup, Heavy Metal Removal, Nutrient Removal, Pesticide Degradation, Pharmaceutical Degradation) And By Region (North America, Europe, Asia-Pacific, And Rest Of The World) – Market Forecast Till 2035.
As per MRFR analysis, the Bioremediation Wastewater Treatment Services Market was estimated at 6.5 USD Billion in 2024. The bioremediation industry is projected to grow from 6.87 in 2025 to 12.0 by 2035, exhibiting a compound annual growth rate (CAGR) of 5.73% during the forecast period 2025 - 2035.
The Bioremediation Wastewater Treatment Services Market is experiencing robust growth driven by environmental concerns and technological advancements.
| 2024 Market Size | 6.5 (USD Billion) |
| 2035 Market Size | 12.0 (USD Billion) |
| CAGR (2025 - 2035) | 5.73% |
Veolia Environnement (FR), SUEZ (FR), Xylem Inc. (US), Ecolab Inc. (US), Bioremediation Technologies Inc. (US), Clean Harbors Inc. (US), Envirogen Technologies Inc. (US), Aqua America Inc. (US)
Our Impact
Enabled $4.3B Revenue Impact for Fortune 500 and Leading Multinationals
Partnering with 2000+ Global Organizations Each Year
30K+ Citations by Top-Tier Firms in the Industry
The Bioremediation Wastewater Treatment Services Market is currently experiencing a notable evolution, driven by increasing environmental awareness and regulatory pressures. Stakeholders are increasingly recognizing the importance of sustainable practices in wastewater management, which has led to a growing demand for bioremediation solutions. These services utilize biological processes to treat contaminated water, offering an eco-friendly alternative to traditional methods. As industries strive to minimize their ecological footprint, the market is likely to expand, with innovations in microbial technologies and bioprocessing techniques playing a pivotal role in enhancing treatment efficiency. Moreover, the market landscape is characterized by a shift towards integrated approaches that combine bioremediation with other treatment technologies. This trend suggests a more holistic view of wastewater management, where multiple strategies are employed to achieve optimal results. Collaboration among various sectors, including government agencies, private enterprises, and research institutions, appears to be fostering advancements in this field. As the Bioremediation Wastewater Treatment Services Market continues to mature, it may witness further diversification of service offerings, catering to a broader range of contaminants and industrial applications.
The increasing stringency of environmental regulations is compelling industries to adopt bioremediation practices. Governments worldwide are implementing stricter guidelines for wastewater discharge, which necessitates the use of effective treatment solutions. This trend is likely to drive demand for bioremediation services, as companies seek to comply with legal requirements while minimizing their environmental impact.
Innovations in microbial technologies are enhancing the effectiveness of bioremediation processes. The development of specialized strains and bioaugmentation techniques is improving the ability to treat a wider array of contaminants. This trend indicates a potential for increased efficiency and cost-effectiveness in wastewater treatment, making bioremediation a more attractive option for various industries.
There is a noticeable increase in public awareness regarding environmental issues, which is influencing corporate behavior. Companies are increasingly adopting sustainable practices, including bioremediation, to enhance their corporate social responsibility profiles. This trend suggests that consumer preferences are shifting towards environmentally friendly products and services, further propelling the growth of the Bioremediation Wastewater Treatment Services Market.
Governments worldwide are implementing increasingly stringent environmental regulations aimed at reducing pollution and promoting sustainable practices. These regulations often mandate the treatment of wastewater before discharge, creating a robust demand for bioremediation services. The Bioremediation Wastewater Treatment Services Market is likely to experience growth as industries strive to meet compliance standards. For instance, regulations such as the Clean Water Act in the United States impose strict limits on the discharge of pollutants, compelling industries to adopt advanced treatment technologies. This regulatory landscape not only drives the demand for bioremediation services but also encourages innovation in treatment methodologies, ensuring that companies remain compliant while minimizing their environmental impact.
Many corporations are integrating sustainability into their core business strategies, recognizing the long-term benefits of environmentally friendly practices. This shift is driving demand for bioremediation services as companies aim to minimize their environmental impact and enhance their operational efficiency. The Bioremediation Wastewater Treatment Services Market is likely to see increased investment from corporations committed to sustainability. By adopting bioremediation techniques, companies can not only comply with regulations but also reduce costs associated with traditional wastewater treatment methods. Furthermore, studies suggest that organizations implementing sustainable practices can achieve cost savings of up to 30%, making bioremediation an economically attractive option for businesses looking to improve their environmental performance.
The rise in industrial activities across various sectors has led to a substantial increase in wastewater generation. Industries such as manufacturing, pharmaceuticals, and food processing are significant contributors to this trend. As a result, the demand for effective wastewater treatment solutions is escalating. The Bioremediation Wastewater Treatment Services Market is poised to benefit from this surge, as companies seek sustainable methods to manage their wastewater. According to recent estimates, industrial wastewater accounts for approximately 70% of total wastewater produced, highlighting the critical need for bioremediation services. This growing volume of wastewater necessitates innovative treatment solutions, positioning bioremediation as a viable option for industries aiming to comply with environmental regulations and reduce their ecological footprint.
Advancements in bioremediation technologies are transforming the wastewater treatment landscape. Innovations such as genetically engineered microorganisms and enhanced bioremediation techniques are improving the efficiency and effectiveness of treatment processes. The Bioremediation Wastewater Treatment Services Market is witnessing a shift towards these advanced solutions, which offer faster degradation of contaminants and reduced operational costs. Recent studies indicate that these technologies can increase the rate of pollutant removal by up to 50%, making them an attractive option for industries facing stringent treatment requirements. As technology continues to evolve, the market is expected to expand, driven by the need for more efficient and sustainable wastewater treatment solutions.
There is a growing public consciousness regarding environmental sustainability and the impact of wastewater on ecosystems. This heightened awareness is influencing corporate behavior, as consumers increasingly favor companies that demonstrate environmental responsibility. The Bioremediation Wastewater Treatment Services Market is benefiting from this trend, as businesses seek to enhance their sustainability profiles through effective wastewater management. Companies that invest in bioremediation services not only comply with regulations but also improve their brand image and customer loyalty. Market Research Future indicates that businesses with strong environmental practices can see a 20% increase in customer retention, underscoring the importance of adopting sustainable wastewater treatment solutions.
In the Bioremediation Wastewater Treatment Services Market, 'Oil Spill Cleanup' emerges as the largest segment due to its critical role in restoring marine ecosystems and mitigating environmental damage. This application enjoys a dominant position owing to the increasing frequency of oil spills and regulatory mandates focused on environmental protection. On the other hand, 'Heavy Metal Removal' showcases impressive growth as industries face mounting pressure to comply with environmental regulations. It is rapidly gaining traction due to heightened awareness concerning the hazardous effects of heavy metals on public health and ecosystems. Growth drivers for these applications are prominent; 'Oil Spill Cleanup' benefits from substantial investments in clean-up technologies and international cooperation on environmental initiatives. Meanwhile, the surge in industrial activities and mining operations propels the demand for 'Heavy Metal Removal.' This change stems from progressive regulations aimed at minimizing pollutants entering water systems, making this segment one of the most promising in the bioremediation market.
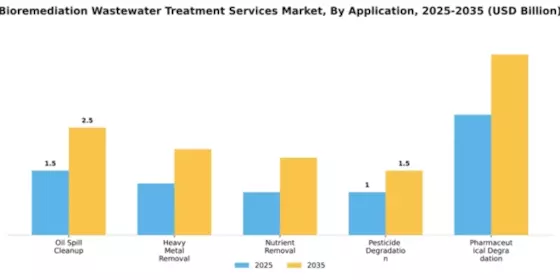
Oil Spill Cleanup (Dominant) vs. Pesticide Degradation (Emerging)
The 'Oil Spill Cleanup' segment is characterized by its critical importance and established methodologies, making it a dominant force in the Bioremediation Wastewater Treatment Services Market. This segment covers a range of bioremediation techniques, including bio-augmentation, bio-stimulation, and phytoremediation, applied in various environments affected by oil spills. Its significant market share is driven by public and private sector initiatives focusing on restoring contaminated sites. Conversely, 'Pesticide Degradation' is emerging rapidly, driven by increasing concerns over pesticide residuals in water and soil. This segment leverages innovative bioremediation techniques using specialized microbial strains capable of breaking down complex pesticide compounds, reflecting a shift in focus towards sustainable agricultural practices. As regulations tighten around pesticide usage, this application is poised for substantial growth and innovation.
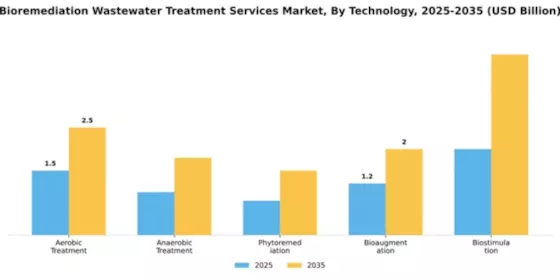
The Bioremediation Wastewater Treatment Services Market is characterized by a diverse range of technologies. Among these, aerobic treatment holds the largest market share, primarily due to its established methods and efficiency in breaking down organic pollutants in wastewater. Anaerobic treatment follows as the fastest-growing segment, driven by an increasing demand for sustainable and eco-friendly solutions in wastewater management. Other methods such as phytoremediation, bioaugmentation, and biostimulation also contribute to the market, albeit with smaller shares.
Technology: Aerobic Treatment (Dominant) vs. Anaerobic Treatment (Emerging)
Aerobic treatment is widely recognized as the dominant technology in the Bioremediation Wastewater Treatment Services Market due to its effectiveness in converting organic materials into simpler compounds using oxygen. This method is favored for its proven track record in various industrial applications, focusing on efficiency and effectiveness. Conversely, anaerobic treatment is emerging as a significant player in the market, catering to the growing emphasis on renewable energy and waste-to-energy processes. While it generally has a slower breakdown rate compared to aerobic treatment, its ability to generate biogas and lower operational costs positions it as a compelling alternative in decentralized wastewater treatment systems. The transition towards anaerobic solutions is fueled by advancements in technology and regulatory frameworks favoring sustainable practices.
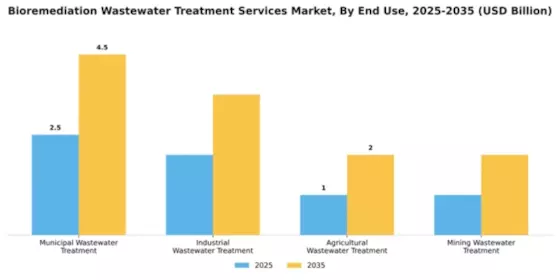
In the Bioremediation Wastewater Treatment Services Market, municipal wastewater treatment holds the largest market share, driven by increasing urbanization and stringent regulatory standards for wastewater management. As cities expand and populations grow, the demand for municipal services to manage wastewater effectively has surged, contributing to this segment's dominance in the market. Conversely, industrial wastewater treatment is witnessing rapid growth, fueled by the need for sustainable practices and corporate responsibility initiatives in various industries, resulting in a rising preference for bioremediation solutions.
Municipal Wastewater Treatment (Dominant) vs. Industrial Wastewater Treatment (Emerging)
Municipal wastewater treatment is characterized by its comprehensive approach to managing domestic sewage and urban runoff, ensuring compliance with clean water regulations. This segment is supported by significant investments in infrastructure and technology, enhancing treatment efficiency and efficacy. In contrast, industrial wastewater treatment is emerging due to the increasing awareness of environmental impact and the necessity for industries to adopt greener solutions. Industries such as manufacturing, pharmaceuticals, and food processing are increasingly integrating bioremediation techniques to reduce pollutants, showcasing a shift towards sustainable solutions. As regulations tighten, both segments are expected to evolve, yet municipal wastewater treatment will likely remain dominant in overall market share.
Get more detailed insights about Bioremediation Wastewater Treatment Services Market Request Free Sample
North America is poised to maintain its leadership in the Bioremediation Wastewater Treatment Services Market, holding a market size of $3.25B in 2025. The region's growth is driven by stringent environmental regulations, increasing industrial waste, and a rising demand for sustainable solutions. Government initiatives promoting green technologies further catalyze market expansion, ensuring compliance with environmental standards. The competitive landscape is robust, with key players like Veolia Environnement, SUEZ, and Xylem Inc. leading the charge. The U.S. is the primary market, supported by advanced technologies and significant investments in wastewater treatment infrastructure. The presence of established companies enhances innovation and service delivery, solidifying North America's position as a market leader.
Europe's Bioremediation Wastewater Treatment Services Market is projected to reach $1.8B by 2025, driven by a strong regulatory framework focused on environmental sustainability. The European Union's directives on wastewater management and pollution control are pivotal in shaping market dynamics. Increasing public awareness and demand for eco-friendly solutions further propel growth, making bioremediation a preferred choice for wastewater treatment. Leading countries such as Germany, France, and the UK are at the forefront, with significant investments in green technologies. Major players like SUEZ and Ecolab are actively expanding their services to meet the growing demand. The competitive landscape is characterized by innovation and collaboration, ensuring that Europe remains a key player in the global market.
The Asia-Pacific region is witnessing significant growth in the Bioremediation Wastewater Treatment Services Market, projected to reach $1.5B by 2025. This growth is fueled by rapid industrialization, urbanization, and increasing environmental concerns. Governments are implementing stricter regulations on wastewater discharge, driving demand for bioremediation solutions as a sustainable alternative to traditional methods. Countries like China, India, and Japan are leading the charge, with substantial investments in wastewater treatment infrastructure. The competitive landscape features both local and international players, including Ecolab and Aqua America. The region's diverse market dynamics and increasing awareness of environmental issues position it as a burgeoning powerhouse in the bioremediation sector.
The Middle East and Africa region is gradually emerging in the Bioremediation Wastewater Treatment Services Market, with a projected size of $0.95B by 2025. The growth is primarily driven by increasing water scarcity and the need for sustainable wastewater management solutions. Governments are recognizing the importance of bioremediation in addressing environmental challenges, leading to supportive policies and initiatives. Countries like South Africa and the UAE are taking the lead in adopting bioremediation technologies. The competitive landscape is evolving, with both local firms and international players seeking to establish a foothold. As awareness of environmental issues grows, the region is poised for significant advancements in wastewater treatment services.
The Bioremediation Wastewater Treatment Services Market is characterized by a dynamic competitive landscape, driven by increasing regulatory pressures and a growing emphasis on sustainable practices. Key players such as Veolia Environnement (FR), SUEZ (FR), and Xylem Inc. (US) are strategically positioned to leverage their technological expertise and extensive service portfolios. Veolia Environnement (FR) focuses on innovation through the development of advanced bioremediation technologies, while SUEZ (FR) emphasizes partnerships with local governments to enhance service delivery. Xylem Inc. (US) is actively pursuing digital transformation initiatives to optimize wastewater treatment processes, thereby shaping a competitive environment that prioritizes efficiency and sustainability.The market structure appears moderately fragmented, with a mix of large multinational corporations and smaller specialized firms. Key players are adopting various business tactics, such as localizing manufacturing and optimizing supply chains, to enhance operational efficiency. This collective influence of major companies fosters a competitive atmosphere where innovation and service quality are paramount, potentially leading to increased market consolidation in the future.In November Ecolab Inc. (US) announced a strategic partnership with a leading technology firm to integrate AI-driven solutions into its wastewater treatment services. This move is likely to enhance Ecolab's operational efficiency and service offerings, positioning the company as a frontrunner in the adoption of cutting-edge technologies within the bioremediation sector. The integration of AI could streamline processes, reduce costs, and improve treatment outcomes, thereby reinforcing Ecolab's competitive edge.In October Clean Harbors Inc. (US) expanded its bioremediation capabilities by acquiring a regional player specializing in advanced wastewater treatment solutions. This acquisition not only broadens Clean Harbors' service portfolio but also enhances its geographical reach, allowing the company to tap into new markets. The strategic importance of this move lies in Clean Harbors' ability to offer comprehensive solutions that meet the evolving needs of clients, thereby strengthening its market position.In September Bioremediation Technologies Inc. (US) launched a new line of eco-friendly bioremediation products aimed at industrial clients. This initiative reflects a growing trend towards sustainability and environmental responsibility, aligning with market demands for greener solutions. The introduction of these products is expected to attract environmentally conscious customers, potentially increasing Bioremediation Technologies' market share and reinforcing its commitment to sustainable practices.As of December current competitive trends indicate a pronounced shift towards digitalization, sustainability, and AI integration within the Bioremediation Wastewater Treatment Services Market. Strategic alliances are increasingly shaping the landscape, enabling companies to pool resources and expertise. Looking ahead, competitive differentiation is likely to evolve from traditional price-based competition to a focus on innovation, technology, and supply chain reliability, underscoring the importance of adaptability in a rapidly changing market.
The Bioremediation Wastewater Treatment Services Market is projected to grow at a 5.73% CAGR from 2025 to 2035, driven by increasing environmental regulations and technological advancements.
New opportunities lie in:
By 2035, the market is expected to be robust, driven by innovation and strategic partnerships.
| MARKET SIZE 2024 | 6.5(USD Billion) |
| MARKET SIZE 2025 | 6.87(USD Billion) |
| MARKET SIZE 2035 | 12.0(USD Billion) |
| COMPOUND ANNUAL GROWTH RATE (CAGR) | 5.73% (2025 - 2035) |
| REPORT COVERAGE | Revenue Forecast, Competitive Landscape, Growth Factors, and Trends |
| BASE YEAR | 2024 |
| Market Forecast Period | 2025 - 2035 |
| Historical Data | 2019 - 2024 |
| Market Forecast Units | USD Billion |
| Key Companies Profiled | Veolia Environnement (FR), SUEZ (FR), Xylem Inc. (US), Ecolab Inc. (US), Bioremediation Technologies Inc. (US), Clean Harbors Inc. (US), Envirogen Technologies Inc. (US), Aqua America Inc. (US) |
| Segments Covered | Application, Technology, End Use |
| Key Market Opportunities | Growing demand for sustainable solutions drives innovation in the Bioremediation Wastewater Treatment Services Market. |
| Key Market Dynamics | Rising regulatory pressures and technological advancements drive innovation in bioremediation wastewater treatment services. |
| Countries Covered | North America, Europe, APAC, South America, MEA |
As of 2024, the market valuation stands at 6.5 USD Billion.
The market is projected to reach 12.0 USD Billion by 2035.
The expected CAGR for the market during this period is 5.73%.
Key players include Veolia Environnement, SUEZ, Xylem Inc., Ecolab Inc., and Clean Harbors Inc.
Primary applications include Oil Spill Cleanup, Heavy Metal Removal, Nutrient Removal, Pesticide Degradation, and Pharmaceutical Degradation.
Pharmaceutical Degradation generated approximately 2.8 USD Billion in 2024, with projections reaching 4.2 USD Billion by 2035.
Technologies include Aerobic Treatment, Anaerobic Treatment, Phytoremediation, Bioaugmentation, and Biostimulation.
Municipal Wastewater Treatment is expected to generate between 2.5 USD Billion and 4.5 USD Billion by 2035.
In 2024, Industrial Wastewater Treatment was valued at 2.0 USD Billion, while Agricultural Wastewater Treatment was valued at 1.0 USD Billion.
Biostimulation appears to be on track for the highest growth, with a projected increase from 2.0 USD Billion to 4.2 USD Billion by 2035.


Kindly complete the form below to receive a free sample of this Report

“This is really good guys. Excellent work on a tight deadline. I will continue to use you going forward and recommend you to others. Nice job”


“Thanks. It’s been a pleasure working with you, please use me as reference with any other Intel employees.”


“Thanks for sending the report it gives us a good global view of the Betaïne market.”


“Thank you, this will be very helpful for OQS.”


“We found the report very insightful! we found your research firm very helpful. I'm sending this email to secure our future business.”


“I am very pleased with how market segments have been defined in a relevant way for my purposes (such as "Portable Freezers & refrigerators" and "last-mile"). In general the report is well structured. Thanks very much for your efforts.”


“I have been reading the first document or the study, ,the Global HVAC and FP market report 2021 till 2026. Must say, good info! I have not gone in depth at all parts, but got a good indication of the data inside!”


“We got the report in time, we really thank you for your support in this process. I also thank to all of your team as they did a great job.”


“The Automotive 48V ECU Components Procurement Intelligence Study” was a complex project, but the Market Research Future (MRFR) team handled it with quality, agility, and customer-centricity. They delivered all requested data on time and within the agreed scope. The team, including Shubhendra Anand and Rahul Gotadki, was always readily available to clarify questions and swiftly implement necessary adjustments, driving the project to a successful conclusion within a very demanding timeframe.
I would also like to specifically commend Akshay Agarwal for his responsiveness and support at every stage—from our initial inquiry on May 6th through to final delivery on June 18th. His dedication made the entire process seamless.”



