Bird Repellent Market (2026 - 2035)

Bird Repellent Market Size, Share, Industry Trend & Analysis Research Report By Product Type (Chemical Bird Repellents, Natural or Organic Bird Repellents), By Form (Sprays, Gels and Pastes, Granules and Powders, Strips, Tapes, and Patches), By End-Use (Agriculture, Non-Agriculture), By Geography (North America, Europe, Asia-Pacific, South America, Middle East & Africa) - Forecast to 2035

Forecast Period
2026-2035
CAGR
4.70%
2025 Market Size
USD 432.10 Million
2035 Market Size
USD 684.00 Million
Agriculture ● Updated July 2026 Report ID: MRFR/Agri/21676-HCR | Pages: 128 | Author: Snehal Singh

Bird Repellent Market Summary

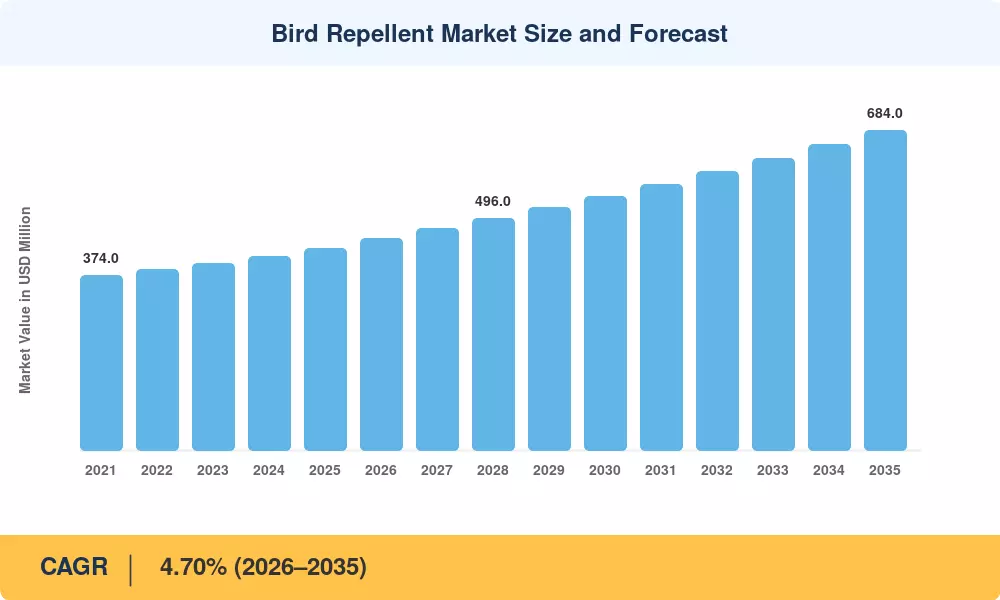
The bird repellent market stood at USD 432.10 million in 2025 and is projected to grow from USD 452.40 million in 2026 to USD 684.00 million by 2035, registering a CAGR of 4.70% during the forecast period (2026–2035). Tightening food-safety mandates from the U.S. FDA and European EFSA, combined with rising avian-borne disease alerts such as the H5N1 resurgence tracked by the WHO, have pushed both growers and property managers toward structured bird management programs [1][2].

Basic reflecting tape, static decoys and rudimentary noise emitters are slowly making way to sensor-equipped autonomous systems combining radar detection with laser deterrent and AI-driven behavioral analytics – legacy passive technologies. The USDA’s Wildlife Services program budgeted more than USD 30 million in fiscal 2024 to address avian crop damage in fruit and grain belts, driving the need for scalable repellant technology at the federal level [3]. This is shortening replacement cycles and increasing average order values across the bird repellent sector.


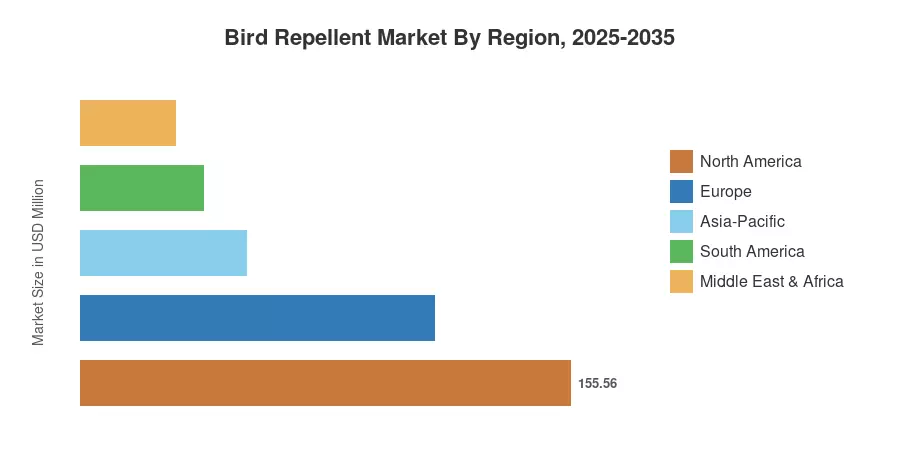
North America accounts for around 36.0% of the world’s revenues, driven by large-scale broadacre farming and stringent urban pest-management regulations. Asia Pacific is the fastest expanding market with a CAGR of 12.2%, led by India’s horticulture subsidies and China’s post-harvest loss reduction efforts. Europe takes second place with 26.0% share, where the law on biodiversity directs procurement to non-lethal products with ecological certification. These regional trends will influence the competitive landscape of the bird repellent market till 2035.


Key Report Takeaways

• By Product Type

  • Chemical bird repellents accounted for approximately 58.0% of the bird repellent market in 2024, sustained by proven efficacy in large-scale agricultural applications.
  • Natural and organic bird repellents are forecast to expand at a 16.3% CAGR through 2035, reflecting tightening pesticide-residue regulations across the EU and North America.

• By Form

  • Sprays captured roughly 40.0% of the bird repellent market in 2024, preferred for ease of application across orchards and vineyards.
  • Gels and pastes are poised to grow at a 14.8% CAGR to 2035, gaining traction in rooftop and structural installations.

• By End-Use

  • Agriculture held a 56.0% share of the bird repellent market in 2024, led by row-crop and orchard segments in North America and Asia-Pacific.
  • Non-agriculture end-uses are projected to advance at a 12.4% CAGR through 2035, powered by aviation safety mandates and commercial property management.

• By Geography

  • North America commanded 36.0% of the bird repellent market in 2024, supported by USDA-funded wildlife-damage programs and municipal pest-control codes.
  • Asia-Pacific is set to accelerate at a 12.2% CAGR to 2035, fueled by rapid urbanization and expanding protected-agriculture acreage.


Bird Repellent Market Size and Forecast (2021–2035)

MRFR’s size model utilizes primary survey data from over 120 distributors, government crop-loss databases (USDA NASS, FAO), trade-shipment data, and firm filings. Reported sales are the basis for the historical data; the future figures are based on the calibrated 4.70% CAGR with modifications for regulatory inflections and technology-adoption curves.
Bird Repellent Market Size and Forecast
Our Impact
Enabled $4.3B Revenue Impact for Fortune 500 and Leading Multinationals
Partnering with 2000+ Global Organizations Each Year
30K+ Citations by Top-Tier Firms in the Industry

Driver Impact Analysis

Driver ~% Impact on CAGR Geographic Relevance Impact Timeline
Avian-influenza outbreaks and biosecurity mandates +0.9% Global Short-term (≤2 yr)
Tightening pesticide-residue regulations +0.8% EU, North America Medium-term (2–4 yr)
Post-harvest loss reduction campaigns +0.7% Asia-Pacific, Africa Long-term (≥4 yr)
Airport wildlife-strike mitigation programs +0.5% North America, Europe Medium-term (2–4 yr)
Labor shortages in broadacre farming +0.4% North America, Australia Short-term (≤2 yr)
Urban rooftop-farming proliferation +0.3% Asia-Pacific, Europe Long-term (≥4 yr)
Precision-agriculture platform integration +0.3% Global Long-term (≥4 yr)


Avian-Influenza Outbreaks and Biosecurity Mandates

The 2022–2024 H5N1 wave killed over 130 million poultry across 67 countries, according to the World Organisation for Animal Health, prompting governments to classify wild-bird deterrence as a frontline biosecurity measure [5]. The USDA's Animal and Plant Health Inspection Service expanded its cooperative bird-management budget by 18% in FY 2024, directing funds toward automated perimeter repellent systems around poultry clusters. This urgency has compressed sales cycles across the bird repellent market and lifted contract sizes for integrated deterrent installations.

Tightening Pesticide-Residue Regulations

The European Commission's Farm-to-Fork strategy targets a 50% reduction in chemical-pesticide use by 2030, which extends to avian-deterrent chemicals classified under Regulation (EC) No. 1107/2009 [6]. Formulators are reformulating methyl-anthranilate and capsaicin-based products to meet updated MRL thresholds, accelerating a shift toward organic-certified repellents. This regulatory pressure is a primary growth catalyst for the bird repellent market in Western Europe and is rippling into Codex Alimentarius-aligned markets across Latin America.

Post-Harvest Loss Reduction Campaigns

FAO estimates that avian pests cause 5–15% grain losses in sub-Saharan Africa and up to 8% fruit losses in South and Southeast Asia [9]. India's Pradhan Mantri Fasal Bima Yojana crop-insurance scheme has begun incentivizing bird-deterrent deployment as a loss-prevention qualifier, channeling indirect subsidies into the bird repellent market. Similar loss-reduction frameworks in Vietnam and Indonesia are widening the addressable base for affordable granule and strip-based products.

Airport Wildlife-Strike Mitigation

The FAA recorded 17,228 wildlife strikes in 2023, with avian species accounting for 97% of incidents [16]. ICAO's Annex 14 mandates active wildlife-management programs at all certified aerodromes, creating a high-value, recurrent-revenue channel for the bird repellent market. Laser-based deterrent providers have secured multi-year contracts at over 40 major airports globally, with individual installations exceeding USD 250,000.


Restraints Impact Analysis

The restraint impacts below are directional drag estimates on the bird repellent market's growth trajectory and should not be subtracted directly from the aggregate CAGR.

Restraint ~% Impact on CAGR Geographic Relevance Impact Timeline
Bird-habituation to static deterrents –0.5% Global Short-term (≤2 yr)
High capital cost of autonomous laser systems –0.4% Emerging markets Medium-term (2–4 yr)
Fragmented regulatory approval pathways –0.3% Asia-Pacific, MEA Long-term (≥4 yr)
Public perception concerns over chemical residues –0.3% EU, North America Medium-term (2–4 yr)
Limited efficacy data for organic formulations –0.2% Global Short-term (≤2 yr)


Bird-Habituation to Static Deterrents

Ornithological studies from Cornell Lab of Ornithology demonstrate that common pest species — starlings, pigeons, and house sparrows — habituate to stationary visual and auditory deterrents within 7–14 days [17]. This behavioral adaptation forces end-users into costly rotational strategies, blending multiple deterrent modalities. The result is a higher total cost of ownership and slower adoption among price-sensitive smallholders, constraining growth at the lower end of the bird repellent market.

High Capital Cost of Autonomous Laser Systems

A single automated laser-deterrent unit ranges from USD 8,000 to USD 25,000 depending on range and AI capabilities, placing it beyond the reach of most farms under 50 hectares [8]. While ROI data from Dutch blueberry trials shows payback within two seasons for large operations, the upfront barrier suppresses penetration in South America, Africa, and parts of Southeast Asia — regions where the bird repellent market otherwise has strong volume potential.

Fragmented Regulatory Approval Pathways

No harmonized global standard exists for avian-repellent registration. A chemical formulation cleared by the U.S. EPA under FIFRA may face separate 18–24-month review cycles with India's CIB&RC or Brazil's ANVISA [18]. This fragmentation delays market entry for innovative products and increases compliance costs, particularly for smaller manufacturers seeking to expand across the bird repellent market's fastest-growing geographies.


Bird Repellent Market Opportunities

AI-Integrated Autonomous Deterrent Platforms

Computer-vision systems trained on species-specific silhouettes can now trigger targeted responses — laser sweeps for crows, ultrasonic bursts for starlings — reducing energy waste and habituation risk. Cloud-connected platforms offering real-time dashboards and predictive analytics represent a premium tier within the bird repellent market, commanding 3–4× the ASP of passive products.

Drone-as-a-Service for Crop Protection

Drone operators in Australia and South Africa are bundling aerial bird-dispersal sorties with crop-scouting subscriptions, creating a recurring-revenue model untethered from product sales. This service-layer opportunity could reach USD 45 million globally by 2030 and is directly complementary to the bird repellent market's physical-product segments.

Organic and Bio-Based Formulation Expansion

With the EU's pesticide-reduction targets and Japan's Green Food System Strategy both advancing toward 2030 milestones, demand for OMRI-listed and JAS-certified bird repellents is outpacing supply. Startups blending plant-derived terpenes and capsaicinoids with slow-release polymer carriers are attracting Series A funding, opening white-space opportunities in the bird repellent market.

Emerging-Market Penetration via Micropackaging

Sub-Saharan African and South Asian smallholders farm plots averaging 1–2 hectares, and cannot absorb bulk pricing. Single-use sachet and strip formats priced below USD 2 per application can unlock millions of first-time buyers, replicating the FMCG micropackaging model within the bird repellent market.

Data Monetization from Deterrent Networks

Sensor-equipped repellent installations generate granular avian-migration and pest-pressure datasets. Aggregated and anonymized, this data holds value for agricultural insurers, precision-agriculture platforms, and conservation agencies — positioning deterrent-network operators as data brokers and diversifying revenue beyond the traditional bird repellent market product sale.


Bird Repellent Market Future Outlook

AI and Autonomous Operations

Machine-learning models trained on species-specific flight patterns will enable fully autonomous deterrent networks that select, aim, and escalate responses without human intervention. By 2030, an estimated 15% of new installations in the bird repellent market will feature closed-loop AI decision engines, cutting labor costs by up to 60% on large commercial farms [10][13].

Platform Economics and Deterrent-as-a-Service

Hardware-plus-subscription models — pairing sensor nodes with cloud dashboards — are converting one-time product sales into recurring SaaS revenue streams. This shift mirrors the broader precision-agriculture transition and will raise customer lifetime values across the bird repellent market while lowering entry barriers for smallholders who can subscribe rather than purchase outright [12].

Sustainability-Driven Formulation Overhaul

ESG reporting frameworks, including the EU's Corporate Sustainability Reporting Directive (CSRD), will compel food producers to disclose pesticide and deterrent-chemical usage across supply chains by 2028 [15]. This transparency requirement accelerates the bird repellent market's pivot toward bio-based and non-toxic formulations, rewarding early movers with premium pricing and preferred-supplier status.

Climate-Driven Pest-Range Expansion

Rising global temperatures are shifting avian migration corridors and expanding the geographic range of pest species into previously unaffected growing regions. IPCC scenarios project northward expansion of granivorous bird ranges by 200–400 km by 2040, opening new demand pockets in Northern Europe, Canada, and Russia for the bird repellent market [20].


Bird Repellent Market Segmentation

By Product Type

Segment Key Metric Primary Demand Driver
Chemical Bird Repellents 58.0% share (2024) Proven efficacy on large-acreage farms
Natural or Organic Bird Repellents 16.3% CAGR (2026–2035) Regulatory preference and consumer demand


Chemical bird repellents — primarily methyl-anthranilate and polybutene-based formulations — dominate the bird repellent market because of their predictable performance across diverse climatic conditions. Large-scale grain and fruit operations in North America and Brazil remain core buyers, valuing consistent area coverage at competitive per-hectare costs.

Natural and organic alternatives are the fastest-growing product category in the bird repellent market. Essential-oil blends, capsaicin concentrates, and fermentation-derived terpene products have demonstrated 70–85% efficacy in controlled vineyard trials, narrowing the performance gap with synthetic counterparts while meeting organic-certification requirements [19].

By Form

Segment Key Metric Primary Demand Driver
Sprays 40.0% share (2024) Versatile application across agriculture and structures
Gels and Pastes 14.8% CAGR (2026–2035) Long-lasting rooftop and ledge applications
Granules and Powders USD 68.50 Million (2025) Broadcast-friendly for large open fields
Strips, Tapes, and Patches 5.5% CAGR (2026–2035) Low-cost perimeter solutions for small farms


Sprays lead the bird repellent market by form because they integrate seamlessly into existing agricultural sprayer fleets, requiring no additional capital equipment. Gels and pastes are gaining ground in commercial real estate and infrastructure segments, where building managers need discrete, odorless formulations that last 6–12 months per application.

By End-Use

Segment Key Metric Primary Demand Driver
Agriculture 56.0% share (2024) Crop-loss prevention and export compliance
Non-Agriculture 12.4% CAGR (2026–2035) Aviation safety, urban pest management and solar-farm protection


Agriculture remains the backbone of the bird repellent market, with fruit orchards, vineyards, and cereal fields accounting for the bulk of volume purchases. Row-crop farmers in the U.S. Midwest and India's Deccan Plateau deploy a mix of chemical sprays and granules timed to seed-emergence and pre-harvest windows.

Non-agricultural demand within the bird repellent market is accelerating as solar-farm operators, warehouse managers, and transit authorities recognize avian-related maintenance and safety costs. A single bird-strike incident at a commercial airport can generate over USD 1 million in aircraft damage and delay costs, justifying premium deterrent investments [16].


Regional Market Share Analysis

Region Key Metric Primary Investment Themes
North America 36.0% share (2024) Biosecurity, airport safety and broadacre protection
Europe 26.0% share (2024) Green Deal compliance, organic-formulation shift
Asia-Pacific 12.2% CAGR (2026–2035) Orchard expansion, post-harvest loss reduction
South America USD 38.90 Million (2025) Soy-belt pest pressure, export-quality standards
Middle East & Africa 7.0% share (2024) Grain-storage protection, airport perimeter control
Total USD 432.10 Million (2025)

The bird repellent market displays clear regional stratification, with mature Western markets prioritizing compliance-driven upgrades while high-growth developing regions are entering earlier adoption phases.


North America

Country Key Metric Key Driver
United States 72.0% of regional share USDA wildlife services funding, FAA strike-mitigation
Canada 18.0% of regional share Canola and berry-crop protection mandates
Mexico USD 15.60 Million (2025) Avocado and berry export quality compliance


The United States anchors the North American bird repellent market through a combination of federal wildlife-damage compensation programs and municipal codes that mandate pest-bird control on commercial rooftops. Canada's prairie provinces and British Columbia's Fraser Valley represent concentrated demand pockets, while Mexico's Michoacán avocado belt is rapidly adopting chemical sprays to meet U.S. import phytosanitary standards [3][16].

Europe

Country Key Metric Key Driver
Germany 4.8% CAGR (2026–2035) Organic-farming expansion, DIN-standard compliance
United Kingdom 22.0% of regional share Urban pigeon management, heritage-building protection
France USD 16.40 Million (2025) Vineyard and sunflower-field deterrence
Italy 14.0% of regional share Olive-grove and orchard protection
Spain 4.5% CAGR (2026–2035) Citrus and berry export-quality standards
Nordic Countries USD 6.80 Million (2025) Airport safety, aquaculture-site protection
Russia 8.0% of regional share Grain-storage facility protection
Rest of Europe 5.0% CAGR (2026–2035) EU CAP subsidy-linked pest management


European procurement in the bird repellent market is heavily shaped by the EU's Common Agricultural Policy cross-compliance rules, which tie subsidy eligibility to documented pest-management practices. The UK's post-Brexit regulatory independence has accelerated approval of novel bio-repellent formulations, while France's Ecophyto II+ plan directly restricts chemical-deterrent active ingredients [6][15].

Asia-Pacific

Country Key Metric Key Driver
China 30.0% of regional share Rice-paddy and orchard mechanization programs
India 13.5% CAGR (2026–2035) Horticulture Mission subsidies, millet-crop protection
Japan USD 8.20 Million (2025) Airport safety, urban crowd-management programs
South Korea 5.0% CAGR (2026–2035) Smart-farm integration, K-GAP standards
ASEAN 28.0% of regional share Palm oil and rice-field bird pressure
Rest of Asia-Pacific USD 4.90 Million (2025) Emerging protected-agriculture demand


Asia-Pacific represents the most dynamic growth frontier for the bird repellent market. India's National Horticulture Mission allocates crop-protection subsidies that now extend to approved deterrent devices. At the same time, China's 14th Five-Year Plan for agricultural modernization emphasizes integrated pest management, channeling provincial budgets toward technology-driven repellent systems [9][14].

South America

Country Key Metric Key Driver
Brazil 58.0% of regional share Soybean, corn, and sunflower field protection
Argentina 5.2% CAGR (2026–2035) Wine-grape and soy-crop deterrence
Rest of South America USD 6.80 Million (2025) Quinoa and fruit-export pest management


Brazil's expansive soy and corn belts face persistent losses from eared doves and parakeets, driving volume demand for granule-based repellents. Argentina's Mendoza wine region is adopting netting and gel systems to protect premium grape varieties. At the same time, Andean quinoa producers increasingly require export-grade pest documentation, pulling the bird repellent market deeper into the value chain [14].

Middle East & Africa

Country Key Metric Key Driver
Saudi Arabia 24.0% of regional share NEOM and greenhouse-agriculture investment
UAE 5.8% CAGR (2026–2035) Airport perimeter control, vertical-farm protection
South Africa USD 4.50 Million (2025) Fruit orchard and vineyard deterrence
Egypt 18.0% of regional share Nile Delta grain-storage protection
Rest of MEA 4.0% CAGR (2026–2035) Subsistence-agriculture awareness growth


The Middle East & Africa segment of the bird repellent market is small but accelerating. Saudi Arabia's Vision 2030 agriculture diversification strategy is channeling investment into controlled-environment farming, where bird ingress threatens yield integrity. South Africa's Western Cape deciduous-fruit industry loses an estimated 4–6% of harvests to starling flocks, sustaining steady demand for both chemical and physical deterrents [14].


Bird Repellent Market By Region, 2025-2035

Competitive Benchmarking

The bird repellent industry is moderately concentrated, with the top 5 players accounting for an estimated 55% of the global revenues. The Herfindahl-Hirschman Index is between 1,200 and 1,500, which indicates a market structure with well-established incumbents, specialized regional firms, and emerging technology disruptors.

Company Est. Revenue Share Range Key Offerings Strategic Positioning
Bird-X Inc. ~10–14% Electronic deterrents, laser systems and chemical sprays Broadest portfolio; strong U.S. distribution
Rentokil Initial plc ~9–12% Integrated pest-management services, netting, spikes Global service-network advantage
Bird Control Group BV ~8–11% Automated laser deterrents, AI analytics Technology leader in autonomous systems
Pelsis Group ~6–9% Physical barriers, chemical repellents and traps European distribution strength
Bird Barrier America Inc. ~5–8% Netting, spikes, optical gels, electric track systems Premium structural-protection focus
Nixalite of America Inc. ~3–5% Stainless-steel spikes, netting hardware Heritage brand in architectural deterrence
Avian Enterprises LLC ~2–4% Methyl-anthranilate liquid and fog repellents Niche agriculture specialist
Flock Free Ltd. ~2–4% Flavor-aversion sprays, tank-mix repellents Cost-effective broadacre solutions
BirdBuffer ~1–3% Methyl-anthranilate vapor systems Industrial and airport perimeter focus
Aspectek ~1–3% Ultrasonic devices, reflective deterrents, spikes Value-segment e-commerce leader


Recent News & Developments


  • Rentokil Initial plc (April 2024): Rentokil Initial acquired HiCare Services, India's second-largest pest control company, for approximately INR 800 million (USD 10 million), strengthening its position in the rapidly growing Indian market and expanding bird control service capabilities in urban environments.


  • Bayer (May 2024): Bayer launched Ibisio, a biological bird repellent containing Black Pepper Oleoresin, with registrations in Ukraine and emergency approvals in Italy and Switzerland. Field tests demonstrated 33% more healthy plants compared to standard treatments, with full European registrations projected by 2026.


Bird Repellent Market Report Scope

Parameter Detail
Market Scope Global bird repellent market covering chemical, natural/organic, and device-based deterrents
Study Period 2021–2035
CAGR 4.70% (2026–2035)
Market Size (2025) USD 432.10 Million
Market Size (2035) USD 684.00 Million
Fastest Growing Segment Natural or Organic Bird Repellents (16.3% CAGR)
Companies Profiled 10 (Bird-X, Rentokil Initial, Bird Control Group, Pelsis, Bird Barrier America, Nixalite, Avian Enterprises, Flock Free, BirdBuffer, Aspectek)
Valuation Currency USD Million


FAQs

How quickly do birds typically habituate to a new repellent system?
Most pest species adapt to a single-modality deterrent within 7–14 days. Rotating between at least three modalities — visual, auditory, and chemical — extends effective deterrence to a full growing season [17].
What is the typical payback period for an automated laser deterrent on a commercial farm?
Large-acreage fruit and berry operations generally recover the USD 15,000–25,000 investment within two harvest cycles through reduced crop losses exceeding 8–12% annually [8].
Can bird repellent formulations affect pollinator populations?
Methyl-anthranilate and capsaicin, the two leading active ingredients, show negligible toxicity to honeybees at label application rates according to EPA ecotoxicity assessments [11].
How do procurement teams evaluate chemical versus physical deterrent ROI?
Chemical sprays offer a lower upfront cost but require seasonal reapplication. Physical systems like gels and netting carry higher installation costs but deliver 3–5-year service life, favoring total-cost analysis [7].
Are there insurance incentives for deploying certified bird repellent systems?
Select crop insurers in the U.S. and Australia offer 2–5% premium discounts when policyholders document approved bird-management programs as part of integrated pest-management plans [3].
What role does LiDAR play in next-generation bird deterrent platforms?
LiDAR supplements radar by providing high-resolution 3D flock-shape data, improving species identification accuracy to above 92% and enabling targeted responses that reduce energy consumption [13].
How are regulatory timelines for organic repellent registration changing?
EPA and EFSA are piloting expedited biopesticide review tracks that cut approval timelines from 24 months to 12–15 months, lowering barriers for new entrants with plant-derived formulations [11].    
Author
Author
Author Profile
Snehal Singh LinkedIn
Manager - Research
High acumen in analyzing complex macro & micro markets with more than 6 years of work experience in the field of market research. By implementing her analytical skills in forecasting and estimation into market research reports, she has expertise in Packaging, Construction, and Equipment domains. She handles a team size of 20-25 resources and ensures smooth running of the projects, associated marketing activities, and client servicing.
Share::
Request Free Sample
Download Free Sample

Kindly complete the form below to receive a free sample of this Report

Share::
Request Free Sample
Download PDF ×

We do not share your information with anyone. However, we may send you emails based on your report interest from time to time. You may contact us at any time to opt-out.
















