-
EXECUTIVE SUMMARY
-
MARKET INTRODUCTION
-
DEFINITION
-
SCOPE OF THE STUDY
-
RESEARCH OBJECTIVE
-
MARKET STRUCTURE
-
RESEARCH METHODOLOGY
-
OVERVIEW
-
DATA FLOW
- DATA MINING PROCESS
-
PURCHASED DATABASE:
-
SECONDARY SOURCES:
- SECONDARY RESEARCH DATA FLOW:
-
PRIMARY RESEARCH:
- PRIMARY RESEARCH DATA FLOW:
- PRIMARY RESEARCH: NUMBER OF INTERVIEWS CONDUCTED
- PRIMARY RESEARCH: REGIONAL COVERAGE
-
APPROACHES FOR MARKET SIZE ESTIMATION:
- REVENUE ANALYSIS APPROACH
-
DATA FORECASTING
- DATA FORECASTING TYPE
-
DATA MODELING
- MICROECONOMIC FACTOR ANALYSIS:
- DATA MODELING:
-
TEAMS AND ANALYST CONTRIBUTION
-
MARKET DYNAMICS
-
INTRODUCTION
-
DRIVERS
- GROWTH OF THE FOODSERVICE INDUSTRY SUPPORTING ELEVATED SALES OF BLENDERS
- INCREASING DEMAND FOR INNOVATIVE KITCHEN APPLIANCES AMONG CONSUMERS
-
RESTRAINTS
- CHALLENGES IN DISTRIBUTION IMPACTING AVAILABILITY IN REMOTE AREAS
- LIMITED CONSUMER AWARENESS REGARDING THE ADVANTAGES OF HIGH-END BLENDERS
-
OPPORTUNITY
- EXPANSION OF E-COMMERCE PLATFORMS OFFERING GREATER ACCESSIBILITY TO BLENDERS
- GROWING TREND OF MEAL PREP AND SMOOTHIE CULTURE CREATING NEW CUSTOMER SEGMENTS
-
MARKET FACTOR ANALYSIS
-
PORTER'S FIVE FORCES MODEL
- THREAT OF NEW ENTRANTS
- BARGAINING POWER OF SUPPLIERS
- THREAT OF SUBSTITUTES
- BARGAINING POWER OF BUYERS
- INTENSITY OF RIVALRY
-
IMPACT OF COVID-19 ON THE GLOBAL BLENDERS MARKET
-
GLOBAL BLENDERS MARKET, BY PRODUCT TYPE (USD MILLION), 4019-4035
-
OVERVIEW
-
COUNTERTOP BLENDERS
-
PERSONAL AND PORTABLE BLENDERS
-
IMMERSION AND HAND BLENDERS
-
COMMERCIAL AND HEAVY-DUTY BLENDERS
-
GLOBAL BLENDERS MARKET, BY POWER RATING
-
OVERVIEW
-
UP TO 300 WATTS
-
300–600 WATTS
-
600–900 WATTS
-
ABOVE 900 WATTS
-
GLOBAL BLENDERS MARKET, BY MATERIAL
-
OVERVIEW
-
PLASTIC
-
GLASS
-
STAINLESS STEEL
-
GLOBAL BLENDERS MARKET, BY PRICING RANGE
-
OVERVIEW
-
• MASS (LESS THAN $60, MID ($60–$150)
-
• PREMIUM ($150–$350)
-
• HIGH-END ($350–$700 AND ABOVE)
-
GLOBAL BLENDERS MARKET, BY END USER
-
OVERVIEW
-
• CONSUMER OR PERSONAL
-
• PROFESSIONAL OR COMMERCIAL
-
FOODSERVICE
-
SMOOTHIE SHOPS
-
QSR
-
CAFÉS
-
• HOSPITALITY,
-
GLOBAL BLENDERS MARKE, DISTRIBUTION CHANNEL
-
• BRICK-AND-MORTAR RETAIL
-
• SPECIALTY OR KITCHEN STORES
-
• ONLINE OR E-COMMERCE
-
• DIRECT-TO-CONSUMER (DTC)
-
GLOBAL BLENDERS MARKET, BY REGION
-
OVERVIEW
-
NORTH AMERICA
- US
- CANADA
-
EUROPE
- GERMANY
- FRANCE
- UK
- ITALY
- SPAIN
- RUSSIA
- REST OF EUROPE
-
ASIA-PACIFIC
- CHINA
- INDIA
- JAPAN
- SOUTH KOREA
- MALAYSIA
- THAILAND
- INDONESIA
- REST OF ASIA-PACIFIC
-
SOUTH AMERICA
- BRAZIL
- MEXICO
- ARGENTINA
- REST OF SOUTH AMERICA
-
MIDDLE EAST AND AFRICA
- GCC COUNTRIES
- SOUTH AFRICA
- REST OF MIDDLE EAST AND AFRICA
-
COMPETITIVE LANDSCAPE
-
INTRODUCTION
-
MARKET SHARE ANALYSIS, 4044
-
COMPETITOR DASHBOARD
-
PUBLIC PLAYERS STOCK SUMMARY
-
COMPARATIVE ANALYSIS: KEY PLAYERS FINANCIAL
-
KEY DEVELOPMENTS & GROWTH STRATEGIES
- PRODUCT LAUNCH
- PARTNERSHIP
- RECOGNITION
- ACQUISITION
- INTEGRATION
- STRATEGIC INNOVATION
-
COMPANY PROFILES
-
SHARKNINJA / NINJA
-
PHILIPS (VERSUNI)
-
KITCHENAID (WHIRLPOOL)
-
HAMILTON BEACH
-
VITAMIX
-
CUISINART (CONAIR)
-
DATA CITATIONS
-
LIST OF TABLES
-
FIGURE 1: GLOBAL BLENDERS MARKET SIZE, 2019-2035, USD MILLION
-
FIGURE 2: GLOBAL BLENDERS MARKET, Y-O-Y GROWTH ANALYSIS 2020-35 (%)
-
FIGURE 3: GLOBAL BLENDERS MARKET, BY REGION, MARKET SHARE 2024 (%)
-
FIGURE 4: GLOBAL BLENDERS MARKET SHARE, BY PRODUCT TYPE, 2024 (%)
-
FIGURE 5: GLOBAL BLENDERS MARKET SHARE, BY POWER RATING, 2024 (%)
-
FIGURE 6: GLOBAL BLENDERS MARKET SHARE, BY MATERIAL, 2024 (%)
-
FIGURE 7: GLOBAL BLENDERS MARKET SHARE, BY PRICE RANGE, 2024 (%)
-
FIGURE 8: GLOBAL BLENDERS MARKET SHARE, BY END USER , 2024 (%)
-
FIGURE 9: GLOBAL BLENDERS MARKET SHARE, BY DISTRIBUTION CHANNEL , 2024 (%)
-
FIGURE 10: GLOBAL BLENDERS MARKET GROWTH FACTOR ANALYSIS (2025-2035)
-
FIGURE 11: GLOBAL BLENDERS MARKET, BY PRODUCT TYPE, 2024 (%)
-
FIGURE 12: GLOBALBLENDERS MARKET, BY POWER RATING, 2024 (%)
-
FIGURE 13: GLOBAL BLENDERS MARKET SHARE, BY MATERIAL, 2024 (%)
-
FIGURE 14: GLOBAL BLENDERS MARKET SHARE, BY PRICE RANGE, 2024 (%)
-
FIGURE 15: GLOBAL BLENDERS MARKET SHARE, BY END USER , 2024 (%)
-
FIGURE 16: GLOBAL BLENDERS MARKET SHARE, BY DISTRIBUTION CHANNEL , 2024 (%)
-
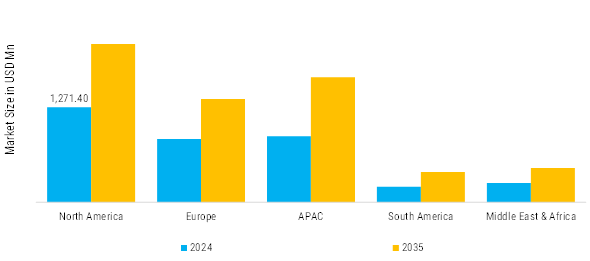
FIGURE 17: GLOBAL BLENDERS MARKET VALUE, BY REGION, 2024 (USD MILLION)
-
FIGURE 18: GLOBAL BLENDERS MARKET SHARE ANALYSIS, BY REGION, 2024 (%)
-
FIGURE 19: NORTH AMERICA BLENDERS MARKET SHARE ANALYSIS, BY COUNTRY, 2024 (%)
-
FIGURE 20: US BLENDERS MARKET SHARE ANALYSIS, BY REGION, 2024 (%)
-
TABLE 1: GLOBAL BLENDERS MARKET, BY PRODUCT TYPE, 2019-2035 (USD MILLION)
-
TABLE 2: GLOBAL BLENDERS MARKET, BY POWER RATING, 2019-2035 (USD MILLION)
-
TABLE 3: GLOBAL BLENDERS MARKET, BY MATERIAL, 2019-2035 (USD MILLION)
-
TABLE 4: GLOBAL BLENDERS MARKET, BY PRICE RANGE, 2019-2035 (USD MILLION)
-
TABLE 5: GLOBAL BLENDERS MARKET, BY END USE, 2019-2035 (USD MILLION)
-
TABLE 6: GLOBAL BLENDERS MARKET, BY DISTRIBUTION CHANNEL, 2019-2035 (USD MILLION)
-
TABLE 7: GLOBAL BLENDERS MARKET, BY REGION, 2019-2035 (USD MILLION)
-
TABLE 8: NORTH AMERICA BLENDERS MARKET, BY COUNTRY, 2019-2035 (USD MILLION)
-
TABLE 9: NORTH AMERICA BLENDERS MARKET, BY PRODUCT TYPE, 2019-2035 (USD MILLION)
-
TABLE 10: NORTH AMERICA BLENDERS MARKET, BY POWER RATING, 2019-2035 (USD MILLION)
-
TABLE 11: NORTH AMERICA BLENDERS MARKET, BY MATERIAL, 2019-2035 (USD MILLION)
-
TABLE 12: NORTH AMERICA BLENDERS MARKET, BY PRICE RANGE, 2019-2035 (USD MILLION)
-
TABLE 13: NORTH AMERICA BLENDERS MARKET, BY END USE, 2019-2035 (USD MILLION)
-
TABLE 14: NORTH AMERICA BLENDERS MARKET, BY DISTRIBUTION CHANNEL, 2019-2035 (USD MILLION)
-
TABLE 15: US BLENDERS MARKET, BY REGION, 2019-2035 (USD MILLION)
-
TABLE 16: US BLENDERS MARKET, BY PRODUCT TYPE, 2019-2035 (USD MILLION)
-
TABLE 17: US BLENDERS MARKET, BY POWER RATING, 2019-2035 (USD MILLION)
-
TABLE 18: US BLENDERS MARKET, BY MATERIAL, 2019-2035 (USD MILLION)
-
TABLE 19: US BLENDERS MARKET, BY PRICE RANGE, 2019-2035 (USD MILLION)
-
TABLE 20: US BLENDERS MARKET, BY END USE, 2019-2035 (USD MILLION)
-
TABLE 21: US BLENDERS MARKET, BY DISTRIBUTION CHANNEL, 2019-2035 (USD MILLION)
-
TABLE 22: NORTHEAST BLENDERS MARKET, BY PRODUCT TYPE, 2019-2035 (USD MILLION)
-
TABLE 23: NORTHEAST BLENDERS MARKET, BY POWER RATING, 2019-2035 (USD MILLION)
-
TABLE 24: NORTHEAST BLENDERS MARKET, BY MATERIAL, 2019-2035 (USD MILLION)
-
TABLE 25: NORTHEAST BLENDERS MARKET, BY PRICE RANGE, 2019-2035 (USD MILLION)
-
TABLE 26: NORTHEAST BLENDERS MARKET, BY END USE, 2019-2035 (USD MILLION)
-
TABLE 27: NORTHEAST BLENDERS MARKET, BY DISTRIBUTION CHANNEL, 2019-2035 (USD MILLION)
-
TABLE 28: SOUTHWEST BLENDERS MARKET, BY PRODUCT TYPE, 2019-2035 (USD MILLION)
-
TABLE 29: SOUTHWEST BLENDERS MARKET, BY POWER RATING, 2019-2035 (USD MILLION)
-
TABLE 30: SOUTHWEST BLENDERS MARKET, BY MATERIAL, 2019-2035 (USD MILLION)
-
TABLE 31: SOUTHWEST BLENDERS MARKET, BY PRICE RANGE, 2019-2035 (USD MILLION)
-
TABLE 32: SOUTHWEST BLENDERS MARKET, BY END USE, 2019-2035 (USD MILLION)
-
TABLE 33: SOUTHWEST BLENDERS MARKET, BY DISTRIBUTION CHANNEL, 2019-2035 (USD MILLION)
-
TABLE 34: WEST BLENDERS MARKET, BY PRODUCT TYPE, 2019-2035 (USD MILLION)
-
TABLE 35: WEST BLENDERS MARKET, BY POWER RATING, 2019-2035 (USD MILLION)
-
TABLE 36: WEST BLENDERS MARKET, BY MATERIAL, 2019-2035 (USD MILLION)
-
TABLE 37: WEST BLENDERS MARKET, BY PRICE RANGE, 2019-2035 (USD MILLION)
-
TABLE 38: WEST BLENDERS MARKET, BY END USE, 2019-2035 (USD MILLION)
-
TABLE 39: WEST BLENDERS MARKET, BY DISTRIBUTION CHANNEL, 2019-2035 (USD MILLION)
-
TABLE 40: SOUTHEAST BLENDERS MARKET, BY PRODUCT TYPE, 2019-2035 (USD MILLION)
-
TABLE 41: SOUTHEAST BLENDERS MARKET, BY POWER RATING, 2019-2035 (USD MILLION)
-
TABLE 42: SOUTHEAST BLENDERS MARKET, BY MATERIAL, 2019-2035 (USD MILLION)
-
TABLE 43: SOUTHEAST BLENDERS MARKET, BY PRICE RANGE, 2019-2035 (USD MILLION)
-
TABLE 44: SOUTHEAST BLENDERS MARKET, BY END USE, 2019-2035 (USD MILLION)
-
TABLE 45: SOUTHEAST BLENDERS MARKET, BY DISTRIBUTION CHANNEL, 2019-2035 (USD MILLION)
-
TABLE 46: MIDWEST BLENDERS MARKET, BY PRODUCT TYPE, 2019-2035 (USD MILLION)
-
TABLE 47: MIDWEST BLENDERS MARKET, BY POWER RATING, 2019-2035 (USD MILLION)
-
TABLE 48: MIDWEST BLENDERS MARKET, BY MATERIAL, 2019-2035 (USD MILLION)
-
TABLE 49: MIDWEST BLENDERS MARKET, BY PRICE RANGE, 2019-2035 (USD MILLION)
-
TABLE 50: MIDWEST BLENDERS MARKET, BY END USE, 2019-2035 (USD MILLION)
-
TABLE 51: MIDWEST BLENDERS MARKET, BY DISTRIBUTION CHANNEL, 2019-2035 (USD MILLION)
-
TABLE 52: CANADA BLENDERS MARKET, BY PRODUCT TYPE, 2019-2035 (USD MILLION)
-
TABLE 53: CANADA BLENDERS MARKET, BY POWER RATING, 2019-2035 (USD MILLION)
-
TABLE 54: CANADA BLENDERS MARKET, BY MATERIAL, 2019-2035 (USD MILLION)
-
TABLE 55: CANADA BLENDERS MARKET, BY PRICE RANGE, 2019-2035 (USD MILLION)
-
TABLE 56: CANADA BLENDERS MARKET, BY END USE, 2019-2035 (USD MILLION)
-
TABLE 57: CANADA BLENDERS MARKET, BY DISTRIBUTION CHANNEL, 2019-2035 (USD MILLION)
-
TABLE 58: EUROPE BLENDERS MARKET, BY COUNTRY, 2019-2035 (USD MILLION)
-
TABLE 59: EUROPE BLENDERS MARKET, BY PRODUCT TYPE, 2019-2035 (USD MILLION)
-
TABLE 60: EUROPE BLENDERS MARKET, BY POWER RATING, 2019-2035 (USD MILLION)
-
TABLE 61: EUROPE BLENDERS MARKET, BY MATERIAL, 2019-2035 (USD MILLION)
-
TABLE 62: EUROPE BLENDERS MARKET, BY PRICE RANGE, 2019-2035 (USD MILLION)
-
TABLE 63: EUROPE BLENDERS MARKET, BY END USE, 2019-2035 (USD MILLION)
-
TABLE 64: EUROPE BLENDERS MARKET, BY DISTRIBUTION CHANNEL, 2019-2035 (USD MILLION)
-
TABLE 65: GERMANY BLENDERS MARKET, BY PRODUCT TYPE, 2019-2035 (USD MILLION)
-
TABLE 66: GERMANY BLENDERS MARKET, BY POWER RATING, 2019-2035 (USD MILLION)
-
TABLE 67: GERMANY BLENDERS MARKET, BY MATERIAL, 2019-2035 (USD MILLION)
-
TABLE 68: GERMANY BLENDERS MARKET, BY PRICE RANGE, 2019-2035 (USD MILLION)
-
TABLE 69: GERMANY BLENDERS MARKET, BY END USE, 2019-2035 (USD MILLION)
-
TABLE 70: GERMANY BLENDERS MARKET, BY DISTRIBUTION CHANNEL, 2019-2035 (USD MILLION)
-
TABLE 71: FRANCE BLENDERS MARKET, BY PRODUCT TYPE, 2019-2035 (USD MILLION)
-
TABLE 72: FRANCE BLENDERS MARKET, BY POWER RATING, 2019-2035 (USD MILLION)
-
TABLE 73: FRANCE BLENDERS MARKET, BY MATERIAL, 2019-2035 (USD MILLION)
-
TABLE 74: FRANCE BLENDERS MARKET, BY PRICE RANGE, 2019-2035 (USD MILLION)
-
TABLE 75: FRANCE BLENDERS MARKET, BY END USE, 2019-2035 (USD MILLION)
-
TABLE 76: FRANCE BLENDERS MARKET, BY DISTRIBUTION CHANNEL, 2019-2035 (USD MILLION)
-
TABLE 77: ITALY BLENDERS MARKET, BY PRODUCT TYPE, 2019-2035 (USD MILLION)
-
TABLE 78: ITALY BLENDERS MARKET, BY POWER RATING, 2019-2035 (USD MILLION)
-
TABLE 79: ITALY BLENDERS MARKET, BY MATERIAL, 2019-2035 (USD MILLION)
-
TABLE 80: ITALY BLENDERS MARKET, BY PRICE RANGE, 2019-2035 (USD MILLION)
-
TABLE 81: ITALY BLENDERS MARKET, BY END USE, 2019-2035 (USD MILLION)
-
TABLE 82: ITALY BLENDERS MARKET, BY DISTRIBUTION CHANNEL, 2019-2035 (USD MILLION)
-
TABLE 83: UK BLENDERS MARKET, BY PRODUCT TYPE, 2019-2035 (USD MILLION)
-
TABLE 84: UK BLENDERS MARKET, BY POWER RATING, 2019-2035 (USD MILLION)
-
TABLE 85: UK BLENDERS MARKET, BY MATERIAL, 2019-2035 (USD MILLION)
-
TABLE 86: UK BLENDERS MARKET, BY PRICE RANGE, 2019-2035 (USD MILLION)
-
TABLE 87: UK BLENDERS MARKET, BY END USE, 2019-2035 (USD MILLION)
-
TABLE 88: UK BLENDERS MARKET, BY DISTRIBUTION CHANNEL, 2019-2035 (USD MILLION)
-
TABLE 89: RUSSIA BLENDERS MARKET, BY PRODUCT TYPE, 2019-2035 (USD MILLION)
-
TABLE 90: RUSSIA BLENDERS MARKET, BY POWER RATING, 2019-2035 (USD MILLION)
-
TABLE 91: RUSSIA BLENDERS MARKET, BY MATERIAL, 2019-2035 (USD MILLION)
-
TABLE 92: RUSSIA BLENDERS MARKET, BY PRICE RANGE, 2019-2035 (USD MILLION)
-
TABLE 93: RUSSIA BLENDERS MARKET, BY END USE, 2019-2035 (USD MILLION)
-
TABLE 94: RUSSIA BLENDERS MARKET, BY DISTRIBUTION CHANNEL, 2019-2035 (USD MILLION)
-
TABLE 95: SPAIN BLENDERS MARKET, BY PRODUCT TYPE, 2019-2035 (USD MILLION)
-
TABLE 96: SPAIN BLENDERS MARKET, BY POWER RATING, 2019-2035 (USD MILLION)
-
TABLE 97: SPAIN BLENDERS MARKET, BY MATERIAL, 2019-2035 (USD MILLION)
-
TABLE 98: SPAIN BLENDERS MARKET, BY PRICE RANGE, 2019-2035 (USD MILLION)
-
TABLE 99: SPAIN BLENDERS MARKET, BY END USE, 2019-2035 (USD MILLION)
-
TABLE 100: SPAIN BLENDERS MARKET, BY DISTRIBUTION CHANNEL, 2019-2035 (USD MILLION)
-
TABLE 101: REST OF EUROPE BLENDERS MARKET, BY PRODUCT TYPE, 2019-2035 (USD MILLION)
-
TABLE 102: REST OF EUROPE BLENDERS MARKET, BY POWER RATING, 2019-2035 (USD MILLION)
-
TABLE 103: REST OF EUROPE BLENDERS MARKET, BY MATERIAL, 2019-2035 (USD MILLION)
-
TABLE 104: REST OF EUROPE BLENDERS MARKET, BY PRICE RANGE, 2019-2035 (USD MILLION)
-
TABLE 105: REST OF EUROPE BLENDERS MARKET, BY END USE, 2019-2035 (USD MILLION)
-
TABLE 106: REST OF EUROPE BLENDERS MARKET, BY DISTRIBUTION CHANNEL, 2019-2035 (USD MILLION)
-
TABLE 107: ASIA-PACIFIC (APAC) BLENDERS MARKET, BY COUNTRY,, 2019-2035 (USD MILLION)
-
TABLE 108: ASIA-PACIFIC (APAC) BLENDERS MARKET, BY PRODUCT TYPE, 2019-2035 (USD MILLION)
-
TABLE 109: ASIA-PACIFIC (APAC) BLENDERS MARKET, BY POWER RATING, 2019-2035 (USD MILLION)
-
TABLE 110: ASIA-PACIFIC (APAC) BLENDERS MARKET, BY MATERIAL, 2019-2035 (USD MILLION)
-
TABLE 111: ASIA-PACIFIC (APAC) BLENDERS MARKET, BY PRICE RANGE, 2019-2035 (USD MILLION)
-
TABLE 112: ASIA-PACIFIC (APAC) BLENDERS MARKET, BY END USE, 2019-2035 (USD MILLION)
-
TABLE 113: ASIA-PACIFIC (APAC) BLENDERS MARKET, BY DISTRIBUTION CHANNEL, 2019-2035 (USD MILLION)
-
TABLE 114: CHINA BLENDERS MARKET, BY PRODUCT TYPE, 2019-2035 (USD MILLION)
-
TABLE 115: CHINA BLENDERS MARKET, BY POWER RATING, 2019-2035 (USD MILLION)
-
TABLE 116: CHINA BLENDERS MARKET, BY MATERIAL, 2019-2035 (USD MILLION)
-
TABLE 117: CHINA BLENDERS MARKET, BY PRICE RANGE, 2019-2035 (USD MILLION)
-
TABLE 118: CHINA BLENDERS MARKET, BY END USE, 2019-2035 (USD MILLION)
-
TABLE 119: CHINA BLENDERS MARKET, BY DISTRIBUTION CHANNEL, 2019-2035 (USD MILLION)
-
TABLE 120: INDIA BLENDERS MARKET, BY PRODUCT TYPE, 2019-2035 (USD MILLION)
-
TABLE 121: INDIA BLENDERS MARKET, BY POWER RATING, 2019-2035 (USD MILLION)
-
TABLE 122: INDIA BLENDERS MARKET, BY MATERIAL, 2019-2035 (USD MILLION)
-
TABLE 123: INDIA BLENDERS MARKET, BY PRICE RANGE, 2019-2035 (USD MILLION)
-
TABLE 124: INDIA BLENDERS MARKET, BY END USE, 2019-2035 (USD MILLION)
-
TABLE 125: INDIA BLENDERS MARKET, BY DISTRIBUTION CHANNEL, 2019-2035 (USD MILLION)
-
TABLE 126: JAPAN BLENDERS MARKET, BY PRODUCT TYPE, 2019-2035 (USD MILLION)
-
TABLE 127: JAPAN BLENDERS MARKET, BY POWER RATING, 2019-2035 (USD MILLION)
-
TABLE 128: JAPAN BLENDERS MARKET, BY MATERIAL, 2019-2035 (USD MILLION)
-
TABLE 129: JAPAN BLENDERS MARKET, BY PRICE RANGE, 2019-2035 (USD MILLION)
-
TABLE 130: JAPAN BLENDERS MARKET, BY END USE, 2019-2035 (USD MILLION)
-
TABLE 131: JAPAN BLENDERS MARKET, BY DISTRIBUTION CHANNEL, 2019-2035 (USD MILLION)
-
TABLE 132: SOUTH KOREA BLENDERS MARKET, BY PRODUCT TYPE, 2019-2035 (USD MILLION)
-
TABLE 133: SOUTH KOREA BLENDERS MARKET, BY POWER RATING, 2019-2035 (USD MILLION)
-
TABLE 134: SOUTH KOREA BLENDERS MARKET, BY MATERIAL, 2019-2035 (USD MILLION)
-
TABLE 135: SOUTH KOREA BLENDERS MARKET, BY PRICE RANGE, 2019-2035 (USD MILLION)
-
TABLE 136: SOUTH KOREA BLENDERS MARKET, BY END USE, 2019-2035 (USD MILLION)
-
TABLE 137: SOUTH KOREA BLENDERS MARKET, BY DISTRIBUTION CHANNEL, 2019-2035 (USD MILLION)
-
TABLE 138: INDONESIA BLENDERS MARKET, BY PRODUCT TYPE, 2019-2035 (USD MILLION)
-
TABLE 139: INDONESIA BLENDERS MARKET, BY POWER RATING, 2019-2035 (USD MILLION)
-
TABLE 140: INDONESIA BLENDERS MARKET, BY MATERIAL, 2019-2035 (USD MILLION)
-
TABLE 141: INDONESIA BLENDERS MARKET, BY PRICE RANGE, 2019-2035 (USD MILLION)
-
TABLE 142: INDONESIA BLENDERS MARKET, BY END USE, 2019-2035 (USD MILLION)
-
TABLE 143: INDONESIA BLENDERS MARKET, BY DISTRIBUTION CHANNEL, 2019-2035 (USD MILLION)
-
TABLE 144: MALAYSIA BLENDERS MARKET, BY PRODUCT TYPE, 2019-2035 (USD MILLION)
-
TABLE 145: MALAYSIA BLENDERS MARKET, BY POWER RATING, 2019-2035 (USD MILLION)
-
TABLE 146: MALAYSIA BLENDERS MARKET, BY MATERIAL, 2019-2035 (USD MILLION)
-
TABLE 147: MALAYSIA BLENDERS MARKET, BY PRICE RANGE, 2019-2035 (USD MILLION)
-
TABLE 148: MALAYSIA BLENDERS MARKET, BY END USE, 2019-2035 (USD MILLION)
-
TABLE 149: MALAYSIA BLENDERS MARKET, BY DISTRIBUTION CHANNEL, 2019-2035 (USD MILLION)
-
TABLE 150: THAILAND BLENDERS MARKET, BY PRODUCT TYPE, 2019-2035 (USD MILLION)
-
TABLE 151: THAILAND BLENDERS MARKET, BY POWER RATING, 2019-2035 (USD MILLION)
-
TABLE 152: THAILAND BLENDERS MARKET, BY MATERIAL, 2019-2035 (USD MILLION)
-
TABLE 153: THAILAND BLENDERS MARKET, BY PRICE RANGE, 2019-2035 (USD MILLION)
-
TABLE 154: THAILAND BLENDERS MARKET, BY END USE, 2019-2035 (USD MILLION)
-
TABLE 155: THAILAND BLENDERS MARKET, BY DISTRIBUTION CHANNEL, 2019-2035 (USD MILLION)
-
TABLE 156: REST OF APAC BLENDERS MARKET, BY PRODUCT TYPE, 2019-2035 (USD MILLION)
-
TABLE 157: REST OF APAC BLENDERS MARKET, BY POWER RATING, 2019-2035 (USD MILLION)
-
TABLE 158: REST OF APAC BLENDERS MARKET, BY MATERIAL, 2019-2035 (USD MILLION)
-
TABLE 159: REST OF APAC BLENDERS MARKET, BY PRICE RANGE, 2019-2035 (USD MILLION)
-
TABLE 160: REST OF APAC BLENDERS MARKET, BY END USE, 2019-2035 (USD MILLION)
-
TABLE 161: REST OF APAC BLENDERS MARKET, BY DISTRIBUTION CHANNEL, 2019-2035 (USD MILLION)
-
TABLE 162: SOUTH AMERICA BLENDERS MARKET, BY PRODUCT TYPE, 2019-2035 (USD MILLION)
-
TABLE 163: SOUTH AMERICA BLENDERS MARKET, BY PRODUCT TYPE, 2019-2035 (USD MILLION)
-
TABLE 164: SOUTH AMERICA BLENDERS MARKET, BY POWER RATING, 2019-2035 (USD MILLION)
-
TABLE 165: SOUTH AMERICA BLENDERS MARKET, BY MATERIAL, 2019-2035 (USD MILLION)
-
TABLE 166: SOUTH AMERICA BLENDERS MARKET, BY PRICE RANGE, 2019-2035 (USD MILLION)
-
TABLE 167: SOUTH AMERICA BLENDERS MARKET, BY END USE, 2019-2035 (USD MILLION)
-
TABLE 168: SOUTH AMERICA BLENDERS MARKET, BY DISTRIBUTION CHANNEL, 2019-2035 (USD MILLION)
-
TABLE 169: BRAZIL BLENDERS MARKET, BY PRODUCT TYPE, 2019-2035 (USD MILLION)
-
TABLE 170: BRAZIL BLENDERS MARKET, BY POWER RATING, 2019-2035 (USD MILLION)
-
TABLE 171: BRAZIL BLENDERS MARKET, BY MATERIAL, 2019-2035 (USD MILLION)
-
TABLE 172: BRAZIL BLENDERS MARKET, BY PRICE RANGE, 2019-2035 (USD MILLION)
-
TABLE 173: BRAZIL BLENDERS MARKET, BY END USE, 2019-2035 (USD MILLION)
-
TABLE 174: BRAZIL BLENDERS MARKET, BY DISTRIBUTION CHANNEL, 2019-2035 (USD MILLION)
-
TABLE 175: MEXICO BLENDERS MARKET, BY PRODUCT TYPE, 2019-2035 (USD MILLION)
-
TABLE 176: MEXICO BLENDERS MARKET, BY POWER RATING, 2019-2035 (USD MILLION)
-
TABLE 177: MEXICO BLENDERS MARKET, BY MATERIAL, 2019-2035 (USD MILLION)
-
TABLE 178: MEXICO BLENDERS MARKET, BY PRICE RANGE, 2019-2035 (USD MILLION)
-
TABLE 179: MEXICO BLENDERS MARKET, BY END USE, 2019-2035 (USD MILLION)
-
TABLE 180: MEXICO BLENDERS MARKET, BY DISTRIBUTION CHANNEL, 2019-2035 (USD MILLION)
-
TABLE 181: ARGENTINA BLENDERS MARKET, BY PRODUCT TYPE, 2019-2035 (USD MILLION)
-
TABLE 182: ARGENTINA BLENDERS MARKET, BY POWER RATING, 2019-2035 (USD MILLION)
-
TABLE 183: ARGENTINA BLENDERS MARKET, BY MATERIAL, 2019-2035 (USD MILLION)
-
TABLE 184: ARGENTINA BLENDERS MARKET, BY PRICE RANGE, 2019-2035 (USD MILLION)
-
TABLE 185: ARGENTINA BLENDERS MARKET, BY END USE, 2019-2035 (USD MILLION)
-
TABLE 186: ARGENTINA BLENDERS MARKET, BY DISTRIBUTION CHANNEL, 2019-2035 (USD MILLION)
-
TABLE 187: REST OF SOUTH AMERICA BLENDERS MARKET, BY PRODUCT TYPE, 2019-2035 (USD MILLION)
-
TABLE 188: REST OF SOUTH AMERICA BLENDERS MARKET, BY POWER RATING, 2019-2035 (USD MILLION)
-
TABLE 189: REST OF SOUTH AMERICA BLENDERS MARKET, BY MATERIAL, 2019-2035 (USD MILLION)
-
TABLE 190: REST OF SOUTH AMERICA BLENDERS MARKET, BY PRICE RANGE, 2019-2035 (USD MILLION)
-
TABLE 191: REST OF SOUTH AMERICA BLENDERS MARKET, BY END USE, 2019-2035 (USD MILLION)
-
TABLE 192: REST OF SOUTH AMERICA BLENDERS MARKET, BY DISTRIBUTION CHANNEL, 2019-2035 (USD MILLION)
-
TABLE 193: MIDDLE EAST & AFRICA (MEA) BLENDERS MARKET, BY PRODUCT TYPE, 2019-2035 (USD MILLION)
-
TABLE 194: MIDDLE EAST & AFRICA (MEA) BLENDERS MARKET, BY PRODUCT TYPE, 2019-2035 (USD MILLION)
-
TABLE 195: MIDDLE EAST & AFRICA (MEA) BLENDERS MARKET, BY POWER RATING, 2019-2035 (USD MILLION)
-
TABLE 196: MIDDLE EAST & AFRICA (MEA) BLENDERS MARKET, BY MATERIAL, 2019-2035 (USD MILLION)
-
TABLE 197: MIDDLE EAST & AFRICA (MEA) BLENDERS MARKET, BY PRICE RANGE, 2019-2035 (USD MILLION)
-
TABLE 198: MIDDLE EAST & AFRICA (MEA) BLENDERS MARKET, BY END USE, 2019-2035 (USD MILLION)
-
TABLE 199: MIDDLE EAST & AFRICA (MEA) BLENDERS MARKET, BY DISTRIBUTION CHANNEL, 2019-2035 (USD MILLION)
-
TABLE 200: GCC COUNTRIES BLENDERS MARKET, BY PRODUCT TYPE, 2019-2035 (USD MILLION)
-
TABLE 201: GCC COUNTRIES BLENDERS MARKET, BY POWER RATING, 2019-2035 (USD MILLION)
-
TABLE 202: GCC COUNTRIES BLENDERS MARKET, BY MATERIAL, 2019-2035 (USD MILLION)
-
TABLE 203: GCC COUNTRIES BLENDERS MARKET, BY PRICE RANGE, 2019-2035 (USD MILLION)
-
TABLE 204: GCC COUNTRIES BLENDERS MARKET, BY END USE, 2019-2035 (USD MILLION)
-
TABLE 205: GCC COUNTRIES BLENDERS MARKET, BY DISTRIBUTION CHANNEL, 2019-2035 (USD MILLION)
-
TABLE 206: SOUTH AFRICA BLENDERS MARKET, BY PRODUCT TYPE, 2019-2035 (USD MILLION)
-
TABLE 207: SOUTH AFRICA BLENDERS MARKET, BY POWER RATING, 2019-2035 (USD MILLION)
-
TABLE 208: SOUTH AFRICA BLENDERS MARKET, BY MATERIAL, 2019-2035 (USD MILLION)
-
TABLE 209: SOUTH AFRICA BLENDERS MARKET, BY PRICE RANGE, 2019-2035 (USD MILLION)
-
TABLE 210: SOUTH AFRICA BLENDERS MARKET, BY END USE, 2019-2035 (USD MILLION)
-
TABLE 211: SOUTH AFRICA BLENDERS MARKET, BY DISTRIBUTION CHANNEL, 2019-2035 (USD MILLION)
-
TABLE 212: REST OF MEA BLENDERS MARKET, BY PRODUCT TYPE, 2019-2035 (USD MILLION)
-
TABLE 213: REST OF MEA BLENDERS MARKET, BY POWER RATING, 2019-2035 (USD MILLION)
-
TABLE 214: REST OF MEA BLENDERS MARKET, BY MATERIAL, 2019-2035 (USD MILLION)
-
TABLE 215: REST OF MEA BLENDERS MARKET, BY PRICE RANGE, 2019-2035 (USD MILLION)
-
TABLE 216: REST OF MEA BLENDERS MARKET, BY END USE, 2019-2035 (USD MILLION)
-
TABLE 217: REST OF MEA BLENDERS MARKET, BY DISTRIBUTION CHANNEL, 2019-2035 (USD MILLION)
-
-
LIST OF FIGURES
-
FIGURE 1
-
FIGURE 1: GLOBAL BLENDERS MARKET SIZE, 2019-2035, USD MILLION
-
FIGURE 2: GLOBAL BLENDERS MARKET, Y-O-Y GROWTH ANALYSIS 2020-35 (%)
-
FIGURE 3: GLOBAL BLENDERS MARKET, BY REGION, MARKET SHARE 2024 (%)
-
FIGURE 4: GLOBAL BLENDERS MARKET SHARE, BY PRODUCT TYPE, 2024 (%)
-
FIGURE 5: GLOBAL BLENDERS MARKET SHARE, BY POWER RATING, 2024 (%)
-
FIGURE 6: GLOBAL BLENDERS MARKET SHARE, BY MATERIAL, 2024 (%)
-
FIGURE 7: GLOBAL BLENDERS MARKET SHARE, BY PRICE RANGE, 2024 (%)
-
FIGURE 8: GLOBAL BLENDERS MARKET SHARE, BY END USER , 2024 (%)
-
FIGURE 9: GLOBAL BLENDERS MARKET SHARE, BY DISTRIBUTION CHANNEL , 2024 (%)
-
FIGURE 10: GLOBAL BLENDERS MARKET GROWTH FACTOR ANALYSIS (2025-2035)
-
FIGURE 11: GLOBAL BLENDERS MARKET, BY PRODUCT TYPE, 2024 (%)
-
FIGURE 12: GLOBALBLENDERS MARKET, BY POWER RATING, 2024 (%)
-
FIGURE 13: GLOBAL BLENDERS MARKET SHARE, BY MATERIAL, 2024 (%)
-
FIGURE 14: GLOBAL BLENDERS MARKET SHARE, BY PRICE RANGE, 2024 (%)
-
FIGURE 15: GLOBAL BLENDERS MARKET SHARE, BY END USER , 2024 (%)
-
FIGURE 16: GLOBAL BLENDERS MARKET SHARE, BY DISTRIBUTION CHANNEL , 2024 (%)
-
FIGURE 17: GLOBAL BLENDERS MARKET VALUE, BY REGION, 2024 (USD MILLION)
-
FIGURE 18: GLOBAL BLENDERS MARKET SHARE ANALYSIS, BY REGION, 2024 (%)
-
FIGURE 19: NORTH AMERICA BLENDERS MARKET SHARE ANALYSIS, BY COUNTRY, 2024 (%)
-
FIGURE 20: US BLENDERS MARKET SHARE ANALYSIS, BY REGION, 2024 (%)
-
FIGURE 21: EUROPE BLENDERS MARKET SHARE ANALYSIS, BY COUNTRY, 2024 (%)
-
FIGURE 22: ASIA-PACIFIC BLENDERS MARKET SHARE ANALYSIS, BY COUNTRY, 2024 (%)
-
FIGURE 23: SOUTH AMERICA BLENDERS MARKET SHARE ANALYSIS, BY COUNTRY, 2024 (%)
-
FIGURE 24: MIDDLE EAST AND AFRICA BLENDERS MARKET VALUE, BY COUNTRY, 2024 (USD MILLION)
-
FIGURE 25: MARKET SHARE ANALYSIS, 2024
-
FIGURE 26: COMPETITOR DASHBOARD: GLOBAL BLENDERS MARKET
-
FIGURE 27: SHARKNINJA / NINJA: SWOT ANALYSIS
-
FIGURE 28: PHILIPS (VERSUNI): SWOT ANALYSIS
-
FIGURE 29: KITCHENAID (WHIRLPOOL): SWOT ANALYSIS
-
FIGURE 30: HAMILTON BEACH: SWOT ANALYSIS
-
FIGURE 31: VITAMIX: SWOT ANALYSIS
-
FIGURE 32: CUISINART (CONAIR): SWOT ANALYSIS
-
FIGURE 33: BREVILLE / SAGE: SWOT ANALYSIS
-
FIGURE 34: PANASONIC: SWOT ANALYSIS
-
FIGURE 35: NUTRIBULLET (CAPITAL BRANDS): SWOT ANALYSIS
-
FIGURE 36: BLENDTEC: SWOT ANALYSIS


Leave a Comment