2026 Boat Rentals Market (2026 - 2035)

2026 Boat Rentals Market Size, Share & Growth Analysis Report By Boat Type (Yacht, Sailing Boat, Catamaran, Motorboat, RIB), By Power Source (IC Engine, Hybrid, Full-Electric), By Activity Type (Fishing, Leisure Sailing / Cruising, Watersports), By Booking Channel (Online Aggregator Platforms, Direct Marina / Operator Booking, Subscription & Club Models), By Rental Duration (Hourly, Half-Day, Full-Day, Multi-Day) and By Regional (North America, Europe, South America, Asia Pacific, Middle East and Africa) – Industry Growth & Forecast to 2035
ID: MRFR/AT/10438-HCR
128 Pages
Shubham Munde, Garvit Vyas
Last Updated: July 23, 2026
2026 Boat Rentals Market
Market Size
Forecast Period2026-2035
CAGR (2026-2035)6.1%
2025 Market SizeUSD 19.68 Billion
2035 Market SizeUSD 35.56 Billion
Key Players
GetMyBoat
Boatsetter
Click&Boat
Dream Yacht Group
The Moorings
Sunsail
Opportunities
  • Electric and Hybrid Fleet Transition
  • Emerging-Market Marina Development
  • Data Monetization and Dynamic Pricing

2026 Boat Rentals Market Summary

The global Boat Rental Market stood at USD 19.68 billion in 2025, with the forecast period beginning at USD 20.88 billion in 2026 and reaching an estimated USD 35.56 billion by 2035 at a compound annual growth rate of 6.1% CAGR. Two structural forces are pushing this trajectory: the decisive pivot from vessel ownership to access-based consumption — accelerated by peer-to-peer platform consolidation across 50+ countries — and the rebound in coastal and marine tourism that has yet to plateau. The European Commission's 2024 Sustainable Blue Economy initiative, channeling EUR 1.2 billion into maritime leisure infrastructure, underscores policy momentum behind the Boat Rental Market [1].

A technology transformation is reshaping fleet economics. Legacy IC-engine-only fleets are gradually giving way to hybrid and full-electric configurations as IMO 2030 decarbonization targets and local emission-free-zone ordinances take hold in the Mediterranean, Scandinavia, and the U.S. Great Lakes corridor. BloombergNEF estimates that marine battery pack costs dropped 18% between 2022 and 2024, making electric vessel rentals commercially viable for operators running sub-four-hour excursions [2]. Digital booking platforms have compressed the transaction cycle from days to minutes, and subscription-club models are converting occasional renters into recurring monthly users.

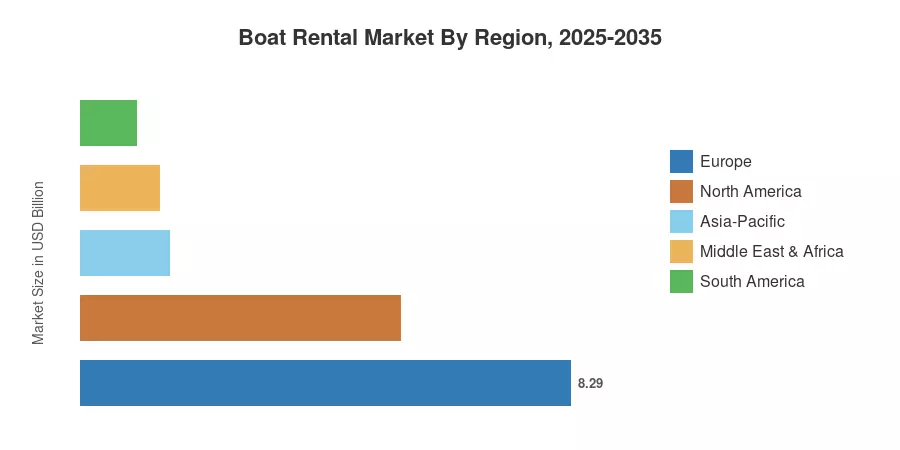
Europe commands roughly 42.1% of the Boat Rental Market, led by Greece, Croatia, and France, where charter tourism infrastructure is deeply established. Asia-Pacific is the fastest-growing region at a projected 7.6% CAGR through 2035, driven by expanding middle-class demand in Thailand, Indonesia, and Vietnam. North America holds the second-largest share at approximately 27.5%, anchored by Florida, the U.S. Virgin Islands, and British Columbia. As electrification mandates tighten and platform scale advantages widen, the Boat Rental Market is entering a decade of meaningful structural change.


Key Report Takeaways

• By Boat Type

  • Motorboats captured 44.8% of the Boat Rental Market in 2025, reflecting strong demand for day-trip and watersport-capable vessels.
  • Catamarans are forecast to grow at an 8.9% CAGR through 2035, driven by group-travel popularity and stability advantages for novice charterers.

• By Power Source

  • Internal-combustion engines still power the majority of rental fleets, though full-electric propulsion is advancing at a 17.2% CAGR as emission mandates accelerate fleet turnover.


• By Booking Channel


  • Online aggregator platforms accounted for 61.2% of the Boat Rental Market in 2025, consolidating fragmented local supply under unified digital marketplaces.

• By Region

  • Europe led with 42.1% of the Boat Rental Market in 2025, supported by mature charter tourism corridors in the Adriatic and Aegean seas.
  • Asia-Pacific is projected to expand at a 7.6% CAGR through 2035, with Thailand and Indonesia emerging as key demand centers.


Boat Rental Market Size and Forecast (2021–2035)

Market Research Future's estimates draw on primary interviews with fleet operators, platform transaction data, port authority filings, and validated secondary sources, including UNWTO tourism expenditure databases and national maritime safety registries. Historical figures reflect actual industry performance; forecast values apply a calibrated compound growth model anchored to the 2025 base year.
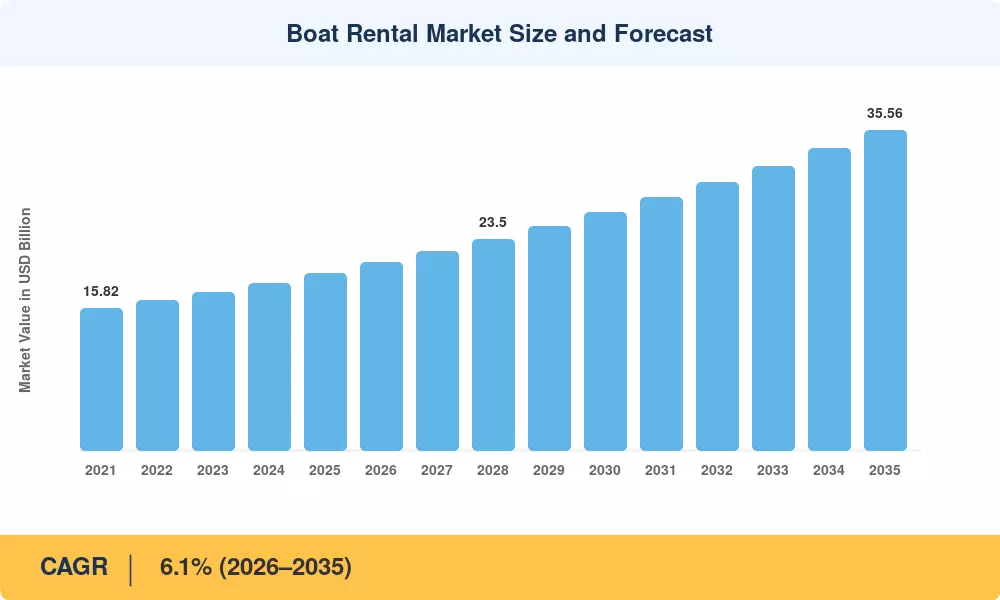
Boat Rental Market Size and Forecast
Our Impact
Enabled $4.3B Revenue Impact for Fortune 500 and Leading Multinationals
Partnering with 2000+ Global Organizations Each Year
30K+ Citations by Top-Tier Firms in the Industry

Driver Impact Analysis

Driver ~% Impact on CAGR Geographic Relevance Impact Timeline
Coastal & marine tourism rebound +1.4% Global Short-term (≤2 yr)
Digital booking platform consolidation +1.2% Global Short-term (≤2 yr)
Millennials' experience-over-ownership shift +0.9% North America, Europe Medium-term (2–4 yr)
Electrification mandates & fleet renewal +0.8% Europe, Scandinavia Long-term (≥4 yr)
Subscription & membership club models +0.7% North America, Europe Medium-term (2–4 yr)
Marina infrastructure investment +0.5% Asia-Pacific, MEA Long-term (≥4 yr)
Cross-border regulatory harmonization +0.4% Europe (EU) Medium-term (2–4 yr)


Coastal and Marine Tourism Rebound

According to UNWTO's 2024 Global Tourism Barometer, there were 1.5 billion foreign visitors, with coastal locations accounting for a record 38% of all leisure spending [3]. Since 2022, marina berth reservations have increased by double digits in island economies, including Greece, Croatia, and Thailand. Due to the overwhelming preference of first-time tourists for short-term rentals over asset purchases, this rise directly supports the boat rental market. In 2024, charter-related tourism receipts from Mediterranean regions alone were almost USD 3.1 billion [4].


Digital Platform Consolidation

The merger of two major peer-to-peer platforms in late 2024 created a marketplace aggregating vessel supply across 50 countries, significantly lowering search friction for consumers [5]. Real-time availability engines, integrated insurance, and embedded payment rails have compressed the average booking cycle from 72 hours to under 15 minutes. Platforms operating in the Boat Rental Market are now on board an estimated 45,000 new listings annually, expanding accessible inventory well beyond traditional yacht charter bases.

Electrification Mandates

Norway's zero-emission fjord mandate, effective 2026, and the EU's FuelEU Maritime regulation are forcing operators to evaluate battery-powered and hybrid vessels [2]. BloombergNEF forecasts marine battery costs to fall below USD 120/kWh by 2028, making electric day-rental vessels cost-competitive with diesel alternatives for trips under four hours. Operators investing early in electric fleets are capturing a price premium of 12–18% from environmentally conscious consumers.

Subscription and Membership Models

Boat-club subscriptions surged 34% year-over-year in 2024 across North America, converting occasional weekend renters into monthly recurring users [6]. Clubs such as Freedom Boat Club (now with 400+ locations) and regional equivalents in Europe are reducing customer acquisition costs while raising lifetime value. This model is reshaping the Boat Rental Market by smoothing seasonal demand troughs and improving fleet utilization rates from an industry average of 28% to over 45%.


Restraints Impact Analysis

The restraint estimates below reflect directional headwinds that moderate the Boat Rental Market growth rate. They are not directly subtracted from the CAGR and represent qualitative impact assessments.

Restraint ~% Impact on CAGR Geographic Relevance Impact Timeline
High vessel maintenance and insurance costs –0.6% Global Ongoing
Seasonal demand concentration –0.5% Europe, North America Ongoing
Fragmented local maritime regulations –0.4% Global Medium-term (2–4 yr)
Skilled crew and captain shortages –0.3% Europe, Caribbean Short-term (≤2 yr)
Environmental restrictions on waterways –0.3% Europe, North America Long-term (≥4 yr)


High Vessel Maintenance and Insurance Costs

Hull maintenance, winterization, engine servicing, and marine insurance premiums collectively represent 18–25% of annual operating costs for rental fleet operators [9]. Insurance premiums rose an average of 11% in 2023–2024 across the Lloyd's marine market, squeezing margins for smaller operators. These cost pressures create a barrier to fleet expansion in the Boat Rental Market and accelerate consolidation as subscale operators exit.

Seasonal Demand Concentration

In Northern Europe and the U.S. Northeast, 65–70% of annual rental revenue is concentrated in a four-month summer window [10]. This seasonality depresses annualized return on assets and complicates workforce planning. While Mediterranean and tropical markets experience less severe peaks, the industry-wide utilization average remains below 30%, constraining revenue potential for the Boat Rental Market.

Fragmented Maritime Regulations

The majority of U.S. states do not require a license for bareboat operation, but the EU requires ICC certifications [11]. This patchwork slows the rate of marketplace scalability by discouraging cross-border rents and raising compliance costs for platforms that aggregate supply globally.


2026 Boat Rentals Market Opportunities

Electric and Hybrid Fleet Transition

Operators that proactively convert 20–30% of their fleet to electric or hybrid configurations by 2028 can access emission-free zones expanding across Scandinavian fjords, Venetian waterways, and U.S. National Park lakes. Early movers in the Boat Rental Market report 12–18% higher daily rates for electric vessels and stronger repeat-booking metrics.

Emerging-Market Marina Development

Southeast Asian governments — led by Thailand's Eastern Seaboard marina initiative and Indonesia's "10 New Balis" tourism plan — are investing over USD 2 billion collectively in coastal leisure infrastructure through 2030 [8]. These markets currently represent less than 5% of global rental revenue, creating a greenfield opportunity for platform operators to establish first-mover supply networks.

Data Monetization and Dynamic Pricing

Platforms in the Boat Rental Market sitting on millions of booking transactions can monetize anonymized demand data for marina developers, tourism boards, and vessel manufacturers. Dynamic-pricing algorithms, already common in ride-hailing, are being adapted for marine rentals to optimize yield per sailing hour — early adopters report 15–22% revenue uplift.

Corporate and Event Charter Expansion

Private events, incentive travel, and corporate team-building are underutilized verticals. By 2030, dedicated B2B booking engines with group-coordination tools, responsibility waivers, and invoicing might open up an estimated USD 1.8 billion additional opportunity in the boat rental market [7].


Autonomous Docking and Navigation Aids

Assisted-docking and GPS-guided route-planning technology is lowering the skill barrier for unlicensed renters, expanding the addressable customer base. Garmin and Raymarine autonomous-docking retrofits are already being tested in Florida marina networks.


2026 Boat Rentals Market Future Outlook

Platform Economics and Network Effects

The Boat Rental Market is consolidating around a handful of digital platforms that benefit from classic marketplace network effects — more listings attract more renters, which attract more listings. By 2030, the top five platforms are projected to control over 55% of online bookings globally, compressing margins for standalone operators while expanding total addressable demand through reduced search friction [5].

Electrification Supercycle

Over the next ten years, the move to marine electrification will change the makeup of the fleet. According to IEA estimates, battery-electric boats may make up 15–20% of newly registered small boats by 2032, up from less than 2% in 2024 [2]. The capital expenditure premium for electric boats, which is currently 30–40% higher than diesel equivalents, is predicted to drop to 10–15% by 2029 for boat rental market operators as battery prices drop.


AI-Driven Operations and Dynamic Pricing

Artificial intelligence is being deployed across pricing, fleet positioning, and predictive maintenance within the Boat Rental Market. Machine-learning algorithms that analyze weather patterns, local events, and historical demand data can adjust hourly rates in real time, boosting revenue-per-vessel by an estimated 15–22% [17]. Predictive maintenance models are reducing unplanned downtime by 30%, directly improving fleet availability.

ESG Reporting and Sustainability Certification

Institutional investors and corporate clients are increasingly requiring ESG compliance from marine leisure operators. The Global Sustainable Tourism Council (GSTC) launched its marine charter certification program in 2024, and operators holding this credential report 20% higher booking rates from corporate event planners [18]. Sustainability reporting requirements will become table stakes for larger operators in the Boat Rental Market competing for B2B contracts.


2026 Boat Rentals Market Segmentation

By Boat Type

Segment Key Metric Primary Demand Driver
Yacht USD 3.74 Billion (2025) Luxury tourism and corporate charters
Sailing Boat 14.6% share (2025) Traditional sailing experiences
Catamaran CAGR 8.9% (2026–2035) Group travel, stability for novice renters
Motorboat 44.8% share (2025) Watersports, fishing, and day trips
RIB CAGR 6.5% (2026–2035) Coastal excursions and diving support


Motorboats lead the Boat Rental Market by boat type, accounting for 44.8% of 2025 revenue. Their versatility across fishing, watersports, and casual cruising makes them the default choice for day-rental customers who prioritize ease of operation over sailing skill requirements. Operators in Florida, the Greek Islands, and the Côte d'Azur report that motorboat listings generate 2.5x higher booking frequency than sailing vessels of comparable size.

Catamarans are the fastest-growing boat type at an 8.9% CAGR, driven by their appeal to group travelers and multi-day renters seeking onboard living space. The Boat Rental Market sees particular catamaran demand in the British Virgin Islands, Croatia, and Thailand, where calm-water conditions favor their twin-hull design.

By Power Source

Segment Key Metric Primary Demand Driver
IC Engine 78.5% share (2025) Established infrastructure, long range
Hybrid USD 1.76 Billion (2025) Emission-zone compliance, cost hedging
Full-Electric CAGR 17.2% (2026–2035) Zero-emission mandates, premium pricing


IC engines remain dominant in the Boat Rental Market, supported by extensive fueling infrastructure and consumer familiarity. However, full-electric propulsion is growing at 17.2% CAGR as European emission-free zones expand and battery costs decline. Operators offering electric vessels in Norway and the Netherlands report willingness-to-pay premiums of 12–18% above diesel equivalents.

By Activity Type

Segment Key Metric Primary Demand Driver
Fishing 22.8% share (2025) Recreational angling tourism
Leisure Sailing / Cruising USD 10.00 Billion (2025) Vacation and sunset cruises
Watersports CAGR 8.1% (2026–2035) Wakeboarding, jet-skiing, parasailing


Leisure sailing and cruising generate the largest revenue pool in the Boat Rental Market, driven by multi-hour and multi-day bookings at higher price points. Watersports represent the fastest-growing activity at 8.1% CAGR as younger demographics seek adrenaline-driven experiences.

By Booking Channel

Segment Key Metric Primary Demand Driver
Online Aggregator Platforms 61.2% share (2025) Convenience, instant comparison
Direct Marina / Operator Booking USD 5.12 Billion (2025) Repeat customers, local relationships
Subscription & Club Models CAGR 11.5% (2026–2035) Recurring revenue, loyalty


Online aggregators command the largest channel share in the Boat Rental Market, benefiting from SEO dominance, integrated reviews, and embedded insurance. Subscription clubs, growing at 11.5% CAGR, are the most disruptive channel innovation, converting one-time renters into monthly paying members.

By Rental Duration

Segment Key Metric Primary Demand Driver
Hourly CAGR 9.9% (2026–2035) Urban waterfront experiences
Half-Day 24.3% share (2025) Fishing and sunset cruises
Full-Day 44.6% share (2025) Island-hopping and extended excursions
Multi-Day USD 2.95 Billion (2025) Vacation charters, flotilla holidays


Full-day rentals dominate the Boat Rental Market by duration, but hourly bookings are surging at 9.9% CAGR as urban waterfront rental kiosks expand in cities like Dubai, Miami, Barcelona, and Sydney.


Regional Market Share Analysis

Region Key Metric Primary Investment Themes
North America 27.5% share (2025) Club subscriptions; Great Lakes electrification
Europe USD 8.29 Billion (2025) Adriatic/Aegean expansion; EU emission zones
Asia-Pacific 7.6% CAGR (2026–2035) Marina buildout; middle-class demand
South America USD 0.94 Billion (2025) Brazil coastal tourism; Rio–Búzios corridor
Middle East & Africa 6.8% CAGR (2026–2035) Luxury tourism; Dubai/Red Sea giga-projects
Total USD 19.68 Billion (2025)

The Boat Rental Market is concentrated in regions with established maritime tourism infrastructure, though rapid growth in tropical and emerging coastal economies is shifting the balance. Europe and North America together represent nearly 70% of global revenue, while Asia-Pacific is closing the gap with the fastest CAGR through 2035.


North America

Country Key Metric Key Driver
US 78.2% of regional share Florida, the Great Lakes, and the Pacific Northwest demand
Canada CAGR 5.8% British Columbia and Ontario lake tourism
Mexico USD 0.31 Billion (2025) Baja California and Riviera Maya expansion


The United States dominates North America's Boat Rental Market thanks to an installed base of over 12 million registered recreational boats and a robust club-subscription ecosystem. Freedom Boat Club's network expansion to 400+ U.S. locations by 2025 has materially lowered the entry cost for first-time boaters, while platforms like Boatsetter and GetMyBoat aggregate tens of thousands of peer-to-peer listings [6].

Europe

Country Key Metric Key Driver
Germany USD 0.62 Billion (2025) Lake and Baltic Sea demand
UK 8.3% of regional share South Coast and Scottish Highlands
France CAGR 5.9% Côte d'Azur and Corsica charter hubs
Italy USD 0.98 Billion (2025) Sardinia, Amalfi, and Sicilian routes
Spain 9.4% of regional share Balearic Islands, Canary Islands
Nordic Countries CAGR 6.4% Norwegian fjord electrification mandates
Russia USD 0.18 Billion (2025) Black Sea and Volga River tourism
Rest of Europe 15.7% of regional share Croatia and Greece drive regional growth


Europe's dominance in the Boat Rental Market traces back to decades of charter tourism infrastructure across the Adriatic, Aegean, and Western Mediterranean. Croatia alone added 2,400 new marina berths between 2022 and 2024, while Greece's Golden Visa reforms continue attracting maritime leisure investment [14]. The EU's FuelEU Maritime regulation is prompting fleet operators to plan hybrid vessel acquisitions starting in 2026.

Asia-Pacific

Country Key Metric Key Driver
China USD 0.82 Billion (2025) Hainan FTP luxury boat tourism
India CAGR 8.9% Goa and Kerala backwater rentals
Japan 5.2% of regional share Okinawa and Seto Inland Sea
South Korea CAGR 7.1% Jeju Island and Busan coastal tourism
ASEAN USD 1.14 Billion (2025) Thailand, Indonesia, and Vietnam hubs
Rest of Asia-Pacific 6.4% of regional share Australia and New Zealand


Asia-Pacific is the fastest-growing region in the Boat Rental Market, fueled by rising disposable incomes and government-backed tourism infrastructure. Thailand's EEC marina project and Indonesia's "10 New Balis" strategy are catalyzing marina construction across previously underserved coastlines [8]. Hainan's Free Trade Port status has driven a 40% increase in luxury boat tourism arrivals since 2023.

South America

Country Key Metric Key Driver
Brazil 68.5% of regional share Rio, Búzios, and Florianópolis corridor
Argentina CAGR 5.4% Tigre Delta and Patagonian Lake tourism
Rest of South America USD 0.14 Billion (2025) Colombia and Chile coastal demand


Brazil anchors South America's Boat Rental Market, with Rio de Janeiro and the Northeastern coast attracting both domestic and international tourists. Digital platform penetration remains below 30% in the region, creating significant room for aggregator-led growth through 2035 [15].

Middle East & Africa

Country Key Metric Key Driver
Saudi Arabia CAGR 8.2% NEOM and Red Sea giga-projects
UAE 41.3% of regional share Dubai Marina and Abu Dhabi luxury tourism
South Africa USD 0.06 Billion (2025) Cape Town and Garden Route
Egypt CAGR 6.5% Red Sea diving and Nile cruise adjacency
Rest of MEA 18.9% of regional share Oman and Kenya coastal tourism


The UAE dominates MEA's Boat Rental Market through Dubai's established luxury tourism ecosystem, where yacht rental operators report 85%+ utilization during the November–April peak season [16]. Saudi Arabia's NEOM and Red Sea giga-project developments are expected to add over 1,200 marina berths by 2030, creating an entirely new supply base.


Boat Rental Market By Region, 2025-2035

Competitive Benchmarking

The Boat Rental Market exhibits moderate concentration with an estimated HHI below 800, reflecting a fragmented operator base alongside a few scaled digital platforms. The top five companies hold an estimated 25–32% combined revenue share. Technology-led scale advantages — particularly in marketplace liquidity, dynamic pricing, and cross-border payment infrastructure — are emerging as the primary competitive moat, gradually tilting the field toward platform-centric business models.

Company Est. Revenue Share Range Key Offerings Strategic Positioning
GetMyBoat ~5–8% Peer-to-peer marketplace, 10,000+ listings in 184 countries Largest global listing aggregator
Boatsetter ~4–7% Peer-to-peer rentals, captain matching, and insurance integration U.S.-focused with expansion into the Caribbean
Click&Boat ~4–6% European peer-to-peer platform, 50,000+ boats Market leader in France and the Mediterranean
Dream Yacht Group ~3–5% Managed fleet charters, flotilla holidays Vertically integrated operator with 1,000+ vessels
The Moorings ~3–5% Crewed and skippered charters, sailing schools Premium Caribbean and Mediterranean positioning
Sunsail ~2–4% Sailing vacations, flotilla programs, ASA-certified training Strong brand in sailing tourism
Zizoo ~2–3% Online yacht charter aggregator, European focus Technology-first booking experience
Nautal ~1–3% Mediterranean and Latin American marketplace Regional strength in Spain and Brazil
Sailo ~1–2% U.S. Northeast and Caribbean peer-to-peer rentals Niche urban-waterfront focus
Navigare Yachting ~1–2% Global catamaran and sailing yacht charters Premium multi-day charter specialist


Recent News & Developments


  • Click&Boat (August 2024): Acquired a Spanish peer-to-peer competitor, adding 8,000 listings across the Balearic and Canary Islands and consolidating Mediterranean coverage [19].
  • European Commission (June 2024): Announced EUR 1.2 billion in Sustainable Blue Economy grants targeting marina electrification and digital booking infrastructure across EU coastal regions [1].
  • Dream Yacht Group (March 2024): Launched a 50-vessel electric catamaran fleet for the Seychelles and Maldives markets, signaling commitment to zero-emission charter tourism [20].


  • Norway Ministry of Climate (November 2023): Finalized zero-emission zone regulations for World Heritage fjords effective 2026, requiring all rental operators in affected areas to transition to electric or hybrid vessels [13].
  • Boatsetter (September 2023): Integrated real-time weather and wave-condition overlays into its mobile app, reducing same-day cancellation rates by an estimated 22% [21].
  • Zizoo (May 2023): Partnered with Garmin to pilot autonomous-docking technology on 200 rental vessels across Croatian marinas, lowering the skill barrier for unlicensed renters [22].


2026 Boat Rentals Market Report Scope

Parameter Detail
Market Scope Global Boat Rental Market across all vessel types, power sources, activity types, booking channels, and rental durations
Study Period 2021–2035
CAGR (Forecast Period) 6.1% (2026–2035)
Market Size (2025) USD 19.68 Billion
Market Size (2035) USD 35.56 Billion
Fastest Growing Segment Full-Electric Propulsion (17.2% CAGR)
Companies Profiled 10 (GetMyBoat, Boatsetter, Click&Boat, Dream Yacht Group, The Moorings, Sunsail, Zizoo, Nautal, Sailo, Navigare Yachting)
Valuation Currency USD Billion


FAQs

How do fuel price fluctuations affect rental fleet operator margins in the Boat Rental Market?
Diesel accounts for 10–15% of per-trip operating costs; a 20% fuel price spike can compress net margins by 3–5 percentage points for IC-engine fleets [9]. Operators increasingly hedge fuel exposure through dynamic surcharges or fleet electrification.
What insurance structures are most common for peer-to-peer vessel sharing in the Boat Rental Market?
Platforms typically embed per-trip hull and liability policies underwritten by specialist marine insurers, with coverage activated at booking confirmation [9]. Renters pay a bundled premium of 8–12% above the base rental rate.
How does the Boat Rental Market handle crew certification for crewed charter bookings?
Platforms verify captain credentials against STCW, RYA, or USCG standards before listing approval, and many offer onboard orientation for first-time renters [12]. Crewed charters command a 30–50% price premium over self-skippered options.
What role does weather-data integration play in reducing cancellation rates within the Boat Rental Market?
Real-time wave, wind, and precipitation overlays allow renters to reschedule proactively, cutting same-day cancellations by up to 22% [21]. This boosts operator revenue predictability and fleet utilization.
How are marina operators collaborating with rental platforms in the Boat Rental Market?
Marinas increasingly offer preferential berth allocation and shore-power pricing to high-volume platform partners in exchange for guaranteed occupancy commitments [14]. These partnerships reduce idle berth time by an estimated 15–20%.
What cybersecurity risks do digital booking platforms face in the Boat Rental Market?
Payment fraud, identity spoofing, and GPS-tracker tampering are the primary threats; leading platforms invest 3–5% of revenue in fraud-detection AI and two-factor authentication [17]. PCI-DSS compliance is now a baseline requirement.
How do multi-day charter customers differ from hourly renters in the Boat Rental Market?
Multi-day customers skew older (35–55), book 60+ days in advance, and spend 4–6x more per transaction than hourly renters, who are typically younger urban consumers seeking spontaneous experiences [7].    
Author
Author
Author Profile
Shubham Munde LinkedIn
Team Lead - Research
Shubham brings over 7 years of expertise in Market Intelligence and Strategic Consulting, with a strong focus on the Automotive, Aerospace, and Defense sectors. Backed by a solid foundation in semiconductors, electronics, and software, he has successfully delivered high-impact syndicated and custom research on a global scale. His core strengths include market sizing, forecasting, competitive intelligence, consumer insights, and supply chain mapping. Widely recognized for developing scalable growth strategies, Shubham empowers clients to navigate complex markets and achieve a lasting competitive edge. Trusted by start-ups and Fortune 500 companies alike, he consistently converts challenges into strategic opportunities that drive sustainable growth.
Co-Author
Co-Author Profile
Garvit Vyas LinkedIn
Vice President - Operations
Garvit Vyas is a Research Analyst with experience in working across multiple industry domains in the market research sector. Over the past four years, he has been actively involved in analyzing diverse markets, gathering industry insights, and contributing to the development of comprehensive research reports. His work includes studying market trends, evaluating competitive landscapes, and supporting data-driven business insights. In the early phase of his career, Garvit worked on cross-domain research projects, which helped him build a strong foundation in market analysis, data interpretation, and industry intelligence across various sectors. Later, he transitioned into the Quality Control (QC) function, where he focuses on reviewing and refining research reports and marketing collaterals to ensure accuracy, consistency, and high editorial standards. His responsibilities include validating research data, improving report structure, and maintaining the overall quality of published content. Garvit is committed to maintaining strong research integrity and delivering reliable insights that support informed business decision-making.

Research Approach


Secondary Research

The secondary research process involved comprehensive analysis of regulatory databases, peer-reviewed maritime and tourism journals, industry publications, and authoritative recreational boating organizations. Key sources included the US Coast Guard (USCG), European Maritime Safety Agency (EMSA), National Marine Manufacturers Association (NMMA), International Council of Marine Industry Associations (ICOMIA), British Marine, National Association of State Boating Law Administrators (NASBLA), Recreational Boating & Fishing Foundation (RBFF), United Nations World Tourism Organization (UNWTO), National Oceanic and Atmospheric Administration (NOAA), EU Transport & Tourism Statistics, and national tourism ministry reports from key markets. These sources were used to collect boating participation statistics, maritime safety and regulatory compliance data, fleet capacity analysis, demographic trends, and market landscape analysis for fuel-powered boats, electric boats, sail boats, and other propulsion technologies across luxury, sports, and entry-level boat classes.


Primary Research

Qualitative and quantitative insights were obtained by interviewing supply-side and demand-side stakeholders during the primary research process. The supply-side sources consisted of CEOs, VPs of Fleet Operations, maritime compliance leaders, and commercial directors from boat rental operators, peer-to-peer platform providers, marina operators, and boat OEMs. The demand-side sources included charter fleet managers, tourism board directors, marine tourism operators, and procurement leads from luxury yacht services, recreational boating organizations, hotels & resorts, and online booking platforms. The primary research validated market segmentation, confirmed fleet expansion timelines, and collected insights on rental adoption patterns, pricing strategies, and seasonal demand dynamics.

Primary Respondent Breakdown:

By Designation: C-level Primaries (28%), Director Level (32%), Others (40%)

By Region: North America (32%), Europe (30%), Asia-Pacific (25%), Rest of World (13%)


Market Size Estimation

Global market valuation was derived through revenue mapping and rental transaction volume analysis. The methodology included:

Identification of 50+ key operators and platform providers across North America, Europe, Asia-Pacific, Latin America, and Middle East & Africa

Product mapping across fuel-powered boats, electric boats, sail boats, and other propulsion types segmented by boat size (up to 20 feet, 21-35 feet, above 36-50 feet) and boat class (luxury, sports, entry)

Analysis of reported and modeled annual revenues specific to boat rental portfolios

Coverage of operators and platforms representing 65-70% of global market share in 2024

Extrapolation using bottom-up (rental transaction volume × ASP by country/region) and top-down (operator revenue validation) approaches to derive segment-specific valuations for propulsion type, boat size, and boat class categories

This methodology aligns with the boat rental market structure (propulsion types: fuel-powered/sail/electric; boat sizes: up to 20ft/21-35ft/36-50ft; boat classes: luxury/sports/entry) while maintaining the rigorous framework of your original dermal fillers example.

Download Free Sample

Kindly complete the form below to receive a free sample of this Report

Download PDF ×

We do not share your information with anyone. However, we may send you emails based on your report interest from time to time. You may contact us at any time to opt-out.