Canada Circuit Breaker Market Segmentation
Canada Circuit Breaker Market By Type (USD Million, 2025-2035)
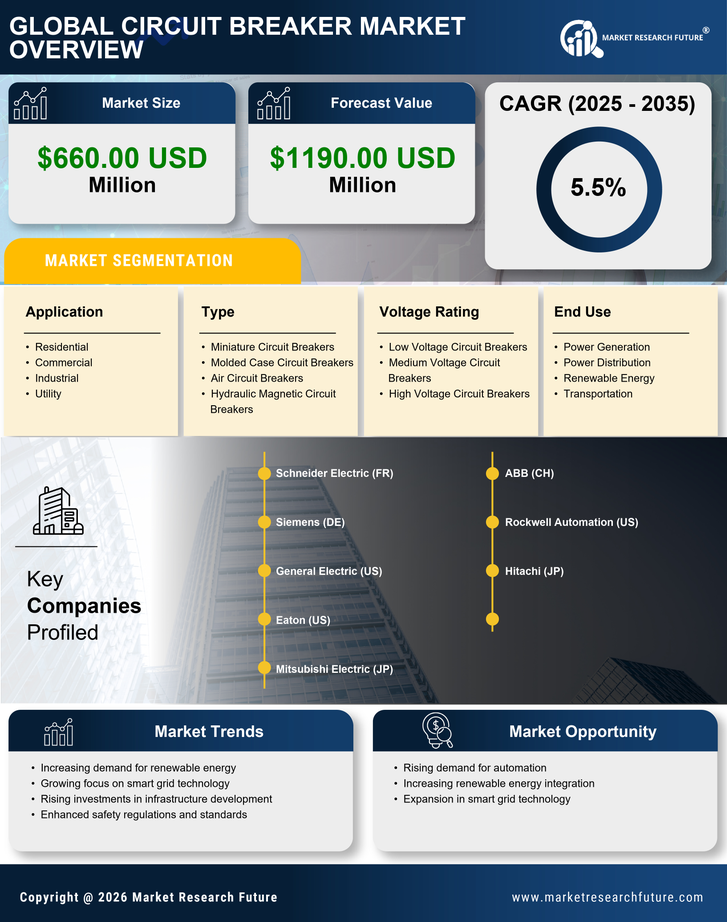
- Miniature Circuit Breakers
- Molded Case Circuit Breakers
- Air Circuit Breakers
- Hydraulic Magnetic Circuit Breakers
Canada Circuit Breaker Market By Voltage Rating (USD Million, 2025-2035)
- Low Voltage Circuit Breakers
- Medium Voltage Circuit Breakers
- High Voltage Circuit Breakers
Canada Circuit Breaker Market By Application (USD Million, 2025-2035)
- Residential
- Commercial
- Industrial
- Utility
Canada Circuit Breaker Market By End Use (USD Million, 2025-2035)
- Power Generation
- Power Distribution
- Renewable Energy
- Transportation