Capillary Blood Collection Devices Market Summary
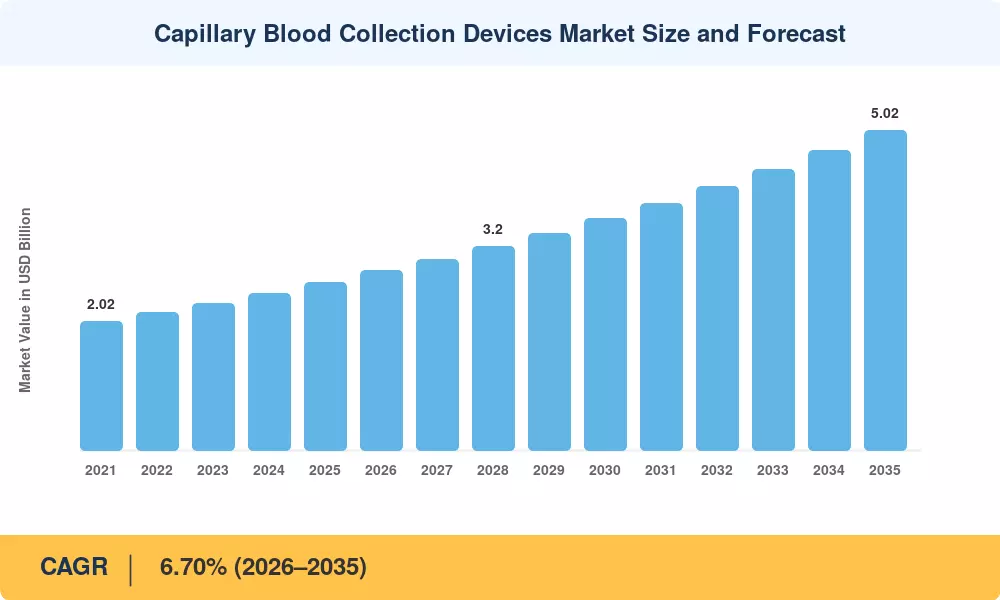
The Global Capillary Blood Collection Devices Market size was valued at USD 2.64 Billion in 2025, and the market is projected to grow from USD 2.80 Billion in 2026 to USD 5.02 Billion by 2035, registering a CAGR of 6.70% during the forecast period 2026–2035. Two catalysts anchor this trajectory: the WHO's accelerated push toward decentralized diagnostic infrastructure in low- and middle-income countries [2], and rising payer reimbursement for point-of-care blood collection across chronic disease management pathways in North America and Europe [3]. Fingerstick blood sampling continues to gain clinical acceptance as healthcare systems shift from centralized laboratory models toward rapid-turnaround, patient-centric testing frameworks.
A broader technology transformation is reshaping the Capillary Blood Collection Devices Market as traditional venipuncture workflows give way to volumetric microsampling devices, automated lancet blood collection platforms, and next-generation dried blood spot collection formats. The U.S. Centers for Medicare & Medicaid Services (CMS) allocated over USD 430 million in 2024 toward remote patient monitoring reimbursement codes that directly support capillary tube blood draw integration [4]. Meanwhile, manufacturers are embedding digital connectivity into sampling workflows, enabling real-time data transmission from point-of-care blood collection sites to centralized electronic health record (EHR) systems.
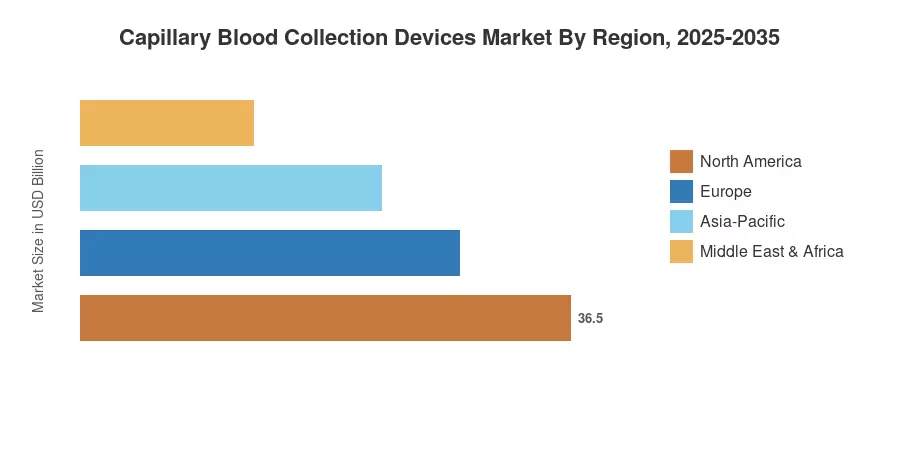
North America commands the largest regional share at approximately 42.3% of global revenue , driven by robust reimbursement infrastructure and a dense installed base of diagnostic laboratories adopting microsampling devices. Asia-Pacific stands out as the fastest-growing region with a projected CAGR of 8.05% through 2035, propelled by government screening mandates and expanding neonatal testing programs. Europe holds the second-largest position at roughly 26.8% share, where EU-IVDR regulatory harmonization is accelerating product approvals for lancet blood collection systems. The decade ahead will reward vendors that combine automated sampling precision with scalable digital reporting capabilities.
Key Report Takeaways
• By Product
- Lancing devices held an estimated 44.8% share of the Capillary Blood Collection Devices Market in 2025, reflecting their entrenched position in diabetic self-monitoring and routine clinical screening
- DBS (dried blood spot) cards represent the fastest-growing product segment, forecast to advance at a 9.12% CAGR through 2035 as pharmacogenomic testing and remote dried blood spot collection applications expand
- Micro-container tubes accounted for roughly USD 0.58 Billion in 2025, supported by pediatric and geriatric point-of-care blood collection protocols
• By Application
- Comprehensive metabolic panel testing captured approximately 33.2% of the Capillary Blood Collection Devices Market in 2025, underpinned by routine primary-care screening volumes
- Genetic and neonatal screening is projected to grow at a 9.25% CAGR to 2035, fueled by expanded newborn screening mandates across 50+ countries
• By End User
- Hospitals and clinics commanded roughly 50.4% of revenue in 2025, given their role as primary procurement channels for fingerstick blood sampling devices
- Home care settings are poised to expand at a 10.05% CAGR between 2026–2035, reflecting chronic disease self-management trends and telehealth integration
• By Region
- North America led the Capillary Blood Collection Devices Market with 42.3% share in 2025, anchored by CMS reimbursement policies and a mature diagnostics ecosystem
- Asia-Pacific is set to register an 8.05% CAGR through 2035, driven by India's Ayushman Bharat Health Infrastructure Mission and China's county-level hospital modernization programs
Market Size and Forecast (2021–2035)
MRFR's market sizing combines primary interviews with device manufacturers, procurement officers, and regulatory consultants alongside secondary validation from WHO Global Health Expenditure databases and published IVD market trackers. Historical figures derive from audited trade data and company disclosures; forecast values apply a bottom-up, segment-aggregated model calibrated against macroeconomic health expenditure projections.


.webp?v=1782976095)