Carbon Offset Carbon Credit Market (2026 - 2035)

Carbon Offset Carbon Credit Market Size, Share & Growth Analysis Report By Credit Type (Compliance Credits, Voluntary Credits), By Project Type (Nature-Based Solutions, Renewable Energy, Energy Efficiency, Carbon Removal (Engineered), Others (Waste, Methane)), By End User (Energy & Utilities, Aviation, Industrial Manufacturing, Oil & Gas, Technology & Finance, Others) and By Regional (North America, Europe, South America, Asia Pacific, Middle East and Africa) – Industry Growth & Forecast to 2035
ID: MRFR/EnP/10925-HCR
128 Pages
Priya Nagrale
Last Updated: July 02, 2026
Carbon Offset Carbon Credit Market
Market Size
Forecast Period2026-2035
CAGR (2026-2035)14.4%
2025 Market SizeUSD 1.87 Billion
2035 Market SizeUSD 7.18 Billion
Key Players
South Pole
Verra
Gold Standard
Climate Impact Partners
3Degrees
Pachama
Opportunities
  • Engineered Carbon Removal Credits
  • Tokenized and Exchange-Traded Carbon Products
  • Emerging Market Supply Development

Carbon Offset Carbon Credit Market Summary

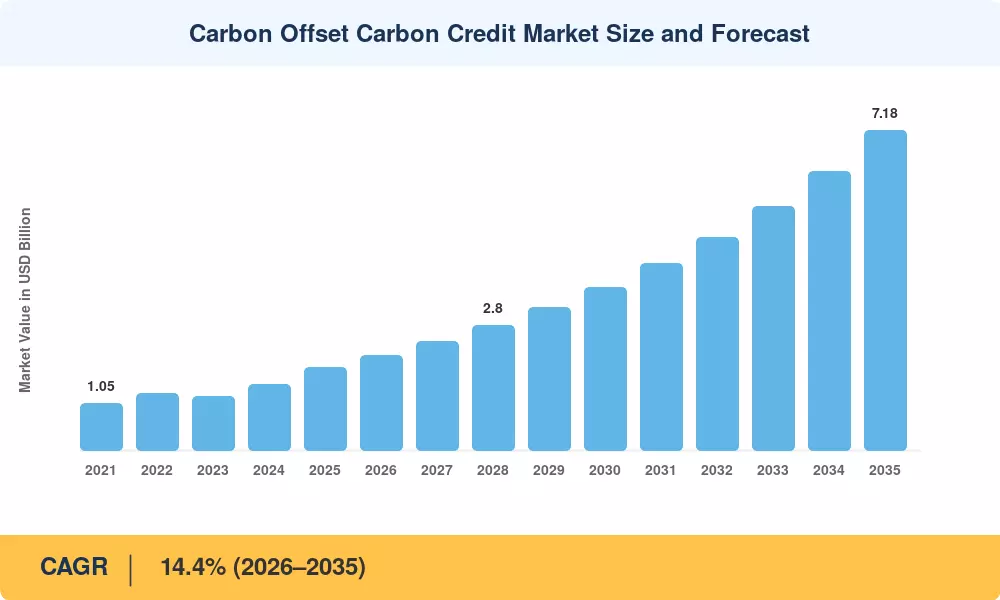
The Carbon Offset Carbon Credit Market reached an estimated USD 1.87 billion in 2025 and is projected to grow from USD 2.14 billion in 2026 to USD 7.18 billion by 2035, registering a CAGR of 14.4% during the forecast period (2026–2035). Two forces are accelerating this trajectory: the tightening of national emissions caps under Article 6 of the Paris Agreement and the surge of corporate climate pledges — over 6,000 companies globally have now set science-based targets, many requiring offset procurement to close residual emissions gaps [1]. Regulatory momentum, particularly through the EU Carbon Border Adjustment Mechanism (CBAM) that began its transitional phase in 2023, has injected compliance-driven urgency into credit demand [2].

A structural transformation is reshaping how credits are generated, verified, and retired. Legacy offset projects with opaque additionality claims are giving way to digitized measurement, reporting, and verification (MRV) platforms that use satellite imagery and IoT sensors. BloombergNEF estimates that investment in carbon-market infrastructure — registries, exchanges, and tokenization platforms — exceeded USD 1.3 billion in 2024 alone [3]. Governments are simultaneously expanding compliance schemes: China's national ETS now covers more than 5 billion tonnes of CO₂ annually, and South Korea's K-ETS tightened its free-allocation ratio by 3 percentage points in 2024 [4].

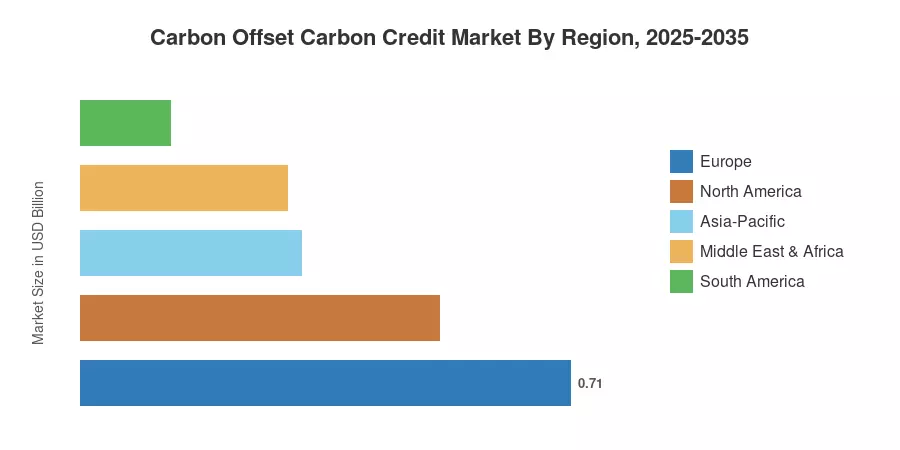
Europe commands the dominant share of the Carbon Offset Carbon Credit Market at approximately 38% of global value, underpinned by the EU Emissions Trading System's mature auction-based framework. Asia-Pacific is the fastest-growing region, posting a projected CAGR above 17%, driven by nascent compliance schemes in India, Indonesia, and Vietnam. North America holds the second-largest share near 28%, buoyed by California's cap-and-trade program and the Inflation Reduction Act's clean-energy incentives [5]. The convergence of mandatory disclosure rules and voluntary ambition suggests the Carbon Offset Carbon Credit Market will remain one of the highest-growth segments in environmental finance through 2035.


Key Report Takeaways

• By Credit Type

  • Compliance credits account for roughly 62% of the Carbon Offset Carbon Credit Market by value, reflecting the dominance of regulated ETS programs globally.
  • Voluntary credits are expanding at a CAGR of approximately 18.6% through 2035, driven by corporate sustainability mandates and rising demand from the aviation sector.

• By Project Type

  • Nature-based solutions represent the largest project category, valued at an estimated USD 0.58 billion in 2025, as forestry and land-use projects attract institutional capital.
  • Renewable energy credit projects are expected to grow at a CAGR near 13.2% as solar and wind additionality standards become more stringent.

• By Region

  • Europe holds the leading regional position in the Carbon Offset Carbon Credit Market, commanding a 38% share of global value in 2025.
  • Asia-Pacific is forecast to register the strongest CAGR at 17.1%, with China and India introducing new or expanded compliance mechanisms.
  • North America accounts for approximately USD 0.52 billion in 2025 revenue, anchored by California's cap-and-trade and voluntary purchases by US technology firms.


Carbon Offset Carbon Credit Market Size and Forecast (2021–2035)

Market Research Future analysts derived historical estimates from verified carbon registry transaction data (Gold Standard, Verra, American Carbon Registry) combined with compliance market auction records from ICAP. Forecast projections incorporate econometric modeling that weights regulatory pipeline probability, corporate pledge conversion rates, and credit price elasticity scenarios.
Carbon Offset Carbon Credit Market Size and Forecast
Our Impact
Enabled $4.3B Revenue Impact for Fortune 500 and Leading Multinationals
Partnering with 2000+ Global Organizations Each Year
30K+ Citations by Top-Tier Firms in the Industry

Driver Impact Analysis

Driver ~% Impact on CAGR Geographic Relevance Impact Timeline
Expansion of compliance ETS programs +3.2% Global Long-term (≥4 yr)
CORSIA aviation offset mandates +2.1% Global Medium-term (2–4 yr)
Corporate net-zero pledge conversion +2.5% North America, Europe Short-term (≤2 yr)
Article 6 bilateral credit transfers +1.8% Global Medium-term (2–4 yr)
Digital MRV and satellite verification +1.6% Global Medium-term (2–4 yr)
CBAM-induced demand for embedded carbon credits +1.9% Europe Short-term (≤2 yr)
Sovereign carbon credit mechanisms +1.3% Asia-Pacific, Africa Long-term (≥4 yr)


Expansion of Compliance ETS Programs

Governments are steadily widening the reach of emissions trading systems. China's national ETS — already the world's largest by covered emissions — is expected to add aluminum, cement, and petrochemicals to its scope between 2025 and 2028, potentially doubling its transaction volume [4]. Each new sector adds compliance buyers to the Carbon Offset Carbon Credit Market, pushing demand that supports higher credit prices and fresh project development.

CORSIA Aviation Offset Mandates

The International Civil Aviation Organization's Carbon Offsetting and Reduction Scheme for International Aviation (CORSIA) transitions from voluntary to mandatory phases in 2027, requiring airlines to offset growth in international emissions baseline at 85% of 2019 international aviation emissions from 2024 through 2035. The Taskforce on Scaling Voluntary Carbon Markets estimated that aviation alone could require 1.5–2.0 billion offset credits annually by 2035, representing a substantial new demand channel within the Carbon Offset Carbon Credit Market. Airlines like Delta and British Airways have already signed forward purchase agreements with major project developers to secure supply [15].

Corporate Net-Zero Pledge Conversion

More than 6,000 organizations globally have committed to science-based emissions objectives, and an increasing number are entering the offset procurement cycle as they deplete their internal abatement choices [1]. Microsoft’s USD 1 billion Climate Innovation Fund, Amazon’s USD 2 billion Climate Pledge Fund, and similar corporate organizations are directing funds toward permanent carbon removal projects. In 2024, the Science Based Targets initiative (SBTi) made it clear that environmental attribute certificates, including offsets, can be used for beyond value chain mitigation, opening the floodgates for a wave of structured corporate buying in the Carbon Offset Carbon Credit Market [16].


Digital MRV and Satellite Verification

The verification of legacy depended on field audits each year – a costly, lengthy and error-prone process. Providers such as Pachama, Sylvera and Satellite Vu now offer satellite-based MRV technologies that provide near-real-time biomass measurement and permanence monitoring for a fraction of the cost [13]. Both Verra and Gold Standard have incorporated remote-sensing data into improved procedures, cutting project crediting timelines from 18 months to less than 6 months. This results in quicker credit issuance, increased buyer confidence, and reduced transaction costs throughout the Carbon Offset Carbon Credit Market.


Restraints Impact Analysis

Restraint ~% Impact on CAGR Geographic Relevance Impact Timeline
Credit integrity and greenwashing scrutiny –1.8% Global Short-term (≤2 yr)
Price volatility and thin liquidity –1.2% Global Medium-term (2–4 yr)
Regulatory fragmentation across jurisdictions –0.9% Global Long-term (≥4 yr)
Additionality and permanence risk –1.0% Global Medium-term (2–4 yr)
Limited supply of high-quality removal credits –0.7% Global Short-term (≤2 yr)


Credit Integrity and Greenwashing Scrutiny

In 2023, investigation reports indicated that many rainforest protection credits given under some avoided deforestation methodology had inflated their climate impact by as much as 90% [8]. The consequence led to voluntary loan retirements dropping 20% in the second half of 2023 and caused Verra to prohibit new credit issuance under the legacy VM0007 methodology until it is revised. Near-term headwinds include further reputational damage to the Carbon Offset Carbon Credit Market. The Integrity Council for the Voluntary Carbon Market (ICVCM) published its Core Carbon Principles evaluation framework to help rebuild confidence.


Price Volatility and Thin Liquidity

Spot prices of voluntary carbon credits peaked at USD 16/tCO₂e in early 2022, before falling to below USD 3/tCO₂e by mid-2023 for nature-based avoidance credits on major markets. Such volatility hinders long-term forward contracting by corporate purchasers and discourages project developers from committing cash to multi-decade forestry or direct air capture initiatives. The compliance permits of the EU ETS are covered by market stability reserves, while the optional part of the Carbon Offset Carbon Credit Market lacks such price-floor provisions.


Regulatory Fragmentation

Globally, there’s no standard for how carbon credits are recognized across borders. The EU’s proposed anti-greenwashing directive has different limits on the use of credits than the US SEC’s climate disclosure rule, and the Article 6 matching adjustment requirements add a layer of complexity [14]. This patchwork raises compliance expenses for multinational offset buyers and hinders the Carbon Offset Carbon Credit Market’s move to frictionless cross-border trade.


Carbon Offset Carbon Credit Market Opportunities

Engineered Carbon Removal Credits

Direct air capture (DAC), enhanced rock weathering, and biochar offer high-permanence removal that addresses the integrity gap plaguing avoidance-based offsets. The US DOE's Carbon Negative Shot initiative targets a cost reduction to USD 100/tCO₂ for DAC by 2032, and advance purchase commitments from Frontier (backed by Stripe, Google, and ) totalling over USD 1 billion signal strong buyer appetite for durable removals [19].

Tokenized and Exchange-Traded Carbon Products

Blockchain-based registries and tokenized carbon credits are creating new on-ramp liquidity. The Carbonplace platform — backed by nine global banks — aims to standardize settlement for voluntary credits, while ICE and CME have expanded their carbon futures suites. This exchange-traded shift could attract institutional investors who currently find the Carbon Offset Carbon Credit Market too opaque and illiquid.

Emerging Market Supply Development

Africa and Southeast Asia hold vast untapped potential for nature-based credit generation. The Africa Carbon Markets Initiative (ACMI), launched at COP27, targets 300 million credits per year by 2030 and USD 6 billion in annual revenue for African communities [14]. With project development costs significantly lower than in OECD nations, these regions present a compelling supply-side opportunity.

CBAM-Linked Embedded Carbon Instruments

As the EU CBAM moves from transitional reporting to financial adjustments starting in 2026, importers of carbon-intensive goods will need to purchase CBAM certificates reflecting embedded emissions [2]. A secondary opportunity exists for intermediaries who bundle verified offset credits with CBAM compliance advisory services, creating a new revenue channel in the Carbon Offset Carbon Credit Market.

Data Monetization Through Credit Analytics

Companies like BeZero Carbon, Calyx Global, and Sylvera have built credit-rating platforms that score individual projects on additionality, permanence, and co-benefit metrics. These analytics products — subscription-based and transaction-fee models — represent a high-margin adjacent opportunity within the broader ecosystem of the Carbon Offset Carbon Credit Market.


Carbon Offset Carbon Credit Market Future Outlook

AI-Powered MRV and Autonomous Monitoring

Artificial intelligence will fundamentally reshape verification workflows across the Carbon Offset Carbon Credit Market. Machine-learning models trained on satellite imagery can now detect deforestation events within 48 hours, and autonomous drone-based LiDAR surveys can estimate above-ground biomass with sub-5% error margins [13]. A market report projects that, by 2028, digital MRV will reduce per-credit issuance costs by 30-40%, enabling micro-scale offset projects that were previously uneconomical.

Platform Economics and Market Infrastructure

Carbon exchanges, tokenized registries, and forward-contracting platforms are converting the Carbon Offset Carbon Credit Market from a bilateral brokerage model into a structured financial market. The World Bank estimates that Article 6-compliant registries will process over USD 10 billion in annual transactions by 2032, with standardized contracts enabling secondary trading and price discovery [10]. Institutional investors — sovereign wealth funds, pension managers, and ESG-mandated allocators — are expected to enter as liquidity providers once clearing and settlement infrastructure matures.

Carbon Removal Scale-Up

Engineered removal technologies are poised to graduate from demonstration to commercial scale. The US DOE's Regional DAC Hubs program has allocated USD 3.5 billion across four initial sites, with combined capture targets exceeding 4 million tonnes per year by 2030 [19]. Enhanced weathering startups like Lithos Carbon and UNDO are scaling deployments across agricultural land in the US Midwest and UK. Within the Carbon Offset Carbon Credit Market, removal credits are expected to command a price premium of 5–10× over avoidance credits, attracting project developers seeking higher margins.

Mandatory Climate Disclosure and Offset Demand

The convergence of SEC climate disclosure requirements, the EU Corporate Sustainability Reporting Directive (CSRD), and ISSB standards (IFRS S1 and S2) is creating a regulatory triad that compels listed companies to quantify, report, and manage their carbon exposure [22]. As mandatory reporting standardizes emissions accounting, the Carbon Offset Carbon Credit Market will benefit from clearer demand signals and more predictable procurement cycles, reducing the speculative volatility that plagued earlier periods.


Carbon Offset Carbon Credit Market Segmentation

By Credit Type

Segment Key Metric Primary Demand Driver
Compliance Credits 62% market share (2025) ETS regulations and government-mandated caps
Voluntary Credits CAGR 18.6% (2026–2035) Corporate sustainability pledges and SBTi targets


Compliance credits dominate the Carbon Offset Carbon Credit Market by value, underpinned by auction-driven pricing in mature schemes like the EU ETS and California's cap-and-trade. These credits trade at significantly higher prices per tonne than their voluntary counterparts, reflecting regulatory scarcity. Voluntary credits, while smaller in absolute terms, are expanding more rapidly as corporate buyers — particularly in technology, financial services, and consumer goods — seek to demonstrate beyond-compliance ambition.

By Project Type

Segment Key Metric Primary Demand Driver
Nature-Based Solutions USD 0.58 B (2025) Forestry conservation, reforestation, mangrove restoration
Renewable Energy CAGR 13.2% (2026–2035) Wind and solar additionality in developing markets
Energy Efficiency 12% market share (2025) Industrial efficiency retrofits; cookstove programs
Carbon Removal (Engineered) CAGR 28.3% (2026–2035) DAC, biochar, enhanced weathering
Others (Waste, Methane) 8% market share (2025) Landfill gas capture; agricultural methane destruction


Nature-based solutions remain the largest project category in the Carbon Offset Carbon Credit Market, attracting buyers who value biodiversity co-benefits alongside carbon sequestration. However, engineered carbon removal is the fastest-growing segment, reflecting buyer willingness to pay premium prices for permanence guarantees that forestry projects cannot match. DAC credits have traded above USD 600/tCO₂ on forward markets, compared to under USD 10/tCO₂ for standard nature-based avoidance credits [19].

By End User

Segment Key Metric Primary Demand Driver
Energy & Utilities 34% market share (2025) ETS compliance obligations; power-sector transition
Aviation CAGR 19.8% (2026–2035) CORSIA mandatory offset requirements
Industrial Manufacturing USD 0.27 B (2025) CBAM certificate demand; Scope 1 reduction gaps
Oil & Gas 14% market share (2025) Scope 3 liability; transition credibility strategies
Technology & Finance CAGR 16.4% (2026–2035) SBTi commitments; beyond-value-chain mitigation
Others 9% market share (2025) Agriculture, real estate, consumer goods


Energy and utilities represent the largest end-user group in the Carbon Offset Carbon Credit Market, primarily because power generators are captive participants in compliance ETS programs. Aviation is set to become the fastest-growing end-user segment as CORSIA's mandatory phase takes effect in 2027, with IATA projecting offset demand exceeding 600 million credits annually by 2035 [12].


Regional Market Share Analysis

Region Key Metric Primary Investment Themes
Europe 38% share of global market (2025) EU ETS expansion; CBAM compliance; offshore blue carbon
North America USD 0.52 B (2025) California cap-and-trade; IRA-linked incentives; DAC hubs
Asia-Pacific CAGR 17.1% (2026–2035) New compliance ETS launches; tropical forestry credits
South America 7% share of global market (2025) Amazon basin REDD+ projects; sovereign credit programs
Middle East & Africa CAGR 15.8% (2026–2035) ACMI pipeline; blue carbon in mangrove systems
Total USD 1.87 B (2025)

The Carbon Offset Carbon Credit Market exhibits a regionally differentiated structure shaped by compliance scheme maturity, forest cover, and corporate buyer concentration.


Europe

Country Key Metric Key Driver
Germany 24% of regional share Industrial decarbonization under EU ETS Phase IV
United Kingdom CAGR 13.8% UK ETS independence; Woodland Carbon Code
France USD 0.09 B (2025) Nuclear-complementary offset procurement
Rest of Europe 31% of regional share Nordic voluntary commitments; Swiss linking agreements


The EU ETS remains the world's most liquid compliance carbon market, with allowance prices sustaining above EUR 60/tCO₂ throughout 2024. Germany alone accounts for nearly a quarter of European credit demand, driven by heavy industry decarbonization timelines mandated under the Fit for 55 package. The UK's independent ETS, operational since 2021, has drawn differentiated pricing dynamics and prompted a separate ecosystem of UK-focused offset developers [7].

North America

Country Key Metric Key Driver
United States 78% of regional share Corporate voluntary purchases; state-level cap-and-trade
Canada CAGR 15.2% Federal carbon pricing backstop escalation
Mexico USD 0.02 B (2025) Pilot ETS; REDD+ early-stage projects


The United States drives the majority of North American activity in the Carbon Offset Carbon Credit Market, with California's cap-and-trade program generating over USD 5 billion in cumulative auction revenue since inception [5]. Canada's federal carbon price rose to CAD 80/tCO₂ in 2024 and is scheduled to reach CAD 170 by 2030, creating strong price signals for offset project development across forestry and agricultural methane destruction [20].

Asia-Pacific

Country Key Metric Key Driver
China 42% of regional share National ETS sectoral expansion
India CAGR 22.4% Carbon Credit Trading Scheme launch
Japan USD 0.06 B (2025) GX League voluntary trading; J-credit scheme
Rest of Asia-Pacific 18% of regional share Indonesia FOLU Net Sink; Vietnam pilot ETS


Asia-Pacific represents the fastest-growing region in the Carbon Offset Carbon Credit Market, with several countries launching or expanding compliance mechanisms simultaneously. India's Carbon Credit Trading Scheme, announced under the Energy Conservation Amendment Act of 2022, is expected to become operational by 2026, covering roughly 300 large emitters initially [11]. China's national ETS, despite low starting prices, covers 2,200+ power-sector entities and is expanding to include high-emitting industrial sectors by 2028 [4].

South America

Country Key Metric Key Driver
Brazil 64% of regional share Amazon basin forestry projects; regulated carbon market bill
Colombia CAGR 16.5% National carbon tax offset linkage
Rest of South America USD 0.02 B (2025) Peru and Chile early-stage project pipelines


Brazil is South America's dominant player in the Carbon Offset Carbon Credit Market, leveraging its vast tropical forest estates. The Brazilian Congress passed landmark carbon market legislation in late 2024, establishing a regulated cap-and-trade framework covering emitters exceeding 10,000 tCO₂/year [21]. Colombia's existing carbon tax allows emitters to surrender verified offsets in lieu of tax payments, creating a price-linked incentive structure that has catalyzed over 100 registered projects.

Middle East & Africa

Country Key Metric Key Driver
Kenya 32% of regional share Cookstove and forestry projects; ACMI leadership
UAE CAGR 18.7% Regional carbon exchange (ACX); COP28 momentum
South Africa USD 0.01 B (2025) Carbon tax offset provisions
Rest of MEA 29% of regional share Mangrove blue carbon; West African cookstove programs


Africa's carbon credit supply is growing rapidly under the ACMI framework, which targets 300 million credits per year by 2030 [14]. Kenya hosts the continent's largest concentration of registered projects, and the Abu Dhabi-based Africa Carbon Markets Initiative is channelling Gulf-state capital into East African forestry and clean-cooking ventures. The Carbon Offset Carbon Credit Market in this region is transitioning from aid-dependent project models to commercially viable sovereign-credit architectures.


Carbon Offset Carbon Credit Market By Region, 2025-2035

Competitive Benchmarking

The Carbon Offset Carbon Credit Market is moderately fragmented, with an estimated HHI below 800 and the top five participants holding a combined 22–28% revenue share. Competition spans project developers, standards bodies, exchanges, and ratings agencies — each occupying distinct but increasingly overlapping value-chain positions.

Company Est. Revenue Share Range Key Offerings for Carbon Offset Carbon Credit Market Strategic Positioning
South Pole ~5–8% Project development; advisory; portfolio management Largest independent project developer by volume
Verra (VCS Registry) ~4–6% Standards and registry services; VCS and SD VISta Dominant voluntary standard; transitioning methodologies
Gold Standard ~3–5% Certification; impact quantification Premium integrity positioning; SDG co-benefits focus
Climate Impact Partners ~2–4% Corporate offset portfolios; nature-based projects Rebranded from Natural Capital Partners; advisory focus
3Degrees ~2–3% Renewable energy + offset bundling; climate advisory US corporate buyer channel strength
Pachama ~1–3% AI-driven forest carbon verification Technology-first MRV disruptor
Carbon Direct ~1–3% Science-based carbon management; removal procurement Microsoft partnership; removal-credit specialist
Climeworks ~1–2% Direct air capture credit generation Industrial-scale DAC pioneer; Iceland & US operations
EcoAct (Atos Group) ~1–2% Sustainability consulting; offset procurement Integrated IT-consulting and carbon advisory model
Sylvera ~1–2% Carbon credit ratings and analytics platform Data-as-a-service model; institutional buyer tool


Recent News & Developments

  • Verra (November 2023): Launched the consolidated REDD+ methodology (VM0048), replacing four legacy avoided-deforestation approaches and introducing jurisdictional-scale nesting requirements to address historical overcrediting concerns [8].


  • Carbonplace (February 2023): Completed its first live transactions on its bank-led voluntary carbon credit settlement network, with nine founding banks including CIBC, UBS, and National Australia Bank participating [23].


  • India MOEFCC (July 2024): Released draft rules for the Carbon Credit Trading Scheme under the Energy Conservation Act, outlining obligated entities and a phased compliance timeline starting 2026 [11].
  • Brazil National Congress (December 2024): Passed the regulated carbon market bill (PL 182/2024), establishing a cap-and-trade system for emitters above 10,000 tCO₂/year with offset provision for up to 15% of obligations [21].


Carbon Offset Carbon Credit Market Report Scope

Parameter Detail
Market Scope Carbon Offset Carbon Credit Market — voluntary and compliance segments, project development, standards/registries, exchanges, and advisory services
Study Period 2021–2035
CAGR 14.4% (2026–2035)
Market Size Checkpoints USD 1.87 B (2025); USD 3.66 B (2030); USD 7.18 B (2035)
Fastest Growing Segments Engineered carbon removal (28.3% CAGR); Aviation end-user (19.8% CAGR); Asia-Pacific region (17.1% CAGR)
Companies Profiled South Pole, Verra, Gold Standard, Climate Impact Partners, 3Degrees, Pachama, Carbon Direct, Climeworks, EcoAct, Sylvera
Valuation Currency USD (constant 2025 dollars)


FAQs

How do compliance and voluntary carbon credits differ in terms of buyer obligations?
Compliance credits carry legally binding surrender obligations under government-mandated ETS programs, while voluntary credits are purchased at the buyer's discretion to meet self-imposed targets. Pricing in compliance markets is typically 5–15× higher per tonne.
What role does CORSIA play in shaping aviation-sector offset procurement strategies?
CORSIA requires airlines to offset international emissions growth above 2019 levels starting with its mandatory phase-in in 2027 [12]. Airlines are increasingly securing forward purchase agreements two to five years ahead of compliance deadlines.
How are digital MRV platforms changing the cost structure of credit verification?
Satellite and AI-based monitoring can reduce per-project verification costs by 40–60% compared to traditional field audits [13]. This makes smaller, community-scale projects economically viable for the first time.
What distinguishes high-integrity credits from low-quality offsets in buyer due diligence?
ICVCM Core Carbon Principles assess additionality, permanence, and robust quantification as minimum thresholds [9]. Buyers should cross-reference project-level ratings from agencies like Sylvera or BeZero before procurement.
How does the EU CBAM create indirect demand for carbon credits outside Europe?
The definitive phase of the EU CBAM accepts only verifiable domestic carbon taxes or localized compliance ETS frameworks paid inside third-party production territories to reduce import certificate obligations, rejecting voluntary offsets to prevent firms from gaming emissions liabilities with low-integrity credits.
What are the key risks in forward-contracting for carbon removal credits?
Technology risk, delivery default, and price discovery uncertainty are primary concerns. DAC credits have traded above USD 600/tCO₂ on forward markets, but costs must decline substantially for large-scale adoption [19].
How might Article 6 bilateral agreements reshape cross-border credit flows after 2027?
Article 6.2 enables sovereign-to-sovereign credit transfers with corresponding adjustments to national inventories, creating government-backed quality assurance [10]. Early bilateral deals between Switzerland, Ghana, and Thailand provide a template.    
Author
Author
Author Profile
Priya Nagrale LinkedIn
Senior Research Analyst
With an experience of over five years in market research industry (Chemicals & Materials domain), I gather and analyze market data from diverse sources to produce results, which are then presented back to a client. Also, provide recommendations based on the findings. As a Senior Research Analyst, I perform quality checks (QC) for market estimations, QC for reports, and handle queries and work extensively on client customizations. Also, handle the responsibilities of client proposals, report planning, report finalization, and execution

Research Approach


Secondary Research

The secondary research process involved comprehensive analysis of regulatory frameworks, peer-reviewed environmental journals, carbon market publications, and authoritative climate organizations. Key sources included the United Nations Framework Convention on Climate Change (UNFCCC), International Energy Agency (IEA), World Bank Carbon Pricing Dashboard, European Union Emissions Trading System (EU ETS), California Air Resources Board (CARB), Intergovernmental Panel on Climate Change (IPCC), National Oceanic and Atmospheric Administration (NOAA), International Carbon Reduction and Offset Alliance (ICROA), Gold Standard Registry, Verra (Verified Carbon Standard), Climate Action Reserve (CAR), American Carbon Registry (ACR), Carbon Disclosure Project (CDP), World Economic Forum (WEF) Global Risks Report, International Monetary Fund (IMF) Carbon Pricing Studies, International Renewable Energy Agency (IRENA), and national environmental ministry reports from key markets. These sources were used to collect carbon pricing data, regulatory compliance statistics, offset project registries, corporate sustainability trends, and market landscape analysis for compliance markets, voluntary markets, renewable energy projects, afforestation/reforestation initiatives, and other carbon sequestration technologies.


Primary Research

Qualitative and quantitative insights were obtained by interviewing supply-side and demand-side stakeholders during the primary research process. The supply-side sources consisted of CEOs, VPs of Sustainability Strategy, carbon registry heads, and commercial directors from carbon credit developers, verification authorities, and carbon trading platforms. Demand-side sources included procurement leads from Fortune 500 corporations, energy utilities, aviation carriers, industrial manufacturers, and financial institutions that participated in carbon markets, as well as chief sustainability officers, environmental compliance managers, and ESG directors. Market segmentation was verified, project pipeline timelines were confirmed, and insights regarding credit pricing dynamics, regulatory adoption patterns, and voluntary market participation trends were obtained through primary research.

Primary Respondent Breakdown:

By Designation: C-level Primaries (42%), Director Level (31%), Others (27%)

By Region: North America (32%), Europe (30%), Asia-Pacific (31%), Rest of World (7%)


Market Size Estimation

Global market valuation was derived through transaction volume analysis and credit price modeling. The methodology included:

Identification of 55+ key carbon credit developers, registries, and trading platforms across North America, Europe, Asia-Pacific, and Latin America

Project mapping across compliance carbon markets (EU ETS, California Cap-and-Trade, RGGI) and voluntary carbon markets (VCS, Gold Standard, CAR, ACR)

Analysis of reported and modeled annual transaction volumes specific to avoidance/reduction projects and removal

Download Free Sample

Kindly complete the form below to receive a free sample of this Report

Download PDF ×

We do not share your information with anyone. However, we may send you emails based on your report interest from time to time. You may contact us at any time to opt-out.
















