Download Free Sample
Kindly complete the form below to receive a free sample of this Report
Cell And Gene Supply Chain Services Market Research Report: Size, Share, Trend Analysis By End User Outlook (Pharmaceutical Companies, Biotechnology Companies, Research Institutions, Hospitals) By Application Outlook (Cell Therapy, Gene Therapy, Tissue Engineering, Regenerative Medicine) By Service Type Outlook (Logistics Services, Cold Chain Management, Inventory Management, Transportation Services) By Supply Chain Component Outlook (Raw Material Sourcing, Manufacturing Services, Distribution Services, Quality Control) By Region (North America, Europe, APAC, South America, MEA) - Growth Outlook & Industry Forecast To 2035
As per MRFR analysis, the Cell And Gene Supply Chain Services Market was estimated at 8.3 USD Billion in 2024. The market is projected to grow from 8.97 USD Billion in 2025 to 19.5 USD Billion by 2035, exhibiting a compound annual growth rate (CAGR) of 8.07% during the forecast period 2025 - 2035.
The Cell And Gene Supply Chain Services Market is poised for substantial growth driven by technological advancements and increasing demand for personalized medicine.
| 2024 Market Size | 8.3 (USD Billion) |
| 2035 Market Size | 19.5 (USD Billion) |
| CAGR (2025 - 2035) | 8.07% |
The Cell And Gene Supply Chain Services Market is currently experiencing a transformative phase, driven by advancements in biotechnology and an increasing demand for personalized medicine. This market encompasses a range of services that facilitate the development, manufacturing, and distribution of cell and gene therapies. As the healthcare landscape evolves, stakeholders are focusing on optimizing supply chain processes to ensure the timely delivery of these innovative therapies. The integration of cutting-edge technologies, such as automation and data analytics, appears to enhance efficiency and reduce operational costs, thereby fostering growth within this sector. Moreover, regulatory frameworks are adapting to accommodate the unique challenges posed by cell and gene therapies. This shift indicates a growing recognition of the importance of robust supply chain management in ensuring patient safety and product efficacy. Collaboration among various entities, including pharmaceutical companies, logistics providers, and regulatory bodies, seems essential for navigating the complexities of this market. As the Cell And Gene Supply Chain Services Market continues to expand, it is likely to attract significant investment, further propelling innovation and improving patient outcomes across the globe.
The incorporation of advanced technologies, such as artificial intelligence and blockchain, is reshaping the Cell And Gene Supply Chain Services Market. These innovations facilitate real-time tracking, enhance transparency, and improve decision-making processes, which are crucial for managing complex supply chains.
The evolving regulatory landscape is influencing the Cell And Gene Supply Chain Services Market. As authorities adapt to the unique requirements of cell and gene therapies, companies must navigate new compliance challenges, which may drive the demand for specialized supply chain services.
There is a growing emphasis on sustainability within the Cell And Gene Supply Chain Services Market. Stakeholders are increasingly prioritizing environmentally friendly practices, which may lead to the adoption of greener technologies and processes, ultimately benefiting both the industry and society.
The Cell And Gene Supply Chain Services Market experiences a notable surge in demand for advanced therapies, driven by the increasing prevalence of genetic disorders and chronic diseases. As healthcare providers seek innovative treatment options, the market for cell and gene therapies expands. According to recent estimates, the market is projected to grow at a compound annual growth rate of over 30% in the coming years. This growth is largely attributed to the successful outcomes of clinical trials and the approval of novel therapies, which necessitate robust supply chain services to ensure timely delivery and quality assurance. The complexity of these therapies, which often involve personalized medicine, further emphasizes the need for specialized supply chain solutions that can accommodate unique patient requirements and regulatory standards.
Technological advancements play a pivotal role in shaping the Cell And Gene Supply Chain Services Market. Innovations such as real-time tracking systems, temperature-controlled logistics, and automated inventory management are enhancing the efficiency and reliability of supply chains. The integration of artificial intelligence and machine learning into logistics operations allows for predictive analytics, optimizing routes and reducing delivery times. As the market for cell and gene therapies continues to expand, the demand for sophisticated logistics solutions becomes increasingly critical. It is estimated that the adoption of these technologies could reduce operational costs by up to 20%, thereby improving the overall sustainability of supply chain operations. Consequently, companies that leverage these advancements are likely to gain a competitive edge in the rapidly evolving market.
The Cell And Gene Supply Chain Services Market is increasingly shifting towards patient-centric solutions, reflecting a broader trend in healthcare. This focus emphasizes the importance of tailoring supply chain operations to meet the specific needs of patients receiving cell and gene therapies. As personalized medicine gains traction, supply chains must be agile and capable of accommodating unique patient requirements, such as customized dosages and delivery schedules. Companies that successfully implement patient-centric strategies are likely to enhance patient satisfaction and improve treatment outcomes. Furthermore, this approach may lead to increased loyalty and trust among healthcare providers and patients alike. The emphasis on patient-centricity is expected to drive innovation within the supply chain, fostering the development of new services and solutions that align with the evolving landscape of healthcare.
Investment in research and development is a key driver of the Cell And Gene Supply Chain Services Market. Pharmaceutical companies and biotech firms are allocating substantial resources to develop innovative therapies, which in turn fuels the demand for specialized supply chain services. Recent data indicates that R&D spending in the biopharmaceutical sector has reached unprecedented levels, with estimates suggesting an increase of over 15% annually. This trend underscores the importance of efficient supply chain management to support the complex processes involved in bringing new therapies to market. As companies strive to accelerate the development timeline, the need for agile and responsive supply chain solutions becomes paramount, ensuring that materials and products are available when needed.
The regulatory landscape surrounding cell and gene therapies is evolving, significantly impacting the Cell And Gene Supply Chain Services Market. Stringent compliance requirements necessitate that supply chain operations adhere to rigorous standards set by regulatory bodies. This includes ensuring the integrity and traceability of products throughout the supply chain. Companies must invest in robust quality management systems and documentation processes to meet these regulatory demands. As the market matures, the complexity of compliance is likely to increase, requiring supply chain services to adapt accordingly. It is anticipated that organizations that prioritize regulatory compliance will not only mitigate risks but also enhance their reputation and trust among stakeholders, thereby positioning themselves favorably in the competitive landscape.
In the Cell And Gene Supply Chain Services Market, the application segment is primarily divided into four areas: Cell Therapy, Gene Therapy, Tissue Engineering, and Regenerative Medicine. Among these, Cell Therapy holds the largest market share, driven by increased demand for advanced treatments and a rising number of clinical trials. Gene Therapy, on the other hand, is rapidly gaining traction, emerging as the fastest-growing segment due to innovations in genome editing technologies and an expanding portfolio of therapeutic applications.
Cell Therapy (Dominant) vs. Gene Therapy (Emerging)
Cell Therapy represents a dominant force in the Cell And Gene Supply Chain Services Market, characterized by its robust pipeline of therapies aimed at treating various diseases through the administration of living cells. This segment is well-established, boasting significant investments and a strong regulatory framework that supports ongoing clinical development. Gene Therapy, in contrast, is an emerging segment that is revolutionizing treatment paradigms through advancements in genetic modification techniques. This dynamic area is witnessing rapid growth driven by breakthroughs in CRISPR technology and increasing regulatory approvals, allowing for a greater variety of therapeutic solutions. Together, these segments illustrate the evolving landscape of cell and gene therapy innovations.
In the Cell And Gene Supply Chain Services Market, the service type segment is primarily dominated by Cold Chain Management, which plays a crucial role in maintaining the integrity of temperature-sensitive products. Logistics Services follow closely, providing essential support in the transportation of biologics and gene therapies. Together, these two service areas account for a significant portion of market share, reflecting their importance in ensuring the safe delivery of critical therapies. The growth of this segment is driven by increasing demand for advanced therapies, pushing the need for sophisticated logistics that can handle the complexities of cold chain requirements. As more gene and cell therapies gain approval, the logistics solutions must evolve to meet stricter regulations and unique handling requirements. Consequently, Logistics Services are witnessing rapid growth as companies invest in enhanced capabilities to manage this dynamic landscape.
Cold Chain Management (Dominant) vs. Inventory Management (Emerging)
Cold Chain Management is the dominant player in the Cell And Gene Supply Chain Services Market, ensuring that temperature-sensitive products, such as cell and gene therapies, are maintained within specified temperature ranges during storage and transportation. Its extensive infrastructure and technology are a critical differentiator, enabling the preservation of product integrity and efficacy. Conversely, Inventory Management is emerging as a necessary component, addressing the complexities of maintaining appropriate stock levels amidst fluctuating demands and regulatory challenges. Companies are increasingly recognizing the importance of robust inventory solutions to prevent stockouts or wastage, leading to innovative approaches in inventory tracking and management. The integration of inventory management with cold chain technologies is also gaining traction, enhancing overall supply chain efficiency.
In the Cell and Gene Supply Chain Services Market, Pharmaceutical Companies dominate with the largest market share, reflecting their extensive investment in gene therapies and advanced treatments. This segment capitalizes on established supply chains to ensure efficiency in the distribution of vital therapeutic products. In contrast, Biotechnology Firms, while smaller in overall market share, are rapidly growing due to innovations in gene editing and personalized medicine. These companies are driving changes in the market with groundbreaking research and development efforts.
Pharmaceutical Companies (Dominant) vs. Biotechnology Firms (Emerging)
Pharmaceutical Companies hold a dominant position in the cell and gene supply chain by leveraging their established infrastructures and extensive experience in regulatory compliance, product development, and global distribution. This segment benefits from significant capital investments and established partnerships, enabling steady supply chains for gene therapies. Conversely, Biotechnology Firms represent an emerging player, characterized by a strong focus on innovation, research, and development of novel therapies. Their agility allows them to rapidly adapt to new scientific discoveries and market needs, fostering collaboration with research institutions and hospitals, which amplifies their growth potential in the evolving landscape of cell and gene therapies.
In the Cell and Gene Supply Chain Services Market, there is a clear delineation in the market share among the product types. Currently, Cell Products dominate the segment, holding the largest share owing to their extensive application in therapeutic and research settings. In contrast, Gene Products are emerging rapidly, capturing a significant portion of market interest and applications aimed at innovative genetic therapies.
Cell Products (Dominant) vs. Gene Products (Emerging)
Cell Products are well-established within the supply chain, forming the backbone of this market. They encompass various cell types that are indispensable for regenerative medicine and therapeutic applications. Their proven efficacy and versatility contribute to a robust demand, positioning them as the dominant force. Conversely, Gene Products represent the evolving frontier of this market. With advancements in gene editing technologies and personalized medicine, they are gaining rapid traction. This segment is characterized by significant research and development investment, indicating a strong future crescendo in adoption as therapies aimed at genetic conditions become more mainstream.
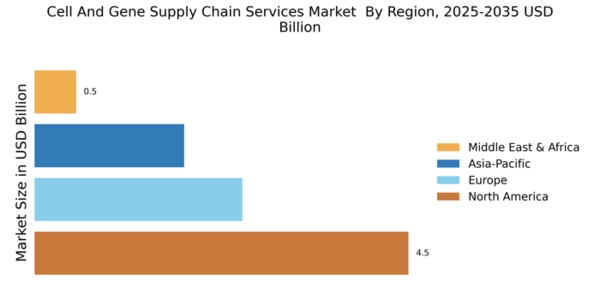
North America is poised to maintain its leadership in the Cell and Gene Supply Chain Services market, holding a significant market share of $4.5B in 2025. The region benefits from robust investment in biotechnology and healthcare, driven by increasing demand for personalized medicine and advanced therapies. Regulatory support from agencies like the FDA further catalyzes growth, ensuring a streamlined approval process for innovative treatments. The competitive landscape is characterized by key players such as Thermo Fisher Scientific, Catalent, and KBI Biopharma, which are leveraging cutting-edge technologies to enhance service offerings. The U.S. remains the largest market, with Canada also showing promising growth. The presence of established companies and a strong research infrastructure positions North America as a hub for advancements in cell and gene therapies.
Europe is witnessing a significant rise in the Cell and Gene Supply Chain Services market, projected to reach $2.5B by 2025. The region's growth is fueled by increasing investments in research and development, alongside supportive regulatory frameworks from the European Medicines Agency (EMA). The demand for innovative therapies is on the rise, driven by a growing aging population and the prevalence of chronic diseases. Leading countries such as Germany, the UK, and Switzerland are at the forefront of this expansion, hosting major players like Lonza and Merck KGaA. The competitive landscape is evolving, with a focus on collaboration between biotech firms and academic institutions. This synergy is expected to enhance the development and distribution of advanced therapies across Europe.
Asia-Pacific is emerging as a dynamic player in the Cell and Gene Supply Chain Services market, with a projected size of $1.8B by 2025. The region's growth is driven by increasing healthcare expenditure, a rising patient population, and advancements in biotechnology. Countries like China and Japan are leading the charge, supported by favorable government policies aimed at enhancing healthcare infrastructure and innovation. The competitive landscape features key players such as WuXi AppTec and Fujifilm Diosynth Biotechnologies, which are expanding their capabilities to meet the growing demand for cell and gene therapies. The region's focus on research and development, coupled with a growing number of clinical trials, positions Asia-Pacific as a critical market for future advancements in this sector.
The Middle East and Africa region is in the nascent stages of developing its Cell and Gene Supply Chain Services market, estimated at $0.5B by 2025. Growth is hindered by infrastructural challenges and limited access to advanced healthcare technologies. However, increasing investments in healthcare and biotechnology are beginning to reshape the landscape, driven by a rising demand for innovative treatments and therapies. Countries like South Africa and the UAE are making strides in establishing a regulatory framework to support the growth of this sector. The presence of local and international players is gradually increasing, with a focus on building partnerships to enhance service delivery. As the region continues to develop, it holds potential for significant growth in the coming years.
The Cell And Gene Supply Chain Services Market is currently characterized by a dynamic competitive landscape, driven by advancements in biopharmaceuticals and increasing demand for personalized medicine. Key players such as Thermo Fisher Scientific (US), Lonza (CH), and Catalent (US) are strategically positioned to leverage their extensive capabilities in manufacturing and logistics. These companies focus on innovation and operational efficiency, which are critical in meeting the complex requirements of cell and gene therapies. Their collective strategies, including partnerships and technological investments, significantly shape the competitive environment, fostering a landscape where agility and responsiveness are paramount.In terms of business tactics, companies are increasingly localizing manufacturing to enhance supply chain resilience and optimize logistics. The market appears moderately fragmented, with several players vying for market share while also collaborating on various projects. This competitive structure allows for a diverse range of services and solutions, catering to the unique needs of clients in the biopharmaceutical sector.
In November Thermo Fisher Scientific (US) announced the expansion of its gene therapy manufacturing capabilities in North America, a move that underscores its commitment to supporting the growing demand for advanced therapies. This strategic expansion is likely to enhance its service offerings and improve turnaround times, positioning the company favorably against competitors. The investment reflects a broader trend of companies seeking to bolster their manufacturing footprints in key regions to better serve their clients.
In October Lonza (CH) entered into a strategic partnership with a leading biotech firm to co-develop a new cell therapy platform. This collaboration is indicative of Lonza's focus on innovation and its intent to remain at the forefront of technological advancements in the sector. By aligning with biotech innovators, Lonza not only enhances its service portfolio but also strengthens its market position through shared expertise and resources.
In September Catalent (US) launched a new digital platform aimed at streamlining the supply chain for gene therapies. This initiative highlights the increasing importance of digital transformation in the industry, as companies seek to improve efficiency and transparency. Catalent's investment in digital solutions may provide it with a competitive edge, enabling faster and more reliable service delivery to clients.
As of December current trends in the Cell And Gene Supply Chain Services Market include a pronounced shift towards digitalization, sustainability, and the integration of AI technologies. Strategic alliances are becoming increasingly vital, as companies recognize the need for collaboration to navigate the complexities of the market. Looking ahead, competitive differentiation is likely to evolve, with a greater emphasis on innovation and technology rather than solely on price. The focus on supply chain reliability and responsiveness will be crucial as the market continues to mature.






The Cell And Gene Supply Chain Services Market is projected to grow at an 8.07% CAGR from 2025 to 2035, driven by advancements in biomanufacturing, regulatory support, and increasing demand for personalized therapies.
New opportunities lie in:
By 2035, the market is expected to be robust, reflecting substantial growth and innovation.
| MARKET SIZE 2024 | 8.3(USD Billion) |
| MARKET SIZE 2025 | 8.97(USD Billion) |
| MARKET SIZE 2035 | 19.5(USD Billion) |
| COMPOUND ANNUAL GROWTH RATE (CAGR) | 8.07% (2025 - 2035) |
| REPORT COVERAGE | Revenue Forecast, Competitive Landscape, Growth Factors, and Trends |
| BASE YEAR | 2024 |
| Market Forecast Period | 2025 - 2035 |
| Historical Data | 2019 - 2024 |
| Market Forecast Units | USD Billion |
| Key Companies Profiled | Thermo Fisher Scientific (US), Lonza (CH), Catalent (US), WuXi AppTec (CN), Boehringer Ingelheim (DE), Merck KGaA (DE), Sartorius (DE), Fujifilm Diosynth Biotechnologies (JP), KBI Biopharma (US) |
| Segments Covered | Application, Service Type, End User, Supply Chain Component |
| Key Market Opportunities | Integration of advanced logistics solutions enhances efficiency in the Cell And Gene Supply Chain Services Market. |
| Key Market Dynamics | Rising demand for personalized therapies drives innovation and efficiency in the Cell and Gene Supply Chain Services market. |
| Countries Covered | North America, Europe, APAC, South America, MEA |
As of 2024, the market valuation stands at 8.3 USD Billion.
The market is expected to reach a valuation of 19.5 USD Billion by 2035.
The market is anticipated to grow at a CAGR of 8.07% from 2025 to 2035.
The application segments include Cell Therapy, Gene Therapy, Tissue Engineering, and Regenerative Medicine, with valuations ranging from 1.5 to 5.8 USD Billion.
Key service types encompass Logistics Services, Cold Chain Management, Transportation Services, and Storage Solutions, with values between 1.5 and 5.8 USD Billion.
Primary end users include Pharmaceutical Companies, Biotechnology Firms, Research Institutions, and Hospitals, with market sizes from 1.3 to 8.0 USD Billion.
Product types consist of Cell Products, Gene Products, Tissue Products, and Biologics, with valuations ranging from 1.5 to 5.5 USD Billion.
Key players include Thermo Fisher Scientific, Lonza, Catalent, WuXi AppTec, and others.
Growth potential varies, with Cell Therapy and Gene Therapy showing the highest valuations, indicating robust demand.
Factors include advancements in biotechnology, increasing investments in research, and the rising demand for personalized medicine.



Kindly complete the form below to receive a free sample of this Report

“This is really good guys. Excellent work on a tight deadline. I will continue to use you going forward and recommend you to others. Nice job”


“Thanks. It’s been a pleasure working with you, please use me as reference with any other Intel employees.”


“Thanks for sending the report it gives us a good global view of the Betaïne market.”


“Thank you, this will be very helpful for OQS.”


“We found the report very insightful! we found your research firm very helpful. I'm sending this email to secure our future business.”


“I am very pleased with how market segments have been defined in a relevant way for my purposes (such as "Portable Freezers & refrigerators" and "last-mile"). In general the report is well structured. Thanks very much for your efforts.”


“I have been reading the first document or the study, ,the Global HVAC and FP market report 2021 till 2026. Must say, good info! I have not gone in depth at all parts, but got a good indication of the data inside!”


“We got the report in time, we really thank you for your support in this process. I also thank to all of your team as they did a great job.”


“The Automotive 48V ECU Components Procurement Intelligence Study” was a complex project, but the Market Research Future (MRFR) team handled it with quality, agility, and customer-centricity. They delivered all requested data on time and within the agreed scope. The team, including Shubhendra Anand and Rahul Gotadki, was always readily available to clarify questions and swiftly implement necessary adjustments, driving the project to a successful conclusion within a very demanding timeframe.
I would also like to specifically commend Akshay Agarwal for his responsiveness and support at every stage—from our initial inquiry on May 6th through to final delivery on June 18th. His dedication made the entire process seamless.”



